

African economic history has undergone an impressive revitalization over the past decade.Footnote 1 What is significant about this body of scholarly work is the systematic use of quantitative data to shed new light on the African past.Footnote 2 One strand of this renaissance of research uses aggregated macroeconomic variables – production, taxation, and exports – published in colonial reports and available in the archives of the colonizer.Footnote 3 These contributions are important but hampered by some limitations: because the figures are aggregated, often at the country level, they lack regional variation; because they provide only one observation annually and many confounding factors are usually at work at the national level, they rarely allow for hypothesis testing that identifies causes; and because primacy is given either to figures for settler activities or, in non-settler colonies, to figures for the formal colonial economy, such as cash crop production or urban workers, they fail to go beyond the limited scope of the colonial authority. Needless to say, for much of the pre-1950 period, information about the activities of the broader populace is very limited.Footnote 4
The emphasis is now shifting towards understanding the colonial experience from below. Economic historians of the continent are increasingly turning to African archives – in French West Africa,Footnote 5 British Africa,Footnote 6 and Dutch South AfricaFootnote 7 – to extract microdata: large datasets at the individual or household level. These are not survey data in the usual sense. Often, information was collected for administrative purposes very different from its use for researchers today. Attestation records of soldiers and police officers, for example, which list the individuals' heights and other biographical information, are used as proxies for investigating living standards,Footnote 8 and marriage records in mission station archives, which list age-at-marriage of converts, are used to investigate changing demographics and social trends, such as urbanization, during colonial times.Footnote 9
While the greater interest in African economic history from below is welcome, it should be noted that the use of quantifiable micro-level evidence also raises important questions about those groups not well documented in colonial records. Felix Meier zu Selhausen, for example, uses marriage records from Anglican parishes in Kampala, which he recognizes may introduce an urban bias into his results.Footnote 10 Even within urban Kampala, the data would exclude Ugandans who married in traditional ceremonies outside the Anglican Church. Anthropometric investigations, too, may suffer from sample selection bias.Footnote 11 This is not to discredit these and other historical data sources, nor to suggest that the authors are unaware of these limitations. But, in general, economic historians have sidestepped this problem in one of two ways: they ignore it, or they narrow the inference drawn from the results to apply to the sample only. Yet both strategies are problematic for methodological and moral reasons: by excluding the missing people, we risk reproducing the views of the colonial authorities or the European economic elite.
Missing people are not only of concern for African history. Our knowledge about indigenous people in North America and Latin America, for example, is equally limited, especially for the pre-Columbian period. Historians have to rely mainly on archaeological evidence, with the implication that they are better equipped to analyse pre-Columbian political systems than the lives of the people whose labour upheld those systems. For the post-Columbian period, it is commonly assumed, or has been until recently,Footnote 12 that the indigenous people, especially in the hacienda-based rural economies, played a negligible role as their numbers had effectively been reduced by European ‘guns, germs, and steel’.Footnote 13 Perhaps the most notable recent example of a study that fails to consider missing people is Daron Acemoglu, Simon Johnson, and James Robinson's analysis of European settlement in the New World and the institutions that were established.Footnote 14 The study neglects to take into account that as a precondition for establishing good institutions in North America, Australia, and New Zealand, the colonizers had to prevent or limit indigenous people's access to productive resources. In other words, to uphold their argument that the institutions in these cases were inclusive rather than extractive, the authors are obliged to partly disregard the experience of the indigenous population.
Our study analyses the extent to which the exclusion of indigenous populations distorts our quantitative analysis of the past. We use the case of the Dutch Cape Colony to show that accounting for groups excluded from colonial records matters in explaining sub-Saharan Africa's earliest episode of European colonization. Since the early 1980s, following the 1970s' cliometric revolution in the United States, historians have used the rich resource of Cape slave records to estimate productivity and profitability and to discover the determinants of prices.Footnote 15 These studies, while noting the existence of the Khoesan, exclude them in their quantitative analyses. We argue that the neglect of the Khoesan population in earlier accounts of the Cape economy has produced a distorted account of colonial life that tends to be self-reinforcing. Just because they are missing from tax censuses, inventories, and other colonial documentation does not mean that the Khoesan did not matter for the Cape economy in general and the growth of settler farming in particular.
Scattered anecdotal evidence indicates that the Khoesan played an important role as labourers on settler farms throughout the eighteenth century. The question is how to account for their role in the Cape economy when no quantifiable sources are available. To answer this, we constructed an annual population estimate of the Khoesan and estimated their farm labour by combining anecdotal traveller accounts with household-level tax records. Including these new figures not only reinterprets Cape economic life, it demonstrates how important it is to account for missing people in studies using colonial archival records. We do not claim to have created a definitive data series for the Khoesan. However, we can show that even under very conservative assumptions, the inclusion of the Khoesan prompts a reassessment of the size and development of the Cape colonial economy. Our analysis focuses on three variables in particular: slave productivity, around which a large literature emerged in the 1980s; societal inequality; and economic growth, measured as gross domestic product (GDP) per capita. All three measures, and the interpretations that result from them, are affected once better Khoesan estimates are included.
HOW CAN WE FIND THE KHOESAN?
When Dutch East India Company employees first settled on the shores of Table Bay in the mid-seventeenth century, they encountered diverse groups of peoples who they identified as ‘Bushmen’ (San) and ‘Hottentots’ (the Khoe, also Khoi or Khoikhoi). The territory of the hunter-gatherer San was beginning to be occupied by the Khoe, a nomadic, pastoral people descended from migratory groups who arrived in the Western Cape around the year 1000 BCE. By the time Europeans arrived, the San were living mostly in the rugged areas and often in a servant relationship to the Khoe. Anthropological research makes it clear that the two groups are not discrete ethnic categories.Footnote 16 The Dutch did not distinguish between them by physical appearance but rather according to their socioeconomic systems: those who owned cattle were classified as Khoe, those who did not were classified as San. This occupational distinction is also problematic, as historians have recognized.Footnote 17 Here, we refer to the indigenous people as ‘Khoesan’, while acknowledging that this was not a homogeneous group.
Colonial expansion was not the reason the Dutch came to the Cape: the orders of the Lords XVII in Amsterdam, the shareholders of the Dutch East India Company (Vereenigde Oost-Indische Compagnie, hereafter VOC or the Company), were to found a small refreshment station to supply its ships on the way to the East and back with fresh produce, fuel, and water. But soon after arrival the commander of the station, Jan van Riebeeck, realized that supplies from trade with the Khoesan would not be adequate to satisfy the demand from the passing ships. In 1657, he authorized the release of nine company workers to become free burghers and begin farming close to the fort that had been constructed between Table Mountain and the shore. Progress was initially slow: the sandy soil of the region, combined with the strong south-easterly winds and the constant threat of conflict with the Khoesan, made life difficult for the early farmers. Van Riebeeck had hoped for intensive cultivation of wheat and vegetables, but the farmers opted for extensive pastoral farms. It was only when Commander Simon van der Stel extended the area under European control to the fertile regions immediately west of the first mountain ranges that wheat cultivation, and viticulture, began to be lucrative.Footnote 18
Aside from the difficulties of soil, weather, and skirmishes, the settler farmers lacked capital, in the form of seeds and implements, and labour. The Company decided to provide both: it made generous loans to farmers at 6 per cent interest (and farmers could also rely on the tight social networks that had developed from early on). Providing labour was more difficult. Company servants, or knechts, were available, but their wages were daunting for the farmers, given that all output had to be sold to the Company at low, predetermined prices. So, in the early eighteenth century, following the advice of the Council of Policy in Cape Town, the Company decided to import slave labour. These slaves, of whom more than 60,000 were imported from the Company's Indian Ocean networks in India, Madagascar, Mozambique, and the Indonesian archipelago over the course of the eighteenth and early nineteenth centuries, constituted the most important source of labour on farms until emancipation in 1838.Footnote 19 To rely on indigenous labour was never seriously considered, for two reasons: the low numbers of Khoesan living in the area and the Company's unwillingness to increase the supply of indigenous labour by using coercive methods, for fear of retaliation.Footnote 20 Scholars have thus concluded that the growth of settler farming in the Cape Colony was a function of imported slaves and that the role of the Khoesan in farm labour was negligible and declining.Footnote 21 Nigel Worden, for example, argues that the processes of primitive accumulation caused the supply of indigenous labour to decrease because these processes led to demographic collapse, which was worsened by the 1713 smallpox outbreak that Worden claims killed almost 90 per cent of the Khoesan population.Footnote 22
Not everyone, however, agrees. Nigel Penn suggests that the processes of primitive accumulation and expanding settler colonization caused an increase in the supply of indigenous labour.Footnote 23 A number of historical sources suggest that the Khoesan did indeed play an important role as labourers on the settler farms and that this involvement even increased over the period. Leonard Guelke and Robert Shell note that in 1688, the Khoesan were so much in evidence that Van der Stel compared them to the influx of migrant workers from Westphalia into the Netherlands.Footnote 24 In 1695, Johannes Willem de Grevenbock referred to Khoesan labour with enthusiasm:
They train oxen for use in ploughing … and are found exceedingly quick at inspanning or outspanning or guiding teams. Some of them are very accomplished riders, and have learned to break horses and master them …. They make trusty bearers, porters, carriers, postboys and couriers. They chop wood, mind the fire, work in the kitchen, prune vines, gather grapes, or work the wine press industriously …. Without relaxation they plough, sow, and harrow.Footnote 25
These observations were made before slavery took off at the Cape, as it would in the next century. Yet Khoesan labour continued to play an important role throughout the eighteenth century. In 1706, it was reported that the Khoesan moved in gangs from farm to farm in search of temporary wage employment.Footnote 26 Farmers regularly complained that the VOC's employment of huge numbers of Khoesan caused labour shortages on their farms. Wheat farmers on large landholdings were complaining as early as 1744 that they were being forced to limit the size of their crops because of shortages of Khoesan labour.Footnote 27
Cape historians acknowledge that the Khoesan worked on the pastoral farms in the interior, where they outnumbered slaves.Footnote 28 Court records, however, show that the Khoesan were often permanently attached to the arable farms in the southwestern part of the colony, notably in Stellenbosch and Drakenstein, two districts where the use of slaves is known to have been widespread. The Khoesan must have lived and worked alongside the slaves.Footnote 29 This suggests that there is little evidence to warrant the exclusion of Khoesan from earlier quantitative estimates.
A WAY TO COUNT THE KHOESAN
Although historians have sought to reconstruct Khoesan history,Footnote 30 we lack a systematic series of their population size, as none of the colonial records that have been digitized and transcribed provides annual estimates of Khoesan populations for the eighteenth century. Similarly, records of individuals, households, and farms, such as tax censuses, probate inventories, and estate accounts, are void of any reference to the Khoesan – evidence that the group was largely ignored in any quantitative analysis of the Dutch period.
How many Khoesan were actually living in the Cape? Only two rough estimates exist. One comes from Richard Elphick's groundbreaking work on the Khoesan people.Footnote 31 Elphick argues that when the VOC arrived, about 50,000 Khoesan people were living in an area of roughly 130,000 km2, which gives a population density of 0.38 people per square kilometre.Footnote 32 The other figure is provided by Leonard Guelke, who argues that about 20,000 Khoe and 3,000 San were still living at the Cape by 1780, constituting about half of the total population of the Cape.Footnote 33 These two estimates suggest that the geographical expansion of the settlers in Cape was followed by continuous out-migration of the Khoesan from the Western Cape.
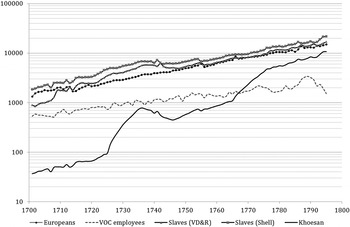
Recent progress in assessing the size of the Khoesan population offers a contrasting view. Johan Fourie (one of the co-authors of this article) and Jan Luiten van Zanden constructed a GDP series for the Cape Colony based on the consumption patterns of four population groups: settlers, VOC employees, slaves, and the Khoesan.Footnote 34 They used a novel technique to estimate the size of the Khoesan population: the number of Khoesan in the colony, they posit, is proportional to the number of Khoesan who appeared before the Court of Justice in Cape Town. By counting the number of Khoesan in the Court of Justice records, published by Hans Heese, they were able to estimate the size of the Khoesan population that was within the ambit of colonial society.Footnote 35Figure 1 shows estimates for the four population groups, with two series for slaves from different sources. The only existing series of Khoesan population estimates is included: until the early eighteenth century, Khoesan numbers are much lower than those of the other three population groups though their growth rate is much the same. By the mid-1720s, however, Khoesan population growth increases considerably, declines slightly between 1740 and 1750, and then continues to increase to reach more than 10,000 in 1795.
Size and growth of four population groups at the Cape, 1701–95. Source: The y-axis is in logarithmic scale. The estimates for Europeans (settlers and knechts), VOC employees, and slaves are from P. van Duin and R. Ross, The Economy of the Cape Colony in the Eighteenth Century (Leiden, 1987). The second slave estimate is from Shell, Children of Bondage. The estimates for the Khoe population (that was part of the Cape economy) are from Fourie and van Zanden, ‘GDP in the Dutch Cape Colony’.

Although these estimates for the Khoesan population are a big improvement on what was available before, they are not perfect. The effects of the smallpox epidemics, for example, are not reflected in the series. We believe that, rather than being a proxy for the size of the Khoesan population, these estimates grasp the involvement of the Khoesan in the colonial economy. The numbers reveal a large presence of Khoesan in the Cape economy and, especially towards the end of the eighteenth century show that their role as farm labourers in fact increased over time. Let us now relate these findings to our own estimates.
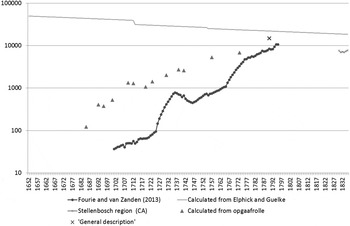
As a measure of the size of the Khoesan population living beyond settler influence, we had only Guelke's and Elphick's rough estimates. We therefore constructed a simple series, beginning with a figure of 50,000 Khoesan in 1652 that declines through linear interpolation to 23,000 in 1780. Following Robert Ross, we allowed for a 20 per cent decline in Khoesan numbers in 1713 during the first smallpox epidemic and another 5 per cent in 1755, a second but smaller epidemic.Footnote 36 Accounting for the smallpox epidemics suggested a negative growth rate of 0.4 per cent per annum. We used this growth rate to extend the population estimate linearly after 1780, as shown in Figure 2.
Four estimates of the Khoesan population, 1652–1835. Note: ‘General description’ refers to Een generale beschrijving, 1790.

This series provides a baseline estimate but is largely unsatisfactory because of the few points of observation available and the strong assumption of linear interpolation. The first main contribution of our study, then, is the second series we constructed, to estimate the number of Khoesan employed as farm labourers. To do so we used the opgaafrolle, the tax records collected annually by the Company. These records for settler households provide detailed evidence of the number of cattle, horses, sheep, vines, weapons, and slaves owned, the number of knechts (European wage labourers) employed, and the amount of wheat, barley, rye, and wine produced.Footnote 37 Along with the opgaafrolle, we used anecdotal evidence to inform the assumptions that guided our estimate.
To calculate the number of Khoesan on each farm, we needed to make strong assumptions about the number of Khoesan labourers per unit of cattle. We based these assumptions on traveller anecdotes. For example, Carl Peter Thunberg, travelling in the Cape Colony interior in 1771, notes that Jacobus Bota (sic), a farmer who lived near the Pisang River, employed an entire Khoesan clan of about fifty people.Footnote 38 On searching for this farmer in the opgaafrolle, we were lucky enough to find several Bothas (the usual spelling of this surname) living in the Swellendam district. We assumed that the farmer to whom Thunberg referred would be the wealthiest one. And indeed, Jacobus Botha (senior), a farmer in the Swellendam district, is recorded in the opgaafrol of 1773 as married, having no children (under the age of 16) living in the household, and owning 20 male slaves, 3 female slaves, 19 horses, 250 head of cattle, and 900 sheep. There is no evidence of cultivation. It seems that ‘Bota’ was a rancher, using not only slaves, as recorded by the opgaafrol, but almost certainly also Khoesan labourers, probably as herders. Combining the two sources enabled us to calculate the ratio of Khoesan employed to cattle owned, to extrapolate the ratio to the other farmers, and then estimate the number of Khoesan who may have been employed in the colony.
To do this we assumed that only farmers employed Khoesan, and that they employed them only for herding purposes. We therefore ignored all households that did not produce any of the commodities included in the opgaafrolle and constructed a new variable which depended only on the value of the cattle, sheep, and horses owned. We acknowledge that this is a strong assumption, as Khoesan were almost certainly also employed in viticulture and wheat farming, but it was necessary if we were to construct as conservative an estimate of the Khoesan population as possible. Our assumption may be considered fundamentally sound, however, if we take into account the fact that Khoesan were predominantly used as herders. As Ben Liebenberg noted in 1941, ‘while the Hottentots were less important than slave labour, they provided valuable services to cattle farmers in the frontier regions'.Footnote 39
Building on the Botha example, therefore, we assumed that one Khoesan was employed for every 67.5 rix dollars of herd value (Botha owned Rds 3,375 worth of cattle, sheep, and horses) for households owning more than five slaves and living in the Swellendam district. It is likely that Khoesan labour substituted for slave labour in this district, so we decreased this ratio by Rds 10 for households owning between one and five slaves, and by another Rds 10 for households owning no slaves. For households in the districts of Stellenbosch and Drakenstein, we assumed double these rates, that is, Rds 135 of herd value per Khoesan for households with more than five slaves, Rds 115 for households with between one and five slaves, and Rds 95 for households with no slaves. Here we relied on Adam Tas's diary.Footnote 40 In 1709, Tas owned Rds 2,041 of herd value (and 20,000 vines and twenty slaves). Dividing the herd value by the 11 Khoesan he employed four years earlier, we arrived at a rough estimate of Rds 185 per Khoesan, slightly higher than the Rds 135 per Khoesan we had assumed. In 1702, three years before the diary statement quoted above, Tas owned no cattle, horses, or sheep and had planted no vines.
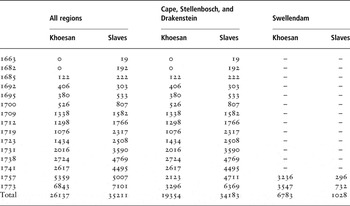
For households in the Cape district, the region bordering Cape Town, we assumed that no Khoesan were employed. Table 1 provides our first approximation of the number of Khoesan labourers using our method. It shows that the number increased from 122 in 1685 to 6,843 by 1773, a growth rate of 3.8 per cent per annum, equivalent to that of slaves over the same period. The regional distribution also shows that, as we expected, Khoesan labour was concentrated in the Swellendam district where pastoral farming was most popular.
Number of Khoesan by region. Note: As explained in the text, Swellendam was only proclaimed as a separate district in 1754.

Are these numbers realistic? We have several reasons for thinking they are. Firstly, they support the anecdotal evidence cited above. Improving on our earlier estimates, we find, for example, evidence of a decline in the Khoesan population after the severe smallpox epidemic of 1713 and, in the Cape, Stellenbosch, and Drakenstein regions, during and after the 1755 epidemic. Other scattered empirical evidence also seems to support these numbers. Russel Viljoen notes that in 1806, ‘nine Khoesan labourers were employed for every slave in the interior part of the country’.Footnote 41 This ratio is higher than the Khoesan-to-slave ratio we calculate for the Swellendam region (6,783 Khoesan to 738 male slaves, a ratio of 6.6:1). Our estimate for the Khoesan population therefore seems to be on the conservative side.
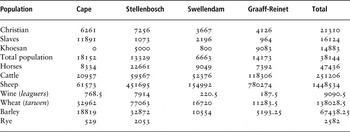
Secondly, we also found estimates of population and production of 1790 in an account of the Cape of Good Hope, a ‘general description’ published at the end of the eighteenth century.Footnote 42 These estimates are shown in Table 2. The account gives the number of Khoesan living in the Cape district as zero, which fits our assumption. The total for the Stellenbosch district is a rough estimate of 5,000, which is above our (conservative) estimate of 3,296 in 1773. The numbers for Swellendam are much lower, though. This can be explained if we include a large territory to the east of Swellendam, around the town of Graaff-Reinet, founded in 1786. The Graaff-Reinet figures support Viljoen's suggestion that nine Khoesan were employed for every slave. Once the figures for Swellendam are added to these, the ratio falls to 3.1 Khoesan for every slave. Our assumptions, therefore, fit the ‘general description's’ evidence quite well, although they are still somewhat conservative.
Estimates of population and production published in the ‘General description’, 1790.

A third source to support our claim that our numbers are realistic is the 1806 census. The first census to include Khoesan labourers, it reveals that they accounted for about 30 per cent of the total labour force in the Stellenbosch and Drakenstein districts, which is slightly higher than our own estimates. Worden argues that this might indicate a higher percentage use of Khoesan labourers than was normal for the eighteenth century because of increased shortages of slaves at the beginning of the nineteenth century, a result of the ban on slave trading in 1807. On the other hand, it is possible that, as part of a strategy to avoid taxes, farmers under-reported the number of day labourers they employed.Footnote 43
To further strengthen our estimates we collected opgaafrolle on Khoesan labour in the Stellenbosch district for the 1830s, the period of emancipation.Footnote 44 We expected this would give us the most conservative estimate of Khoesan numbers, as there was an incentive to report slaves because of the payments associated with emancipation. For this estimate we looked only at the Stellenbosch district,Footnote 45 as most farmers here had large landholdings and large numbers of slaves and presumably relied mainly on slave labour (an assumption also supported by anecdotal evidence). Between 1830 and 1840, the Khoesan still represented 10 to 23 per cent of the total labour force. They seem to have been an important source of labour even in those districts where slaves were in high demand. This scattered evidence, together with our reconstructed Khoesan figures, is plotted in Figure 2. Note that our estimate of the Khoesan population in 1773 is lower than the estimate provided by the ‘general description’ in 1795. Had we interpolated our estimates for the tax census years linearly, we would have obtained a figure that is not statistically different from the 1795 estimate. Even if we compare our 1773 estimate to the Khoesan numbers in the slave-holding Stellenbosch district during the 1830s – a region where the Khoesan were the least likely to be employed on farms, and slaves were possibly over-reported for emancipation payments – our estimates are biased towards the conservative.
WHY THE KHOESAN MATTER
Our revised estimates for Khoesan population levels have implications for the way we interpret Cape colonial economic history. One of the suppositions they question is that settler expansion was followed by an out-migration of the Khoesan. Our estimates suggest the reverse: that settler expansion left the Khoesan with little choice but to abandon the pastoral lifestyle and become farm labourers. Furthermore, as Erik Green (one of the co-authors of this article) has recently suggested, the use of slaves and Khoesan increased simultaneously, indicating that these two sources of labour complemented rather than substituted for each other.Footnote 46 Our estimates call for a revised account of settler farming expansion at the Cape: its nature and consequences, how production was organized, and how this organization changed over time. In this article, however, our concern is more modest. We want to see what happens to previous attempts to quantify the Cape economy when we include Khoesan farm labourers in the calculations. In the following we show that including our revised Khoesan estimates leads to a new interpretation of three economic variables that have received considerable attention in the literature: slave productivity, social inequality, and economic growth.
Historical accounts of slave productivity at the Cape are rare and, more importantly, their estimates are surprisingly high. W. S. van Ryneveld estimated in the late eighteenth century that thirty slaves were needed to produce a combined total of 800 mudden of corn and 400 mudden of wheat, an average of 40 mudden per slave.Footnote 47 John Barrow, on the other hand, claimed that a farmer needed only six slaves to produce 300 mudden of wheat, an average of 50 mudden per slave.Footnote 48 The only attempt at a formal calculation of the productivity of slave labour that we are aware of is in Worden's classic work Slavery in Dutch South Africa. Worden rightly argues that it seems unlikely, at face value, that the profitability of Cape slave labour was high in comparison with better-known slave societies such as the Roman latifundia and the New World plantation complexes. The slave population at the Cape was not large enough to reproduce itself and the farms were on average quite small, with a fairly small labour demand per unit of land. Moreover, the slave supply system was erratic, and although the internal slave market developed in the eighteenth century, slaves were not systematically encouraged to reproduce in one region for sale to an expanding rural economy in another. Yet Worden's analysis reveals profits comparable to those calculated for the British Caribbean or the southern United States.Footnote 49 The question is whether his findings are wholly accurate.
Worden uses the tax records to calculate the output per slave for two commodities, wheat and wine.Footnote 50 He first considers only monocultural farms, but then expands his analysis to include mixed farms, noting that their yields were much the same as those of monoculturalists.Footnote 51 His estimates based on the Cape census of 1741 show that farmers who produced only wheat, and kept a small quantity of livestock mainly to support wheat cultivation, needed on average one slave to produce twenty mudden.Footnote 52 Worden discusses two major problems with measuring the productivity of slave labour at the Cape: the census returns do not record the use of hired indigenous labour, and the absence of monoculture and wide range of prices for each crop or livestock type in any one year mean that values vary for the units of slave productivity.Footnote 53
We attempt to overcome these difficulties by using an expanded version of Worden's source data: he refers only to the tax censuses of 1741 and 1773 while we were able to measure slave productivity using those of 1719, 1723, 1731, 1738, 1741, 1757, and 1773. But first we tried to replicate his results. Worden calculates slave productivity by simply dividing the output (Y) by the number of slaves owned (L) for three monoculture types: wheat, wine, and stock farming. While there are obviously more advanced econometric techniques to calculate productivity available nowadays, our purpose here is to compare the original estimates (on which the historical account is based) with new estimates that include the Khoesan population. We therefore simply add the number of Khoesan to the number of slaves employed for each farm to get a new estimate of the labour used on farms (L* = slaves + Khoesan).
According to Worden, farmers in the Cape district producing only grain – who had livestock at ‘a level to support grain farming’ and who had, presumably, planted no vines – held one adult male slave for every 24 mudden produced.Footnote 54 Unfortunately, Worden does not define the necessary level of livestock. We therefore ran several checks, at a herd value of Rds 100 (roughly four head of cattle and three horses) and increments thereof. None of these checks provided us with an estimate to match Worden's. The closest we found was at a herd value of Rds 400, where one adult male slave adds 22.3 mudden. At this level of herd value, and excluding all farmers who had either no slaves or no viticulture, our sample was reduced to only four farmers who fitted the criteria, which is perhaps the reason for the high level of output per slave that Worden calculated. When we expanded the definition to include more livestock (at a herd value of Rds 1,000), we found 17 farmers producing 16.0 mudden for every male adult slave, which is perhaps a more accurate reflection of the productivity of slaves during this period.
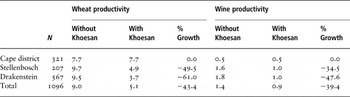
We then expanded this analysis to cover all seven tax census years, and three districts (Swellendam, the fourth district, falls away because the censuses do not record any wine or wheat being produced there). The third column of Table 3 shows the results. As a second step, we recalculated the output per slave if we include Khoesan as part of the labour force (see the fourth column of Table 3). Slave productivity numbers for the Cape district stay the same, because we assumed that the Khoesan were not active there. However, when we include our estimates for Khoesan in the Stellenbosch and Drakenstein districts, the output per slave declines significantly. In Stellenbosch, productivity falls from 18.4 mudden per slave to only 8.1; in Drakenstein, the percentage decline is even larger, from 15.1 mudden per slave to 5.6.
Comparing slave productivity with and without the missing Khoesan, wheat farmers. Source: Own calculations from opgaafrolle. Notes: Slave productivity measured as mudden per adult male slave. N is the number of observations. Censuses of 1719, 1723, 1931, 1738, 1741, 1757, and 1773. This table includes only farmers with a maximum herd value of Rds 1,000 and with no evidence of viticulture.

But is this scenario unique to wheat farmers? We know that wine farmers were the predominant users of slave labour and we could therefore expect to find a smaller effect in the wine industry, or even no effect. Again we began with Worden's estimates. Using the 1773 census, Worden calculated that farmers in the Stellenbosch district produced 1.9 leaguers of wine per slave.Footnote 55 In the Cape district this number was 0.8. Redoing Worden's calculations for 1773, we find a considerably higher number: 4.8 leaguers per male slave for the Stellenbosch district. This is much closer to the 5.3 leaguers per slave calculated by Barrow.Footnote 56 When we expand the calculations to again include the seven censuses, we find productivity levels are slightly lower, although still considerably higher than Worden's. Table 4 again splits the results by district.
Comparing slave productivity with and without the missing Khoesan, wine farmers. Source: Own calculations from opgaafrolle. Notes: Slave productivity measured as leaguers per adult male slave. N is the number of observations. Censuses of 1719, 1723, 1931, 1738, 1741, 1757, and 1773. This table includes only farmers with a maximum herd value of Rds 1,000 and with no evidence of wheat farming.

Here, too, we calculated slave productivity with and without the contribution of Khoesan labour. Predictably, the results in the Cape district remain the same, and also similar to the productivity level calculated by Worden for 1773. But productivity levels in Stellenbosch and Drakenstein fall significantly once we include Khoesan labour. Note that nowhere did we calculate the number of Khoesan per farmer on the basis of the farmer's arable assets; conservatively, we only considered herd value when estimating the labour participation of the Khoesan population. Yet the productivity of slave labour in both the wheat and wine growing sectors falls significantly once we take our new Khoesan figures into account.
Finally, mixed wheat and wine production was common on Cape farms. We therefore broadened the scope of our analysis to calculate productivity rates for all arable farmers (see Table 5). Again the results reveal large differences in productivity, even if we estimate the number of Khoesan labourers only on the basis of the farmer's herd size. Instead of 9.7 and 9.5 mudden per slave on Stellenbosch and Drakenstein farms, we find that wheat productivity falls to 4.9 and 3.7 mudden per slave, much lower than before. Wine output per slave falls too, although to a lesser extent than wheat.
Comparing slave productivity with and without the missing Khoesan, arable farmers. Source: Own calculations from opgaafrolle. Notes: Slave productivity measured as mudden per adult male slave or leaguers per adult male slave. N is the number of observations. Censuses of 1719, 1723, 1931, 1738, 1741, 1757, and 1773.

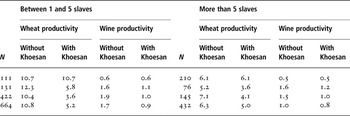
Such changes in our estimates of the productivity of slaves have important consequences. Worden notes, for example that ‘slave production seems to have been most profitable when the scale of the production unit was large’.Footnote 57 We find little corroborating evidence for this claim. Table 6 shows the same calculations as Table 5, but now split between farmers owning between one and five slaves, and those owning more than five slaves. It is clear that across all measures – but especially where Khoesan are not included – the average slave productivity is higher on smaller farms than on larger ones. More importantly, this gap narrows once Khoesan are added to the equation. The wheat output per slave across all districts falls from 10.8 to 6.3 in the absence of Khoesan, for example, but only from 5.2 to 5.0 when Khoesan are included. Similarly, wine productivity falls from 1.7 to 1.0 when Khoesan are excluded, but only from 0.9 to 0.8 when they are included. This suggests that, as Worden suspected, the poorer farmers did indeed employ more Khoesan labourers than the wealthier ones. It also supports the notion that wealthier farmers probably found alternative uses for their slaves, such as leasing them to poorer farmers (to increase their return on investment, but this of course is not included in our data), or using them in proto-industries on farms, resulting in economies of scope.Footnote 58
Comparing slave productivity with and without the missing Khoesan, all arable farmers split by number of slaves owned. Source: Own calculations from opgaafrolle. Notes: Slave productivity measured as mudden per adult male slave or leaguers per adult male slave. N is the number of observations. Censuses of 1719, 1723, 1931, 1738, 1741, 1757, and 1773.

One clear implication of our new calculations is this: if we consider simply the agricultural output of slaves together with the presence of a large Khoesan labour force, it seems that slavery was not as productive an enterprise as earlier historians have claimed. Ironically, this opinion was shared by travellers at the Cape in the eighteenth and early nineteenth centuries. Barrow, for example, noted in 1806 that:
There is not, perhaps, any part of the world, out of Europe, where the introduction of slavery was less necessary than the Cape of Good Hope …. To encourage the native Hottentot in useful labour, by giving them an interest in the produce of that labour, to make them experience the comforts of civilized life, and to feel they have a place and value in society … would be the sure means of diminishing and, in time, of entirely removing the necessity of slavery.Footnote 59
In calculating slave productivity we have tried to keep as close as possible to the methodology employed by Worden in the 1980s. Had Worden included an estimate of Khoesan labour (if it had been available in the opgaafrolle, for example), his conclusions would have been very different; in fact, he would have found corroborating evidence to support the anecdotal accounts of the early travellers.
A topic that has received even more attention than slave productivity is the inequality of Cape society. These studies generally conclude that farmers were a heterogeneous group and that increasing commercialization further increased inequality during the eighteenth century.Footnote 60 More recently, two studies by Fourie and Dieter von Fintel have investigated changes in the distribution of wealth and income during the eighteenth century.Footnote 61 They find high and persistent levels of inequality for the settler community, supporting the anecdotal accounts of Otto Mentzel in his travels during the 1730s and the simple calculations of earlier historians.Footnote 62 Notably, they conclude that within-group inequality, particularly in the farmer population, was higher than between-group inequality, which included VOC employees and slaves.Footnote 63 This, they argue, suggests that social tables, which divide society into different classes to measure inequality and are often used in the absence of micro-level evidence, may underestimate the extent of inequality in a society.
While their reasoning that significant within-group inequality may invalidate the use of social tables is sound, their claim that within-group inequality was more important than between-group inequality at the Cape now needs revising, as they failed to account for one group of Cape Colony inhabitants – the Khoesan. They explained that their inability to reconcile Dutch records with rough estimates of the size of the Khoesan population, and the lack of reliable micro-level information on Khoe and San lifestyles, gave them ‘little alternative but to focus on the population under European influence at the Cape’ (emphasis in the original), and where Khoesan were recorded as slaves in their sample, to include them as part of Cape society; where they were not, the authors had no way of estimating their income vis-à-vis other members of Cape society.Footnote 64 Presumably between-group inequality will be significantly higher if we include the Khoesan at the bottom of the income distribution.
Using the same method and the same empirical data that were used in those two studies,Footnote 65 we reconstructed Gini and Theil income inequality coefficients with our new estimate of Khoesan population included (see Table 7). We made no changes to the size and incomes of the settler or slave populations. Because we have very little information about the Khoesan labourers' incomes, we assume they were similar to the slaves' ‘incomes’, that is, that the per capita expenditure by farmers on slaves and Khoesan were similar.Footnote 66 Our findings are perhaps counterintuitive: including the Khoesan reduces the Gini coefficient from 0.74 to 0.50 in 1757, meaning that Cape society becomes more, not less, equal. The reason for this decrease is that with no variation in the income distribution of the Khoesan – not an entirely unreasonable assumption – the variation in the total income distribution would decrease, even though incomes falling below the poverty line would increase.
Inequality coefficients. Source: Own calculations; original estimates from J. Fourie and D. von Fintel, ‘A history with evidence’ (see fn. 61).

The Theil index is another statistic that measures inequality, with the advantage that it allows a breakdown of inequality into two components: between groups and within groups. Table 7 shows the earlier estimates, juxtaposed with our new estimates when the Khoesan are included. Unsurprisingly, including the Khoesan increases between-group inequality, although not by much. The fact that we assume that all Khoesan incomes are the same (that is, no variation in the Khoesan sample) does have a sizeable effect on within-group inequality, though, which decreases significantly from 0.67 to 0.39, almost equalling the level of between-group inequality. These shifts could have important consequences for interpreting the South African past. Earlier estimates suggested that inequality was severe and persistent, but that this inequality was predominantly within the settler group. Yet when the Khoesan are added as income earners, the bottom of the income distribution swells as more poor people are included, reducing overall inequality but shifting the type of inequality from within-group to between-group.
The new figures also enable us to reinterpret colonial economic growth. The first to undertake a macroeconomic assessment of the Cape economic performance were Pieter Van Duin and Robert Ross, who provided evidence of an expanding economy.Footnote 67 Using wages paid to European labour at the Cape, Pim de Zwart and Sophia and Stan du Plessis also documented the rising living standards of Cape wage earners throughout the eighteenth century.Footnote 68 Elsewhere, Fourie used probate inventories to demonstrate remarkably high levels of settler wealth.Footnote 69 Yet none of these investigations included estimates for Khoesan production.
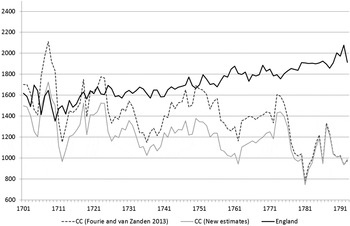
Fourie and van Zanden's GDP per capita calculation was the first to include an estimate of the Khoesan population.Footnote 70 They, too, found high levels of income, on par with England for most of the first half of the eighteenth century. By including a revised estimate of the Khoesan population, we can confirm or refute their earlier conclusions. Figure 3 compares their original estimates with our new estimates of GDP per capita using our revised Khoesan population estimates. To keep our estimates as close as possible to the original study, we added the Khoesan population only to the denominator (population size) and made no adjustments to the numerator (output). Our new GDP per capita estimates suggest that only in the very early eighteenth century did Cape GDP per capita estimates rival those of eighteenth-century Britain.Footnote 71 In fact, after 1710, our Cape Colony GDP per capita figures never again equal those of Britain, whereas the earlier figures show Cape GDP equalling Britain's until 1750. Also, if we extend the Khoesan series (assuming a constant, linear growth rate from 1758 onwards), this somewhat mitigates the precipitous fall in GDP per capita found in the earlier work. Our new GDP estimates still make it clear that the Cape achieved, on average, fairly high levels of prosperity, especially for the settler population.Footnote 72 Yet once we include the slave population and, as we show here, a more accurate figure for the Khoesan population, the prosperity of the average Cape inhabitant becomes less remarkable.
Comparison of GDP per capita estimates, 1701–73. Source: Fourie and van Zanden, ‘GDP in the Dutch Cape Colony’; own calculations.

CONCLUSION
The phenomenon of missing people, especially hunter-gatherers and nomadic pastoralists, is not unique to Cape historical and economic accounts. There has been a particular resurgence of interest among African economic history scholars in finding, digitizing, and transcribing evidence of the economic and social life of individuals and households. Many of the new studies rely on colonial or missionary documentation, which often neglects, deliberately or accidentally, large segments of society. Economic historians to date have either ignored this problem or narrowed their inferences to apply to the sample only. As we have observed above, these strategies are methodologically and morally problematic.
In this article, we have shown that excluding people who do not directly appear in historical records has implications for our understanding of social and economic change in developing regions. With the Cape Colony as the case in point, we showed, using evidence from annual Cape tax censuses and other historical sources such as contemporary traveller accounts, that previous estimates of Cape slave productivity were upwardly biased, that between-group inequality was underestimated, and that earlier attempts to explain economic growth in the Cape painted somewhat too rosy a picture. Ours is by no means the final estimate of the size and impact of the Khoesan population at the Cape: as more quantitative records are unearthed and digitized, a more accurate picture will emerge. But what our contribution makes clear is the possibility of, and indeed necessity for, a more accurate portrayal of indigenous population groups when quantifying colonial activity. In short, we have shown how we can quantify the missing people, and why their inclusion matters.