1. Introduction
In computational linguistics, native language identification (NLI) is the task of identifying the native language (L1) of persons based on their writings in the second language (L2). NLI is based on the assumption that characteristics of a person’s native language interfere in the production of texts in a different language, to the extent that L1 is identifiable. Often, as for security applications, identifying the L1s is the main focus—finding the set of features and the learning paradigm that lead to the best L1 predictions. Other applications, such as marketing and educational materials tuned to different L1s, would benefit from information about what L1 phenomena got transferred to L2 (native language interference, Odlin Reference Odlin1989).
Word and character n-grams are considered the best-performing features for NLI (see Section 2). They cover indiscriminately a multitude of linguistic particularities. Using such document representations does not provide any insight into the linguistic phenomena that a speaker subconsciously transfers from his/her native language to the new language.
The focus of this article is an investigation of several language characteristics that we hypothesize plays a part in native language interference: (i) the structuring of information in written language through the use of punctuation; (ii) emotionally charged words usage; and (iii) incorrect expansion of L2’s vocabulary using L1 material through anglicized words, cognates, and other misspellings. The analysis confirms our hypotheses and leads to several strong conclusions: (i) the structuring of written language through punctuation is a strong bias, which leaves L1 traces even for speakers at high proficiency levels, across different corpora and topics; (ii) the usage of emotionally charged words is culture dependent and has a strong signature in L2 production including at high proficiency levels, and across different corpora and topics. Other kind of interference such as anglicized words, cognates, and spelling errors (SEs) in L2 has a positive impact on identifying the L1 of the speaker.
Section 2 presents an overview of work on NLI. Section 3 describes the datasets, features, and experimental setup used in this work. Sections 4 and 5 describe the experiments, their results and analysis, and Section 6 draws the conclusions.
2. Related work
NLI is focused on identifying the native language of a speaker based on the language material they produce in a different language and is commonly approached as a multi-class classification problem: for a given text sample, predict the native language (L1) of the writer from a (small) set of options (Tetreault, Blanchard, and Cahill Reference Tetreault, Blanchard and Cahill2013). Word and character n-grams were proved to be the best features. Jarvis, Bestgen, and Pepper (Reference Jarvis, Bestgen and Pepper2013) achieved the highest classification accuracy (83.6%) in the first NLI Shared Task 2013 (Tetreault et al. Reference Tetreault, Blanchard and Cahill2013) using lexical and part-of-speech (POS) n-gram features on the 11-way TOEFL11 dataset (Blanchard et al. Reference Blanchard, Tetreault, Higgins, Cahill and Chodorow2013) composed of English essays. The authors report that a model based on character n-gram features produced nearly the same high level of NLI accuracy. This observation was confirmed by Markov et al. (Reference Markov, Chen, Strapparava and Sidorov2017), one of the best-performing systems in the recent NLI shared task 2017 (Malmasi et al. Reference Malmasi, Evanini, Cahill, Tetreault, Pugh, Hamill, Napolitano and Qian2017). Several other studies, for example, Ionescu, Popescu, and Cahill (Reference Ionescu, Popescu and Cahill2014), Ionescu and Popescu (Reference Ionescu and Popescu2017), achieved state-of-the-art results using character n-gram models with high values of n (up to n = 9). The state-of-the-art results for this task are usually in the 80%–90% accuracy range, depending on the number of languages being considered, amount of data, etc.
On social media data, Kumar et al. (Reference Kumar, Ganesh, Singh, Soman and Rosso2017, Reference Kumar, Ganesh, Ajay and Soman2018) summarized two shared tasks on Indian NLI, both on identifying six Indian languages from Facebook English comments. The highest results in 2017 (48.8% accuracy) were achieved using character and word n-gram features, while in 2018 the best score (37.0% accuracy) was achieved using the most discriminative words for each of the six languages. Volkova, Ranshous, and Phillips (Reference Volkova, Ranshous and Phillips2018) addressed 12-way NLI task of non-English speakers based on their English posts on Twitter. The best result was obtained using words and word 3-grams (72% F1-score for both words and word 3-grams). Goldin, Rabinovich, and Wintner (Reference Goldin, Rabinovich and Wintner2018) identified 23 European L1s of advanced non-native English speakers from Reddit posts. The best textual features (i.e., excluding social network features) were character 3-grams (62.06% accuracy) and words (31.26%).
Word and character n-grams cover a wide range of phenomena and facilitate identifying this L1, but they obscure which ones are actually “caused” by the speaker’s L1. Our goal in this study was to provide an in-depth analysis using features that explicitly model specific linguistic phenomena that potentially causes interference and quantify their contribution to the NLI task. We essentially investigate the results gap between a configuration that uses baseline (corpus-independent) features, and the state of the art, and try to see how this gap (and how much of it) is filled by the linguistic phenomena—use of punctuation, use of emotion-expressing words, L1-based expansion of L2-vocabulary—we identified.
Punctuation
In high-level natural language processing (NLP) tasks (e.g., information extraction, text categorization), punctuation is often disregarded or discarded. Punctuation is considered a stylistic choice and an important feature in stylometric analysis for authorship attribution, for example, Chaski (Reference Chaski2001), Grieve (Reference Grieve2007), Markov, Stamatatos, and Sidorov (Reference Markov, Stamatatos and Sidorov2018).
While punctuation has been included in some of the studies on NLI (e.g., in character-level models), its impact has not been studied. It is however an important, and often revealing, aspect of written language. From a linguistic point of view, punctuation has been disputed as following prosodic principles or as a clarifier of grammatical structure (Bruthiaux Reference Bruthiaux1993; Baron Reference Baron2001). Moore (Reference Moore2016) finds a common ground for these two views by observing that prosody and punctuation realize the same function—revealing/emphasizing the information structure of an utterance—in the spoken and respectively written modes of language. Since grammar and prosodic structure are language specific, indicators that reveal them would be language specific as well. As with other aspects of language, grammatical/prosodic influences from the native language may surface in the new language as particular punctuation choices.
Emotions
Communicating emotions in L2 is not easy, and it involves important aspects of socio-pragmatic competence. Caldwell-Harris (Reference Caldwell-Harris2014) shows that usage of emotionally charged words depends on the language. By focusing on differences between L1 and L2, she shows that there is a correlation between the usage of emotions and proficiency levels and the age a language is acquired.
Emotion-based features have been used in other NLP tasks, such as sentiment analysis (Sidorov et al. Reference Sidorov, Miranda-Jiménez, Viveros-Jiménez, Gelbukh, Castro-Sánchez, Velásquez, Díaz-Rangel, Suárez-Guerra, Treviño and Gordon2013), aggressiveness detection (Gómez-Adorno et al. Reference Gómez-Adorno, Bel-Enguix, Sierra, Sánchez and Quezada2018), and identification of deceptive texts (Newman et al. Reference Newman, Pennebaker, Berry and Richards2003). With respect to second language writing, they are underexplored. Torney, Vamplew, and Yearwood (Reference Torney, Vamplew and Yearwood2012) use psycholinguistic features extracted by the Linguistic Inquiry and Word Count (LIWC) tool (Pennebaker, Booth, and Francis Reference Pennebaker, Booth and Francis2007) to identify the first language of an author. Emotion-based features are included as part of the feature vector, for example, percentage of positive/negative emotion words. The LIWC feature set used in the paper also contains other types of features, for example, personal concern categories (work, leisure), paralinguistic dimensions (assents, fillers, nonfluencies), which obscure the contribution of the actual emotion features.
Rangel and Rosso (Reference Rangel and Rosso2013, Reference Rangel and Rosso2016) confirm the hypothesis that the use of emotions depends on the author’s age and gender using a graph-based approach, where each node is represented by the corresponding POS tag, and the representation is enriched with semantic information, emoticons, and with emotion information, which included polarity of words (polarity of common nouns, adjectives, adverbs, or verbs in a sentiment lexicon) and emotionally charged words (replacing common nouns, adjectives, adverbs, or verbs with the emotion information from the Spanish Emotion Lexicon, Sidorov et al. Reference Sidorov, Miranda-Jiménez, Viveros-Jiménez, Gelbukh, Castro-Sánchez, Velásquez, Díaz-Rangel, Suárez-Guerra, Treviño and Gordon2013).
We examine the hypothesis that there are commonalities in the use of emotions in L2 by different writers with the same L1s, suggested by linguistic and psycholinguistic studies (Wierzbicka Reference Wierzbicka1999; Leersnyder, Mesquita, and Kim Reference Leersnyder, Mesquita and Kim2011).
Cognates and anglicized words
True cognates (or true friends) are words in different languages that are translations and have a similar orthography, for example, Spanish conclusión and English conclusion. False cognates (or false friends) are words in different languages with similar orthography that are not translations, for example, Spanish embarazada (pregnant) and English embarrassed.Footnote a
Nicolai et al. (Reference Nicolai, Hauer, Salameh, Yao and Kondrak2013) tested two hypotheses: (i) cognate interference may cause an L1-speaker to use a cognate word instead of a correct English translation; (ii) an intended English word may be misspelled due to the influence of the L1 spelling. They detect cognates by identifying words that are closer to the misspelling than to the intended word. Despite being applied to only 4 out of 11 languages in the TOEFL11 dataset, cognate features led to 4% fewer errors.
Rabinovich, Tsvetkov, and Wintner (Reference Rabinovich, Tsvetkov and Wintner2018) showed that non-native speakers, when required to pick an English word that has a set of synonyms, are more likely to select a word that has a cognate in their L1. Based only on the frequencies of specific words in English, Rabinovich et al. were able to reconstruct a phylogenetic tree of the Indo-European language family.
L2-ed words (in our case anglicized) are similar to false cognates, but not in the sense of false friends: these are words in L1 that were “adjusted” to look and sound like legitimate L2 words: the incorrectly anglicized word facily instead of easily (Spa. fácilmente). This phenomenon is similar to code switching, which focuses on the mixing of languages within one text, for example, Solorio et al. (Reference Solorio, Blair, Maharjan, Bethard, Diab, Ghoneim, Hawwari, AlGhamdi, Hirschberg, Chang and Fung2014), where the change from one language to another occurs at the word level. The particularity of L2-ing is that the switching/mixing occurs within words, at the morpheme or character level.
Spelling errors
SEs in L2 are sometimes caused by erroneous sound-to-letter mapping. Koppel, Schler, and Zigdon (Reference Koppel, Schler and Zigdon2005) suggested that SEs are indicative features for NLI as writers might be affected by the spelling convention in their native languages. They explored eight types of SEs and collect the statistics of each error type as features.
Nicolai et al. (Reference Nicolai, Hauer, Salameh, Yao and Kondrak2013) extract SE features from character-level alignments between a misspelled word and the intended word. They report that the SE features contribute 0.4% accuracy when combined with other commonly used features on the TOEFL11 test set.
Chen, Strapparava, and Nastase (Reference Chen, Strapparava and Nastase2017) extract character n-gram features from misspelled words. They show that adding SE character n-grams to other commonly used NLI features (word, lemma, and character n-grams) improves NLI accuracy by 1.2% on the TOEFL11 test set.
Flanagan and Hirokawa (Reference Flanagan and Hirokawa2018) classified five L1s from the lang-8 dataset (Japanese, Chinese, Korean, Taiwanese, and Spanish) using 15 automatically identified types of writing errors, achieving higher results than when using unbiased words.
Goldin et al. (Reference Goldin, Rabinovich and Wintner2018) used the average Levenshtein distance between a misspelled word and the corrected version, as well as the insertions, deletions, and substitutions operations as features. The SE features were among the best feature types with 27.74% accuracy on a 23-way NLI task.
3. Methodology
To test the hypotheses that punctuation, emotion, and specific misspellings interfere with language production in a second language, we use two datasets of English essays written by non-native English speakers. These essays will be represented through various sets of features that are designed to capture the targeted linguistic phenomena and then used in multi-class classification experiments.
3.1 Datasets
We conducted experiments on two datasets commonly used in NLI research: TOEFL11 (Blanchard et al. Reference Blanchard, Tetreault, Higgins, Cahill and Chodorow2013) and ICLEv2 (Granger et al. Reference Granger, Dagneaux, Meunier and Paquot2009). Both datasets cover English L2 data and represent learner corpora.
3.1.1 TOEFL11 dataset
The ETS Corpus of Non-Native Written English (TOEFL11) (Blanchard et al. Reference Blanchard, Tetreault, Higgins, Cahill and Chodorow2013) was designed specifically to support the NLI task and has become a standard frame of reference for NLI research. TOEFL11 contains 1100 essays in English (avg. 348 tokens/essay) for each of the following 11 native languages: Arabic, Chinese, French, German, Hindi, Italian, Japanese, Korean, Spanish, Telugu, and Turkish.
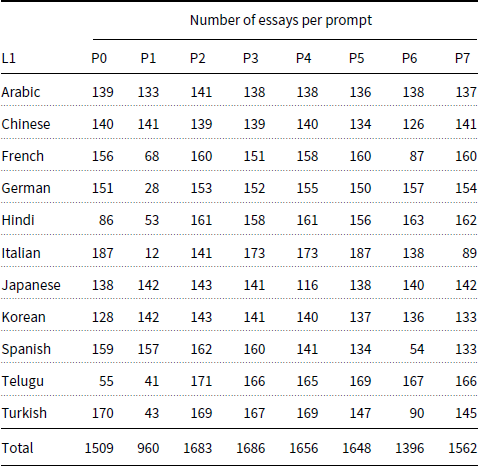
The essays were written in response to 8 different writing prompts/topics (P0–P7), all of which appear in all 11 L1 groups. The topics include old versus young people comparison, education, advertisement, car usage, travel, and risk management (statistics in Table 1). Within four of the L1 groups (Arabic, Chinese, Japanese, Korean), all prompts are approximately equally represented (12.5% per prompt); in other groups, there is more variability. The Italian group shows the largest variations: P1 representing 1.1% of the essays, while P0 and P5 each cover 17.0%.
Distribution of topics in TOEFL11

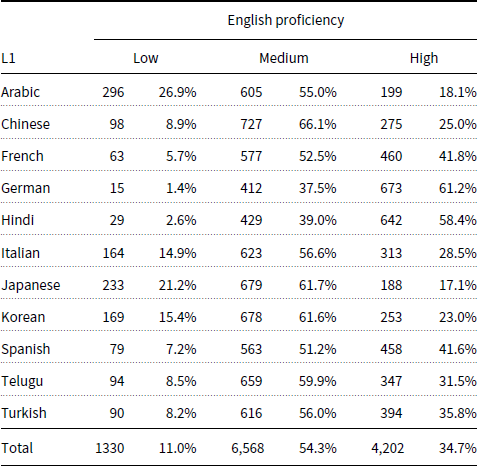
The proficiency level of the author of each essay (low, medium, or high) is provided as metadata (statistics in Table 2). The distribution of learners’ proficiency levels (determined by assessment specialists) is more variable across groups than the writing prompts. The distribution is especially sparse for the German speakers (1.4% participants have low-proficiency, 61.2% have high-proficiency). Overall, the low-proficiency category represents only 11.0% of the essays, while the medium-proficiency category comprised 54.3% and the high-proficiency category represented the remaining 34.7%.
Data statistics for the three English proficiency levels in TOEFL11

For the evaluation of cognates, L2-ed (anglicized) words, and all other misspellings, we used a 4-language subset of the corpus, focusing on the Indo-European languages that use the Latin script: French, German, Italian, and Spanish. This subset, to which we refer as TOEFL4, contains 1100 essays (avg. 353 tokens/essay) for each of the four languages.
3.1.2 ICLE dataset
The ICLEv2 dataset (Granger et al. Reference Granger, Dagneaux, Meunier and Paquot2009) consists of essays written by highly proficient non-native college-level students of English. The 6085 essays, with length between 500 and 1000 words, were written in response to 1302 prompts, manually grouped into 736 topics. The essays are of two types: literature critiques or argumentative essays. The dataset covers 16 L1s: Bulgarian, Chinese, Czech, Dutch, Finnish, French, German, Italian, Japanese, Norwegian, Polish, Russian, Spanish, Swedish, Turkish, and Tswana.
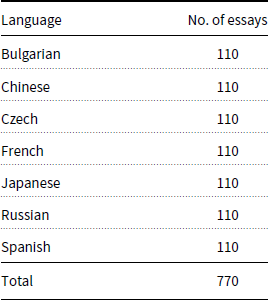
ICLE was originally collected for the purpose of corpus linguistic research, and thus has certain limitations when used for NLI research (Brooke and Hirst Reference Brooke and Hirst2011; Tetreault et al. Reference Tetreault, Blanchard, Cahill and Chodorow2012): (i) several topics contain essays by learners from a single L1 (Brooke and Hirst Reference Brooke and Hirst2011); (ii) there are several encoding errors and annotation issues, which only occur in essays written by learners from certain L1s (Tetreault et al. Reference Tetreault, Blanchard, Cahill and Chodorow2012). Because of these shortcomings, and following previous work (Tetreault et al. Reference Tetreault, Blanchard, Cahill and Chodorow2012; Ionescu et al. Reference Ionescu, Popescu and Cahill2014), we use a 7-language subset of the corpus normalized for topic bias and character encoding (the so-called ICLE-NLI subset, Tetreault et al. Reference Tetreault, Blanchard, Cahill and Chodorow2012). This subset contains 110 essays for the 7 first languages shown in Table 3. The average number of tokens per essay is 747 (after tokenization and removal of metadata). In the article, we refer to this 7-way subset as ICLE unless stated otherwise.
Number of essays per class in the 7-way ICLE dataset (the ICLE-NLI subset)

For cognates, L2-ed words, and other misspellings evaluation, we used a 4-language subset of the corpus that represents the same languages as those included in TOEFL4: French (347 essays), German (437), Italian (392), and Spanish (251). This subset, which we refer to as ICLE4, contains 1427 essays with avg. 690 tokens/essay.
3.2 Features
POS tag n-grams and function words (FWs) are considered core features in NLI research (Malmasi and Dras Reference Malmasi and Dras2015) and not influenced by topic bias. Because of this, they do not capture very specific document characteristics, and their capacity to identify the writer’s L1 is limited. At the other end of the spectrum are representations based on word and character n-grams that perform best on the NLI task, but their performance also exploits the fact that they capture topic and corpus-specific characteristics (Brooke and Hirst Reference Brooke and Hirst2011).
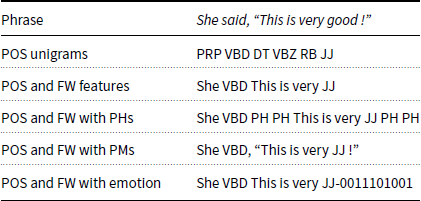
We use POS n-grams and FWs as the baseline features to represent the documents (essays) in our data. For each of the phenomena we investigate—punctuation usage, emotionally charged words, vocabulary expansion—we design a set of features. These feature sets, which are explained below, will be added to the baseline features in a variety of experiments designed to analyze their impact and robustness. Table 4 shows some examples.
Example for the features used. PH = place holder for punctuation marks (PMs)

Ultimately, we check how much of the gap between the baseline and the state of the art is filled in by modeling the phenomena we identified.
3.2.1 POS tags
POS features capture the morpho-syntactic patterns in a text. POS tags were obtained with TreeTagger (Schmid Reference Schmid1999), which uses the Penn Treebank tagset (36 tags). Table 4 shows an example using POS unigrams (without punctuation marks (PMs)). From these, POS n-grams (n = 1–3) are built.
3.2.2 Function words
FWs clarify the relationships between the content-carrying elements of a sentence and introduce syntactic structures like verbal complements, relative clauses, and questions (Smith and Witten Reference Smith and Witten1993). They are considered one of the most important stylometric features (Kestemont Reference Kestemont2014). The FW feature set consists of 318 English FWs from the scikit-learn package (Pedregosa et al. Reference Pedregosa, Varoquaux, Gramfort, Michel, Thirion, Grisel, Blondel, Prettenhofer, Weiss, Dubourg, Vanderplas, Passos, Cournapeau, Brucher, Perrot and Duchesnay2011). Since FWs are tied to the structuring of information, FWs and PMs fill roles within the same domain and could provide complementary features with respect to the NLI task. With respect to emotion features, FWs can appear as quantifiers, intensifiers (e.g., very good) or modify the emotion expressed in other ways. Table 4 shows an example for POS and FW features, from which n-grams (n = 1–3) are extracted.
3.2.3 Punctuation marks
Punctuation serves to clarify the message conveyed by an utterance, by introducing structure in the linear expression through grouping, delineating, and emphasizing units of information. This structuring being language dependent, it has the potential to interfere in L2 production, as exemplified by the following English sentence written by a German native speaker:
I think the biggest question is, how to defin an “enjoyed life”.Footnote b
A native English speaker would not insert a comma between is and how, but this reflects punctuation usage in German:
Ich denke, die größte Frage ist, wie man ein “glückliches Leben” definiert.
We evaluate the impact of PMs by adding them to POS and POS and FW representations. We evaluate first the impact of the presence of PMs using a place holder (PH) for PMs, and then the actual PMs. Examples of these two representation variations are shown in Table 4.
3.2.4 Emotion polarity features (emoP)
We encode emotion information using the information from the NRC Word-Emotion Association Lexicon (NRC emotion lexicon) (Mohammad and Turney Reference Mohammad and Turney2013), where binary associations are provided for each emotion word for eight emotions (anger, fear, anticipation, trust, surprise, sadness, joy, or disgust) and two sentiments (negative or positive)—for example, good = “0011101001”. This representation is used as a categorical feature (not a 10-dimensional binary vector). It performed best compared to other ways of encoding the emotion information, for example, using a 10-dimensional binary vector or excluding the sentiment information.
Table 4 shows an example representation when emotion polarity features are added to the POS and FW representation (without PMs).
3.2.5 Emotion load features (emoL)
Speakers of different L1s may use a higher or lower number of emotionally charged words than speakers of other L1s, reflecting cultural customs or linguistic habits of the respective cultures. We modeled this information using three types of emotion load features:
-
(1) two binary features, emoL (binary) that capture whether an essay has a high or low emotional load: (a) we compute the average proportion of emotion words in all essays in each dataset: for TOEFL11 this was 0.236 and for ICLE 0.246; (b) if the proportion of emotion words in an essay was higher/lower than the average, it gets assigned a “highly-emotional”/“low-emotional” feature, respectively. This representation was used to examine whether the polarity as such is informative,
-
(2) the proportion of emotion words in each essay as a numeric feature (1 feature, emoL (1)),
-
(3) the proportion of each emotion/sentiment in each essay (8 emotions and 2 sentiments, emoL (10)).
3.2.6 Misspelled cognates
Mann and Yarowsky (Reference Mann and Yarowsky2001), Bergsma and Kondrak (Reference Bergsma and Kondrak2007), and Nicolai et al. (Reference Nicolai, Hauer, Salameh, Yao and Kondrak2013) used string similarity for cognate identification. Following Nicolai et al. (Reference Nicolai, Hauer, Salameh, Yao and Kondrak2013), we detect cognates by identifying misspelled words  $w_m$, whose closest correctly spelled L2 word
 $w_e$ has a translation
 $w_f$ in an L1, and
 $w_m$ is closer in form to
 $w_f$ than to
 $w_e$. Formally:
(1) For each misspelled English word
 $w_m$ identify the intended word $w_e$ using a spell-checking tool.Footnote c
(2) For each L1:
a. Look up the translation
$w_f$ of the intended word $w_e$ in L1.Footnote db. Replace diacritics in
$w_f$ with the corresponding Latin equivalent (e.g., “é” $\rightarrow$ “e”).c. Compute the Levenshtein distance D between
$w_e$ and $w_f$.d. If
$D(w_e,w_f)$ $<$ 3, then $w_f$ is assumed to be a cognate of $w_e$.Footnote ee. If
$w_f$ is a cognate and $D(w_m,w_f)$ $<$ $D(w_e,w_f),$ then consider the L1 as a clue of the native language of the author.Footnote f


3.2.7 L2-ed words
To identify L2-ed (in our case anglicized) words, we take a misspelled word  $w_m$ and look for forms close to it in the L1 vocabularies. The idea is that a misspelled word may be an L1 word that got anglicized, which is a clue for the L1 of the author.
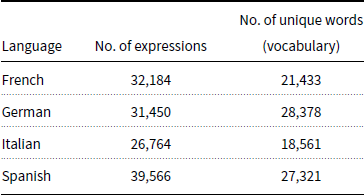
As reference vocabularies for the L1 languages in our datasets, we use the freely available lists of expressions provided by the OmegaWiki projectFootnote g and extract the unigrams. The statistics for each language in terms of the number of expressions and the extracted vocabularies is provided in Table 5.
Statistics of the number of expressions and the extracted vocabularies for each of the languages

We apply the following algorithm:
(1) For each misspelled English word
$w_m$ identify its closest word in some L1:(2) For
$w_f$ in each L1:a. Replace diacritics in
$w_f$ with the corresponding Latin equivalent (e.g., “é” $\rightarrow$ “e”).b. Compute the Levenshtein distance
$D(w_m,w_f)$.c. Identify the L1 with the smallest
$D(w_m,w_f)$ value, and if $D(w_m,w_f) < 5,$ then take $w_m$ to be an L2-ed version of $w_f$, and consider $w_m$ as a clue for the native language of the author.Footnote h


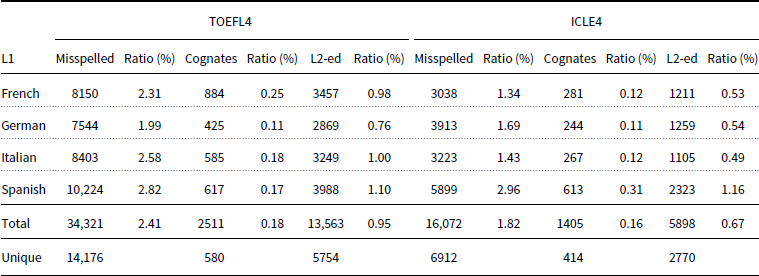
Table 6 presents the statistics of misspelled words, cognates, and L2-ed words for each language in the TOEFL4 and ICLE4 datasets, respectively. The number of L2-ed words is much larger than the number of cognates: in both datasets around 40% were assigned the corresponding L1 (5754 out of the 14,176 unique misspelled words in TOEFL4 and 2770 out of 6912 in ICLE4). This could be because of the tight constraint for “cognatehood” we followed (Mann and Yarowsky Reference Mann and Yarowsky2001). In TOEFL4, the cognate and the L2-ed word lists have 350 elements in common (310 of which have the same identified L1). Two hundred and thirty cognates were not identified as L2-ed words and 5404 L2-ed words were not identified as cognates. In ICLE4, the cognate and the L2-ed word lists have 266 elements in common (231 of which have the same identified L1). 148 cognates were not identified as L2-ed words and 2504 L2-ed words were not identified as cognates.
Statistics (absolute number and ratio (%) to the total number of words) of misspelled words, cognates, and L2-ed words for each language in the TOEFL4 and ICLE4 datasets

We combine the L1s of misspelled cognates and L2-ed words with the POS and FW representation, as shown below for the two phrases: have a happy ancianity and a good inocent man.Footnote i

We extract n-grams (n = 1–3) from this representation.
3.2.8 Spelling errors
SEs are considered a strong indicator of an author’s L1, since they reflect L1 influences, such as sound-to-character mappings. Chen et al. (Reference Chen, Strapparava and Nastase2017) showed that adding SE character n-grams to other features common in the literature (word and lemma n-grams) improves NLI classification accuracy.
Following Chen et al. (Reference Chen, Strapparava and Nastase2017), we represent misspelled words through character n-grams (n = 1–3) and add them as a separate subset of the feature vector representing an essay.
3.3 Learning setup
We used the liblinear scikit-learn (Pedregosa et al. Reference Pedregosa, Varoquaux, Gramfort, Michel, Thirion, Grisel, Blondel, Prettenhofer, Weiss, Dubourg, Vanderplas, Passos, Cournapeau, Brucher, Perrot and Duchesnay2011) implementation of support vector machines (SVM) with OvR (one vs. the rest) multi-class strategy. The effectiveness of SVM has been proven by numerous experiments on text classification tasks in general and on NLI in particular (Cimino and Dell’Orletta Reference Cimino and Dell’Orletta2017; Markov et al. Reference Markov, Chen, Strapparava and Sidorov2017; Markov and Sidorov Reference Markov and Sidorov2018).
Currently, the most successful learning formalism for numerous (maybe most) NLP tasks is deep learning. Its main strength comes from the fact that it can learn not only the model—in the form of weights of its various units—but also an input representation that is adapted to the learning task and the architecture. This formalism was not appropriate for our task for the following reasons: (i) the nature of the data—identifying a speaker’s L1 relies on features very particular to speakers of L1 and could not be generated based on the given data as it is rather small; (ii) the phenomena investigated—we focused on specific linguistic phenomena, which can be captured by particular features that model very specific, and unconventional, contexts (e.g., usage of punctuation, particular misspellings, anglicized words), the model cannot rely on features built based on general corpora that essentially summarize thousands of occurrences of the same words or character sequences in different contexts. We confirmed these assumptions empirically, using different types of representations, including embeddings and one-hot vectors to model occurrence as opposed to meaning (thus simulating the kind of features we used). These assumptions are also supported by the literature: Rangel et al. (Reference Rangel, Rosso, Brooke and Uitdenbogerd2018) and Franco-Salvador, Kondrak, and Rosso (Reference Franco-Salvador, Kondrak and Rosso2017) compare approaches using deep learning with SVM, naive Bayes, and logistic regression. String kernels provide better performance, with a slight increase in a meta-learning setup that includes word embeddings (Franco-Salvador et al. Reference Franco-Salvador, Kondrak and Rosso2017). Rangel et al. (Reference Rangel, Rosso, Brooke and Uitdenbogerd2018) use deep learning on representations of documents built based on a word x document occurrence matrix (and not word or document embeddings as more commonly used with deep learning methods). Chen (Reference Chen2016) compared the performance of various deep learning models (e.g., convolutional neural networks (CNN), several sequence models: recurrent neural networks, long short-term memory networks (LSTM)) with machine learning models (SVM) for NLI, concluding that machine learning models outperform deep learning models for this task. This was also confirmed by our experiments with deep learning models (CNN, LSTM, and bidirectional encoder representations from transformers), which showed lower results than machine learning models. This can be partly related to the large number of out-of-vocabulary words in our data (around 50% of the words are out-of-vocabulary words), for which an informative representation cannot (and maybe, should not—as their occurrence is what is interesting, not their meaning) be derived based on the available data.
3.4 Evaluation
The results were measured in terms of classification accuracy. Where not otherwise specified, the experiments were carried out under 10-fold cross-validation.
4. Experiments and results
We report the results of the experiments conducted in different settings to measure the impact of punctuation, emotion expressions, cognates, L2-ed words, and other misspellings on the NLI task.
4.1 Punctuation
Punctuation is specific to each language and is part of the indicators that overtly represent the manner in which each language organizes and conveys information. We have designed a suite of experiments to help clarify the role/impact of punctuation usage as indicators of the author’s native language: (i) the (usual) one-step classification, (ii) a two-step classification—classify the language family/geographical group, and then the actual L1—to check whether there are commonalities across language families, and also particularities that distinguish punctuation usage for specific languages within a family/group, (iii) we test the use of punctuation within different proficiency levels, to check whether with better L2 skills, the speakers also adopt punctuation usage closer to a native speaker’s, (iv) cross-corpus and cross-topic testing, to verify the robustness of punctuation features.
4.1.1 Multi-class and two-step classifications
Multi-class classification setting is the usual NLI task, where the L1 of the author of a document is predicted based on a specific representation of the document.
We postulate that punctuation usage from L1 is reflected in the text produced in L2. Since native languages belong to specific families, we check whether there are strong influences within the language families, as well as at individual language level through a two-step classification: (i) a coarse classification into language families/geographical grouping of languages, (ii) fine-grained classification within each language group.
Based on the languages represented in each dataset, we group them either by language family or by geographical location.Footnote j The language grouping used is the following:
• TOEFL11: Arabic; Asian = {Chinese, Korean, Japanese}; Romance = {French, Italian, Spanish}; German; Indian = {Hindi, Telugu}; Turkish.
• ICLE: Slavic = {Bulgarian, Czech, Russian}; Asian = {Chinese, Japanese}; Romance = {French, Spanish}.
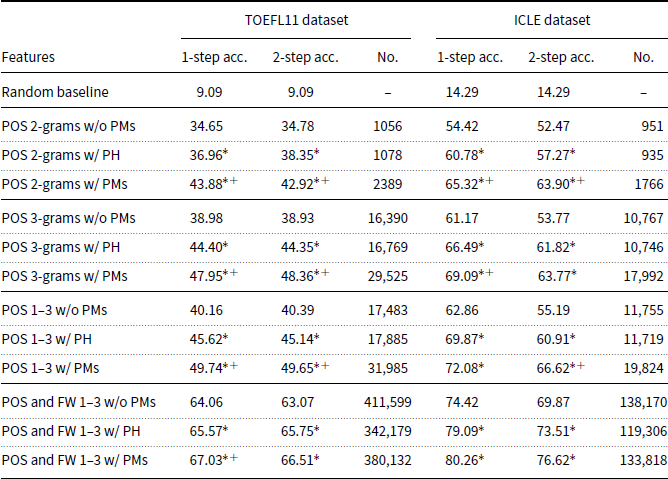
Table 7 shows the multi-class classification results (column 1-step) in terms of accuracy (%) for POS n-grams (n = 2, 3, and 1–3) and POS and FW n-grams (n = 1–3) without PMs, with a PH, and with PMs. As a reference point, we provide the random baseline (also used in the NLI shared tasks 2013 (Tetreault et al. Reference Tetreault, Blanchard and Cahill2013) and 2017 (Malmasi et al. Reference Malmasi, Evanini, Cahill, Tetreault, Pugh, Hamill, Napolitano and Qian2017)): 9.09% for 11 classes in the TOEFL11 dataset and 14.29% for 7 classes in the ICLE dataset. In this and further experiments, the number of features (No.) is provided. Statistically significant gains/drops according to McNemar’s statistical significance test (McNemar Reference McNemar1947) with an  $\alpha$ value
 $<$ 0.05 compared to the same representation without PMs are marked with “*” and compared to the same representation with PH are marked with “
 $^+$”.
Ten-fold cross-validation results (accuracy, %); POS and POS and FW n-grams with and without PMs; 1- and 2-step approaches. “*” and “ $^+$” mark statistically significant differences with the same representation without PM and with PH, respectively

The inclusion of PHs significantly improves the results for all the considered settings. When PHs are replaced by the actual PM, the improvements are significant in the vast majority of settings.
The purpose of the two-step classification setup was to determine whether there are commonalities in punctuation usage across languages within the same family/geographical group. This would reflect the grammatical/prosody/information structuring in different language families or groups.
The improvement for the two-step approach demonstrates that there are shared patterns of punctuation usage across the grouped languages and within individual languages.
The analysis of the 10 top features according to their weights for each dataset revealed that PMs are present among the 10 top features for all of the classes. The most frequent PMs in these highly ranked features (bigrams and trigrams) were commas and full stops. An ablation study conducted to reveal the most indicative PM-enriched features showed that the performance does not come from one pattern, but L1-specific combinations.
It is interesting to note that the combination of POS and FW 1–3-gram features significantly outperforms the POS representation. This result is in line with previous studies on NLI, for example, Malmasi and Dras (Reference Malmasi and Dras2015), and provides additional evidence for the effectiveness of FW features in this task.
4.1.2 Proficiency-level classification
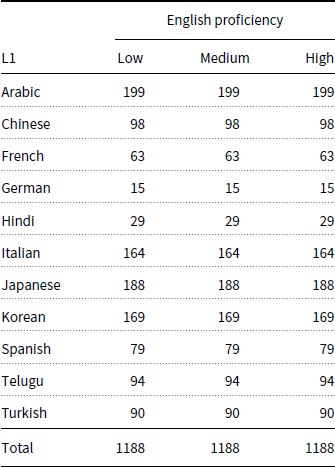
As students increase their language proficiency, it would be expected that their usage of punctuation will get closer to a native’s, and the influence of their native language to get weaker. To test whether this is indeed the case, we have built a balanced dataset (from the point of view of proficiency levels) as a subset of the TOEFL11 dataset. The distribution of English proficiency levels in the TOEFL11 dataset is quite imbalanced, as shown in Table 2. To produce a balanced subset, we extract the same number of essays within each proficiency level (equal to the minimum number of essays for each level for each L1, Table 8).
Balanced distribution of English proficiency levels in the TOEFL11 dataset

We use both the imbalanced and balanced subsets to perform multi-class classification based on the proficiency level using POS and POS and FW n-grams without PM features, with PHs, and with the actual PMs, to determine the impact the punctuation has within each proficiency level.
We investigate whether higher proficiency levels lead to punctuation usage closer to an L2 native speaker. Should that be the case, the performance in NLI should decrease with higher proficiency levels, particularly when adding PMs to the document representations.
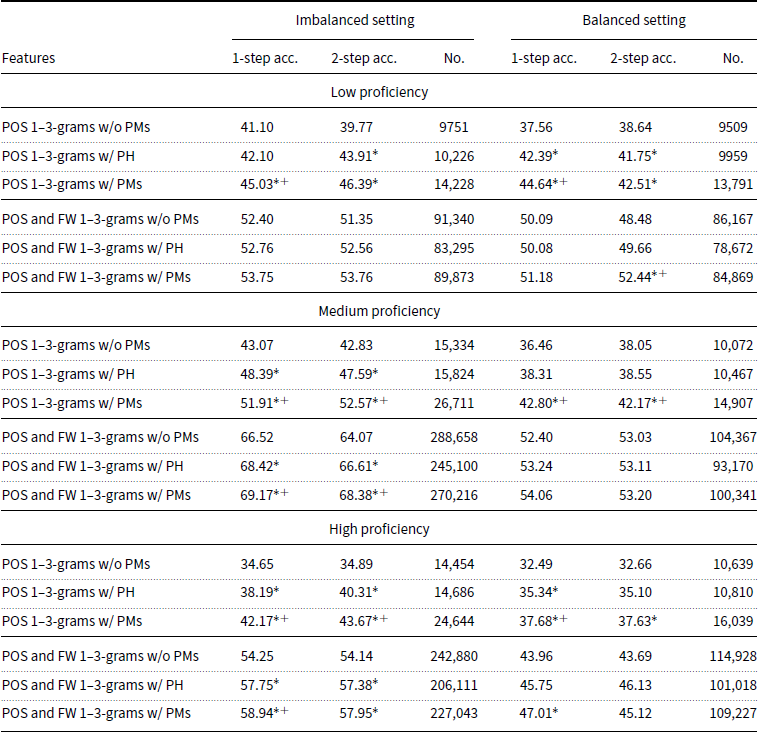
The results for each proficiency level on the imbalanced and balanced subsets of the TOEFL11 dataset are shown in Table 9.
Ten-fold cross-validation results (accuracy, %) for the imbalanced and balanced settings for each proficiency level

It is interesting to note that while the L1 classification results based on POS and POS and FW n-grams go down for high proficiency levels, the impact of adding the PMs is still high. According to Hirvela, Nussbaum, and Pierson (Reference Hirvela, Nussbaum and Pierson2012), L2 English learners are confident about their use of punctuation. However, the high improvement for high-proficiency learners in both imbalanced and balanced settings suggests that learners keep their L1 punctuation style even when achieving high English proficiency.
4.1.3 Cross-topic and cross-corpus classification
Brooke and Hirst (Reference Brooke and Hirst2012) have criticized the datasets used for NLI because they represent different topics, and thus the performance of the n-gram-based classifiers is questionable as they capture topics rather than native language phenomena. To investigate the impact of punctuation features which are rather abstract, we perform cross-topic and cross-corpus classification.
Cross-topic
The essays in the TOEFL11 dataset were written in response to 8 different topics or prompts (P0–P7), and all 8 prompts are represented in all 11 L1 groups. We split the dataset in two ways:
(1) make folds based on the topics—a topic will be present in only one fold (8 topics
$\rightarrow$ 8-fold cross-validation).-
(2) use 5838 essays written on the first four prompts (P0–P3) for training and 6262 essays written on the P4–P7 prompts for testing. To compare the result of this experiment with a mixed-topic scenario with approximately the same number of essays for training and testing, we split the TOEFL11 dataset using half of the essays on each prompt for training (6050 essays) and testing (6050 essays): for example, from the 140 essays of Chinese learners on P0, 70 are used for training and 70 for testing.

Cross-corpus
We extract subsets of our two datasets that represent the same languages. The TOEFL11 and the ICLE datasets have seven common languages: Chinese, French, German, Italian, Japanese, Spanish, and Turkish. We extract the subsets corresponding to these languages from the two corpora. We use each in turn for training and testing, respectively. For this experiment, we did not balance the ICLE7 dataset and used all the essays for each of the selected languages. The data statistics are shown in Table 10.
Number (No.) of essays per class in the ICLE dataset used for the cross-corpus experiment

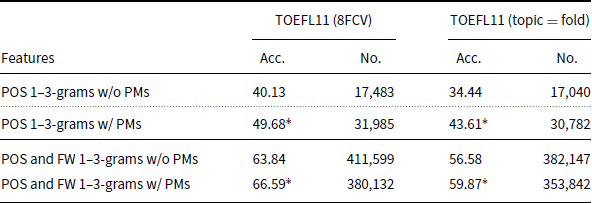
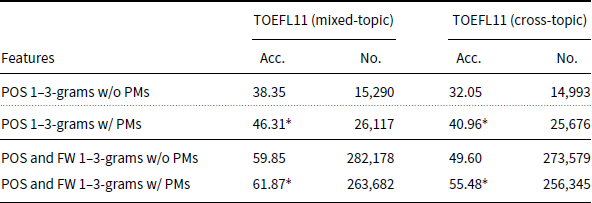
The purpose of the cross-topic and cross-corpus experiments is to show that the influence of punctuation from the native language transcends topics and corpora. The results for cross-topic classification are presented in Tables 11–12. Separating the training and test data based on topics leads to a drop in performance of approx. 5 percentage points in both the cross-validation and train/test split conditions. But for both settings, adding the punctuation-based features leads to very similar increases in performance whether the topics are separated or mixed. This indicates that the punctuation-based features are robust and portable across topics.
Eight-fold cross-validation and one fold/topic setting results

Mixed- and cross-topic settings results

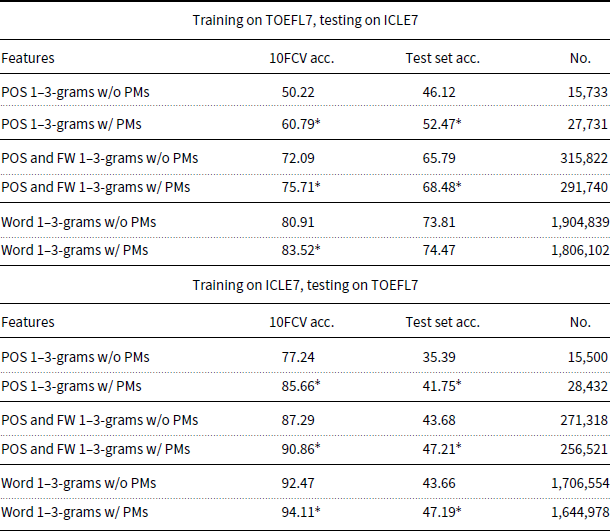
The cross-corpus experiments explore further the robustness of the punctuation-based features. An overfitting model would lead to lower scores when tested on a corpus different to the training corpus. We include here experiments done using word n-grams (n = 1–3), tf weighted just like our other features (as described in Section 3). The results (training on TOEFL7 and testing on ICLE7, and vice versa) are shown in Table 13. 10FCV stands for 10-fold cross-validation on the training data (accuracy, %).
Cross-corpus classification results for POS, FW, and word n-grams with and without PMs

Despite the loss in performance suffered by the model based on POS and word n-gram features, the PM features are robust and lead to the same increase in performance on testing as they did on training. While the loss in performance when training on TOEFL/testing on ICLE is relatively small (5–7 percentage points for accuracy), training on ICLE and testing on TOEFL lead to much more dramatic drops (45 percentage points for accuracy). For the models based on word n-grams, their high results are harder to improve by the addition of PM features, but they contribute nonetheless, and when added to the model trained on ICLE their impact on the TOEFL data are higher than on ICLE.
4.2 Emotions
We explore the hypothesis that emotion is one of the dimensions of language that surfaces from the native language into a second language. To check the role of emotions in NLI, we model emotion information through polarity and emotion load features and use document representations using these features to classify the native language of the author. After confirming the potential of emotion words for NLI, we follow the same experimental procedure as for punctuation: (i) one-step classification, (ii) two-step classification—classify the language family/geographical group, and then the actual L1, (iii) proficiency level analysis, (iv) cross-corpus and cross-topic testing, to verify the robustness of punctuation features.
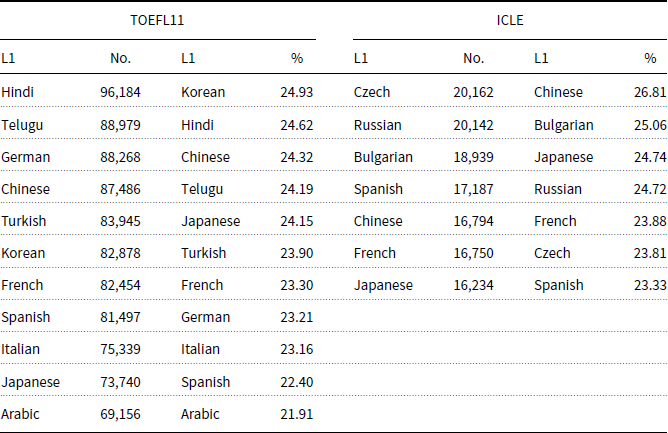
As emotion words, we consider the 14,182 words listed in the NRC Word-Emotion Association Lexicon (NRC emotion lexicon) (Mohammad and Turney Reference Mohammad and Turney2013) and their associations with eight emotions (anger, fear, anticipation, trust, surprise, sadness, joy, and disgust) and two sentiments (negative and positive). The annotations were gathered through Amazon Mechanical Turk.Footnote k Table 14 presents the emotion words statistics for our data.
Emotion words statistics (absolute number and frequency) sorted from the highest to the lowest

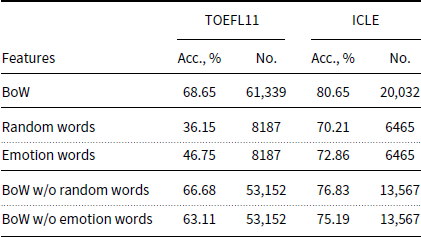
As a first step, we assess the impact of emotion words on the NLI task. Because the bag-of-words (BoW) representation covers a variety of phenomena, including emotion, we experiment using the BoW representation, and subsequently the BoW without the words that have an emotional dimension. To verify that the effect in classification is not just due to the removal of features, we randomly select a set of words of the same size as the emotion words and remove those from the BoW to test the effect. Table 15 presents the 10-fold cross-validation results (accuracy, %) on the TOEFL11 and ICLE datasets, when using emotion words and random words as features, as well as the results when excluding emotion words or random words from the BoW approach. Random words accuracy was calculated as average over five experiments with five different sets of random words.
Performance of emotion words

The results in Table 15 show that emotion words have higher impact on classification accuracy than random words when evaluated in isolation. Moreover, the accuracy drop is higher when excluding emotion words from the BoW approach than when excluding random words, confirming that emotion is a useful dimension for L1 classification, and not just an effect of having additional features.
4.2.1 Multi-class and two-step classification
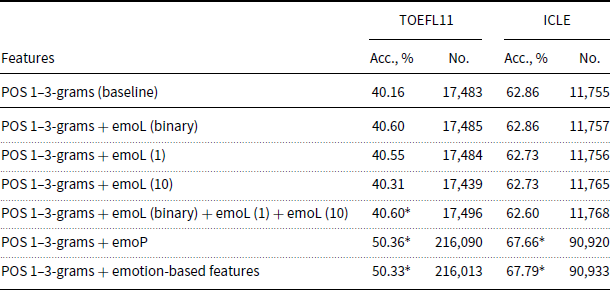
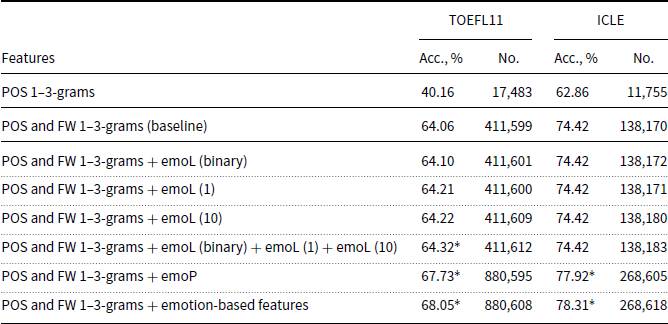
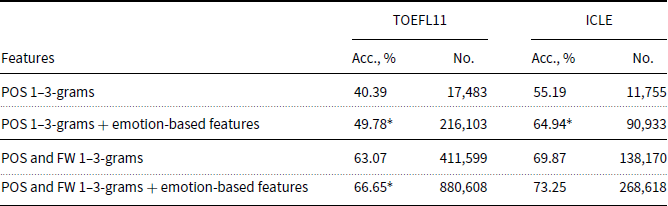
Following our experiments with punctuation, we provide the results when adding emotion-based features to POS and POS and FW n-gram (n = 1–3) feature set. The 10-fold cross-validation results in terms of accuracy (%) on the TOEFL11 and ICLE datasets are shown in Tables 16 and 17, respectively.
Ten-fold cross-validation accuracy for POS 1–3-grams combined with emotion-based features. “*” marks statistically significant differences with the baseline

Ten-fold cross-validation accuracy for POS and FW 1–3-grams combined with emotion-based features. “*” marks statistically significant differences with the baseline

The experimental results show that emotion features, in particular the emoP features, significantly contribute to the results for all the considered settings, indicating that different cultures (as defined by the authors’ L1) have different emotion word usage. It is interesting to note that despite being very general, the three types of emoL features—13 features that characterize the emotional load of a document—also improve the results in the majority of settings, including when combined with the emoP features. This supports the hypothesis that some cultures use a larger or smaller emotional vocabulary. More fine-grained emotional load features could improve the results further.
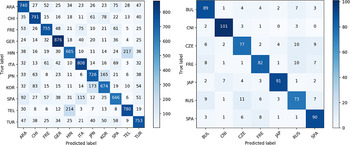
The confusion matrices for the POS and FW 1–3-grams combined with all emotion-based features (emoP and three types of emoL features) on the TOEFL11 and ICLE datasets are shown in Figure 1.
Confusion matrices for the POS and FW 1–3-grams in combination with all emotion-based features (emoP and three types of emoL features) on the TOEFL11 (left) and ICLE (right) datasets.

It is notable that there is a high confusion between Hindi and Telugu, the two L1s that use the largest absolute number of emotion words when producing texts in English as L2 (Table 14). Hindi and Telugu were the most problematic L1s to identify, with the highest degree of confusion, in both editions of the NLI shared task (Tetreault et al. Reference Tetreault, Blanchard and Cahill2013; Malmasi et al. Reference Malmasi, Evanini, Cahill, Tetreault, Pugh, Hamill, Napolitano and Qian2017). The fact that these languages share a geographical space and as such have highly interacting populations could account for shared traits of their native speakers that translate into similar linguistic markers produced in L2. The lowest results on the ICLE dataset were obtained for Czech and Russian, again the languages with the largest number of emotion word usage. Czech and Russian are both European Slavic languages, representing cultures that have historically interacted for long periods of time. As in the case of Hindi and Telugu, this could explain shared traits that surface in L2 and make them harder to distinguish. Understanding which phenomena (in this case, similar emotional profiles) makes languages harder to distinguish could provide insights and allow for the development of more focused and detailed representations to develop more robust NLI systems to identify these languages.
The relative confusion between Telugu/Hindi and Czech/Russian raises the question whether emotion usage indeed depends on language family/geographical group. The high improvement provided by the emotion-based features for the two-step classification (Table 18) suggests that there are commonalities across language families, and also particularities that distinguish emotion usage for specific languages within a family/group.
Two-step 10-fold cross-validation accuracy. “*” marks statistically significant differences

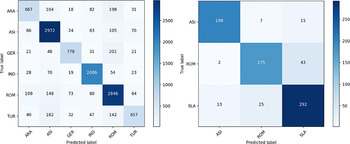
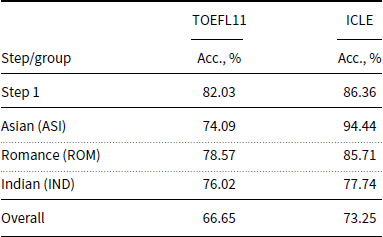
The results for the first step using the POS and FW 1–3-grams in combination with emotion-based features and the classification results within each group in the two-step approach are shown in Table 19. The confusion matrices for the first step are presented in Figure 2.
Confusion matrices for the first step in the two-step approach using the POS+FW 1–3-grams in combination with emotion-based features on the TOEFL11 (left) and ICLE (right) datasets.

On the ICLE dataset, the confusion is mostly between the Romance and Slavic languages, which to a certain degree coexist in the same geographical area, while the confusion with Asian languages is much weaker.
Ten-fold cross-validation accuracy for the first step and within each group in the two-step approach

4.2.2 Proficiency-level classification
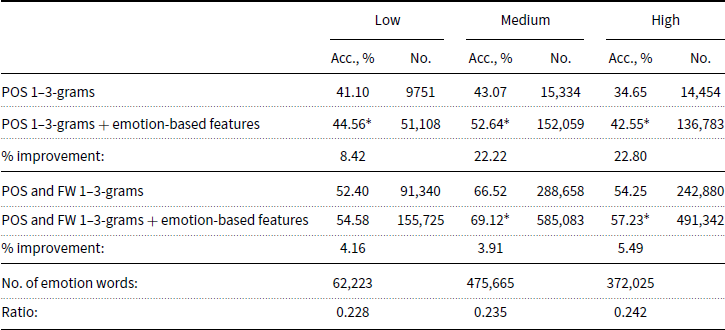
The ability to choose the proper words to express oneself increases with the proficiency level. This could be reflected in different ways from the point of view of the emotions expressed: (i) L2 speakers will choose words with emotion content that is closer to their L1 or (ii) their emotional word usage will become closer to a native speaker’s, and thus further from their L1. We experiment with L1 classification separating the data based on the three different proficiency levels in the TOEFL11 dataset. The results are included in Table 20. The “%” row shows the rate of increase in performance when emotion features are included in the representation. These features have a clear positive impact for all proficiency levels and a higher impact for the medium and high levels. This could be explained by the fact that with higher proficiency, L2 speakers are better able to choose the desired lexical material in L2 and can express themselves in a manner closer to what they intend.
Ten-fold cross-validation accuracy for each proficiency level with and without emotion-based features (imbalanced setting). “*” marks statistically significant differences

4.2.3 Cross-topic and cross-corpus classification
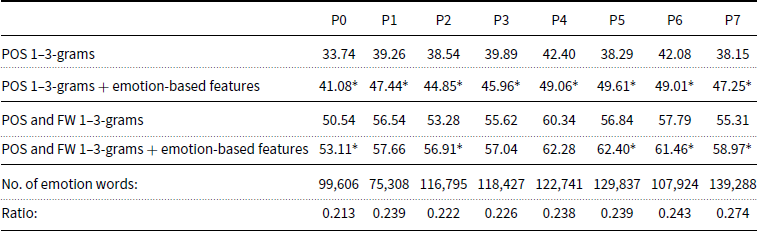
Different topics may also elicit different levels of emotion word usage. To explore this issue, we conducted experiments for the topics in the TOEFL11 dataset (Table 21).Footnote l The improvement brought by the emotion-based features does seem to depend on the topic. The highest improvements were achieved for P5 (car usage) and P7 (young vs. old people comparison). When combined with the POS and FW representation, emotion-based features are less helpful (not statistically significant improvements) for the topics discussing traveling (P1), ideas versus facts (P3), and education (P4). Overall, adding emotion-based features to POS and POS and FW representations leads to accuracy improvement for all the topics.
Ten-fold cross-validation accuracy for each topic in the TOEFL11 dataset. “*” marks statistically significant differences

4.3 L2-ed words, misspelled cognates, and other misspellings
We analyze in parallel three of the phenomena responsible for the incorrect expansion of L2’s vocabulary using L1 material: misspelled cognates, L2-ed words, and all other SEs. We analyze how much each of these phenomena reveals about the L2 speaker’s native language. We use the subsets of the TOEFL11 and ICLE datasets that cover languages that use the Latin script (cf. Section 3).
4.3.1 Multi-class classification
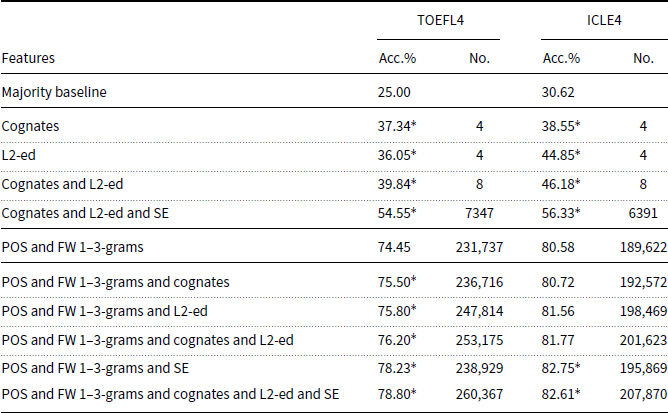
We first examine the features obtained from misspelled words—cognates, L2-ed, SE character n-grams—and verify whether they are informative for NLI. First, we use only the aggregated information about identified L1s as features, then we use them in combination with the SE character n-grams (n = 1–3). We compare the obtained results with the majority baselines of 25.00% and 30.62% accuracy for TOEFL4 and ICLE4, respectively. We then use as a baseline the POS and FW features, to which we add the cognates, L2-ed words, and SE character n-grams. The POS tags of the cognates and L2-ed words are replaced by the identified L1, and n-grams from this representation are built (cf. Subsection 3.2). SE character n-grams are represented through separate feature vectors.
The results for this experiment are shown in Table 22.
Ten-fold cross-validation accuracy for cognates, L2-ed words, their combination, and when combined with spelling error (SE) character n-grams on the TOEFL4 and ICLE4 datasets, and for POS and FW 1–3-grams combined with the cognate and L2-ed features and in combination with SE character n-grams

The improvement in terms of accuracy over the majority baselines by more than 10 percentage points achieved when using the proposed features in isolation confirms that these features are highly relevant for NLI. Combining these features further boosts the results, showing that their L1 signal is strengthened with each additional source of information. The combination of L2-ed words and misspelled cognates provides statistically significant improvement in the majority of cases. SE character n-grams further increase the results. Replacing the POS tags of the misspelled words with the corresponding L1s and using word n-grams of such features (n = 1–3) provide improvement on both datasets.
A complicating factor in this classification is the fact that the four languages represented in the dataset have shared etymological ancestors and thus shared cognates. Furthermore, three of these languages are Romance languages, and thus are even closer, and may confound the Levenshtein distance computation.
4.3.2 Proficiency-level classification
We evaluate the impact of cognates and L2-ed words within each proficiency level. It is expected that the impact (as well as the frequency) of L2-ed words will decrease with an increase in proficiency.
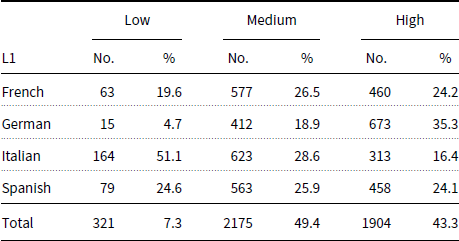
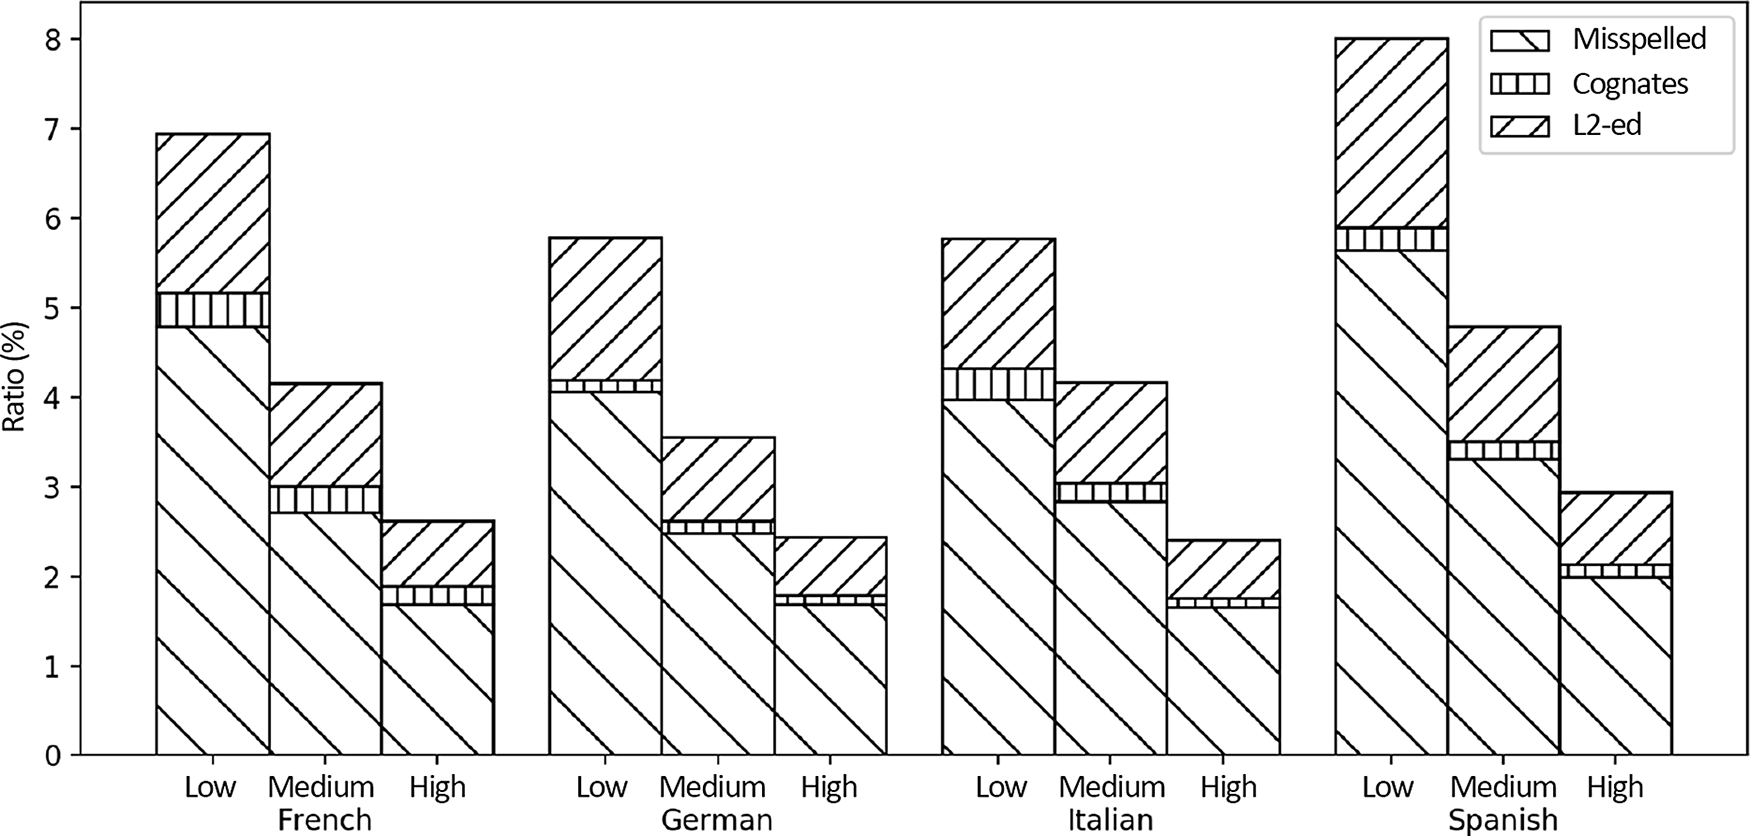
The statistics for the number of essays per language within each proficiency level is shown in Table 23. The statistics for the misspelled words, cognates, and L2-ed words (as a percentage of the total number of tokens) for each language within each proficiency level is provided in Figure 3. As all these phenomena are gathered from misspelled words, it is not surprising that their overall frequency decreases with the proficiency level. The number of L2-ed words is still higher than the number of cognates throughout all proficiency levels and L1s. Analysis of the identified L2-ed words reveals that many of them do have a common etymological ancestor as a word from L2, but they are written in such a way that their Levenshtein distance from the L2 version is greater than their distance from the L1 version. Using information about shared etymologies could help make the separation between words with shared etymologies and “corrupted” L1 words clearer.
Data statistics for the three English proficiency levels in TOEFL4

Ratio (%) of the misspelled words, cognates, and L2-ed words to the total number of words for each language within each proficiency level.

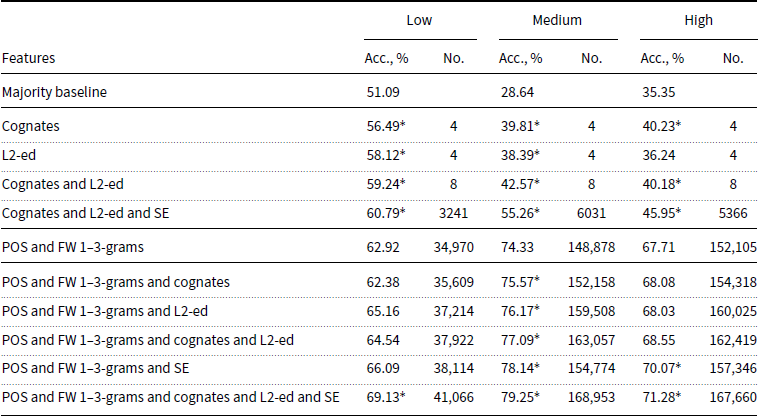
The results for each proficiency level (Table 24) indicate that, in the majority of cases, the influence of L2-ed words gets weaker from low to high proficiency, while the influence of the cognates grows with the proficiency level, despite the fact that even for higher levels of proficiency the number of L2-ed words is higher than the number of cognates. This shows that even high-proficiency language users are prone to extend their vocabulary in L2 incorrectly, but following cognate principles, when no fitting lexical item is readily available to them. Higher results are usually achieved when these features are combined, regardless of the proficiency level.
Ten-fold cross-validation accuracy for cognates, L2-ed words, their combination, and when combined with spelling error (SE) character n-grams for each proficiency level, and for POS and FW 1–3-grams combined with the cognate and L2-ed features and in combination with SE character n-grams

High improvement achieved for medium proficiency can be related to a larger number of essays for this level.Footnote m
4.4 Correct cognates
In the experiments presented above, we exploited only misspelled words to extract L1-indicative features. While we do not expect to find L2-ed words among the correctly spelled words, there will be correct cognates. In order to detect properly spelled cognates, we used etymological information obtained from the Etymological WordNet (de Melo and Weikum Reference de Melo and Weikum2010). We identify “perfect” cognates if the lemma occurs in the Etymological WordNet’s L1 vocabulary, while “not perfect” cognates are identified as words (lemmas) that share an etymological ancestor and their Levenshtein distance  $<$ 3 (diacritics removed). The Levenshtein distance was used since the ancestor can have multiple descendants.
When the L1s of the identified correct cognates are used as separate features, they perform by around 3 pp above the majority baseline, but do not enhance the results when combined with misspelled cognates and L2-ed words. This could be related to the fact that correct cognates are either closest to their L1 form or part of a more basic vocabulary that all learners have to master. We design features that capture the distance between cognates in L2 and some L1—for correct cognates we use the average of the Levenshtein distances for each L1 as a numeric feature. These features outperform the majority baseline by around 4% on TOEFL4 and 6% on ICLE4. When combined with L2-ed words, misspelled cognates, or POS and FW 1–3 gram representations, the improvement on ICLE4 (1%–5% improvement depending on the setting) is higher than on TOEFL4 (1%–3% improvement depending on the setting), which could be due to the topics or the high proficiency level of the ICLE essays.
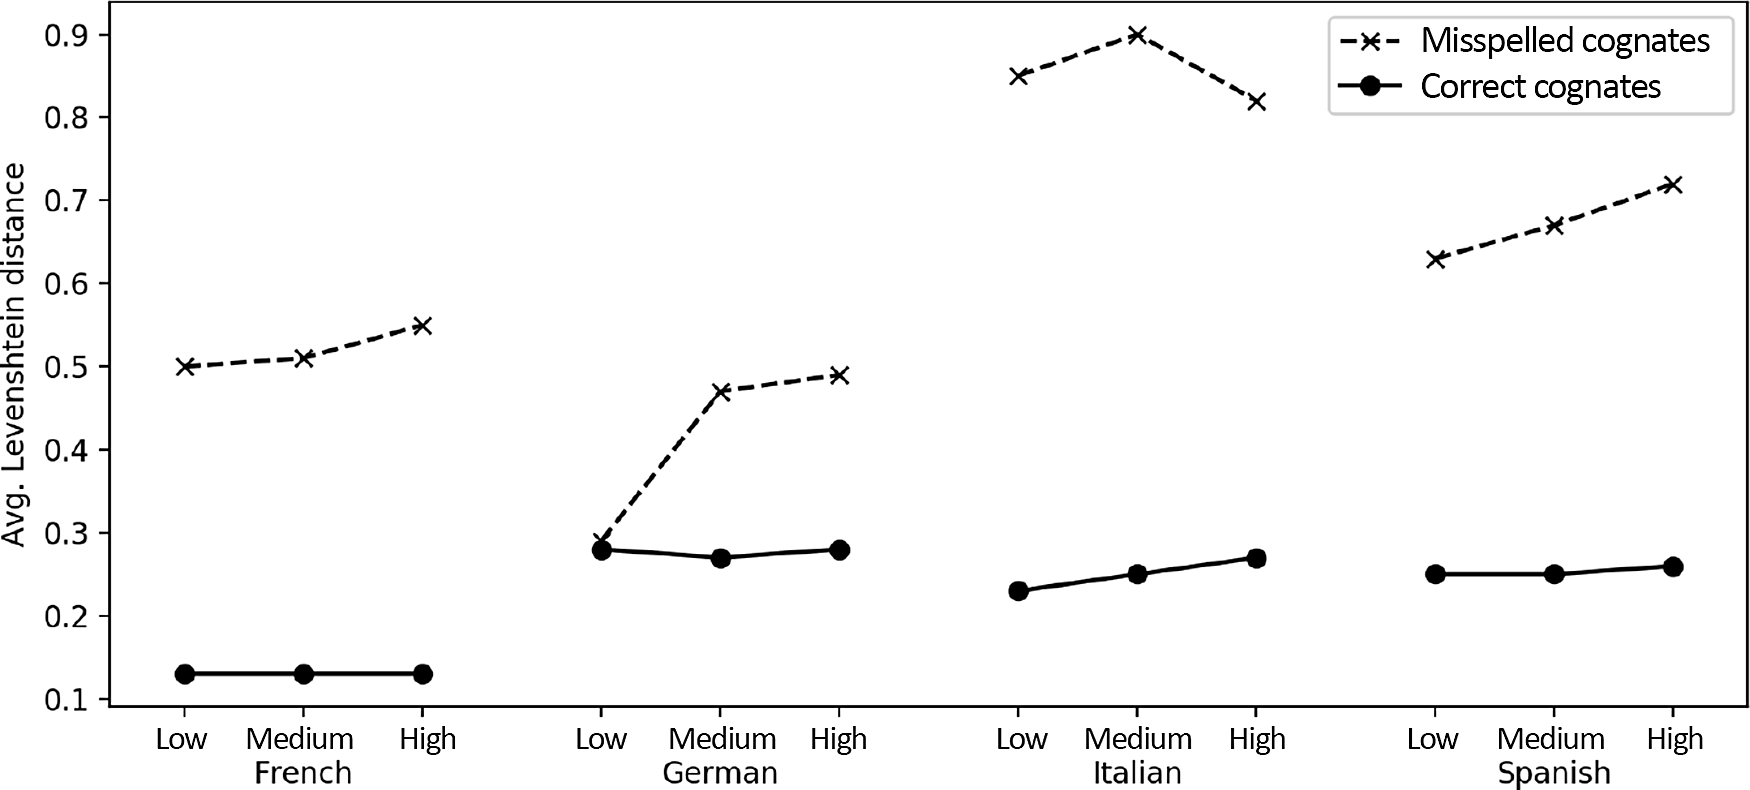
Analysis of the average Levenshtein distances in our datasets and within each proficiency level for correct and misspelled cognates reveals that the average Levenshtein distance is lower for correct cognates (Figure 4), which indicates that learners tend to correctly use cognates when they are closer to the form they are familiar with in their L1. This distance increases with the proficiency level, which can be due to the fact that learners with high proficiency use more complex vocabulary, with cognates that have a form that is more distant from the one in L1.
Average Levenshtein distances for correct and misspelled cognates for each language within each proficiency level.

Another factor to consider are false friends. Since words are judged outside of their context and based only on their form, false friends are not distinguished from proper cognates. The word became may appear correct, unless the larger context is taken into account: I became a letter. Such a usage would reveal the writer to be a native German speaker, where bekommen means to receive. Detecting false friends, however, is a difficult problem.
Gathering all such information would provide additional insight on how the L1 vocabularies influence lexical choice in L2, and we plan to address some of these issues in future work.
5. Revisiting the performance
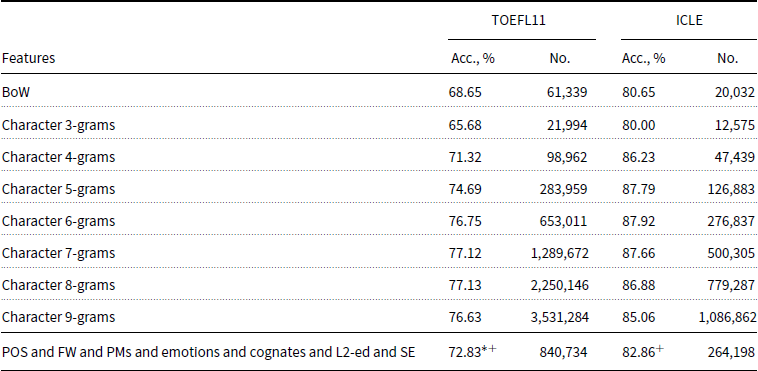
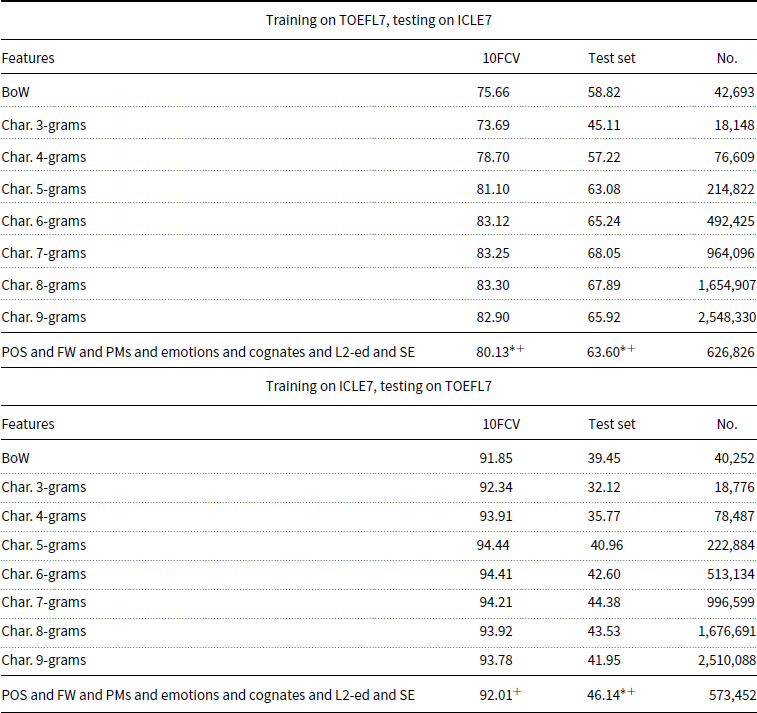
The main goal of our investigation is to identify and analyze very specific linguistic phenomena with respect to their interference in second language production. In particular, we focused on punctuation usage (as an expression of structuring the information conveyed), emotion (as an expression of cultural biases with respect to the usage of emotion terms in written communication), and cognates and sound-driven types of SEs (as an expression of the influence of the forms and sounds from the native language on second language production). These phenomena, and others, are indiscriminately covered by word and character n-gram text representations, which are very successful in the NLI task. After the separate analysis of the contribution of the three linguistic phenomena we targeted, it is natural to ask how much of the gap in performance between a baseline essay representation—POS tags and FW—and the word and character n-gram representation we can fill by adding to the baseline the features that capture these phenomena. Tables 25 and 26 show the results of these experiments, under multi-class and cross-corpus settings.Footnote n
Multi-class classification. Our approach versus baselines. “*” and “ $^+$” mark statistically significant differences with BoW and the best representation, respectively

Cross-corpus classification. Our approach versus baselines. “*” and “ $^+$” mark statistically significant differences with BoW and the best representation, respectively

There are several observations. First, with respect to the best-performing representation using character n-grams, n varies from corpus to corpus, and also between different experimental setups (within-corpus or cross-corpus). The large size of n also hints at some overfitting, and this is confirmed by the large differences (avg. 19 pp for TOEFL and 54 pp for ICLE) between the within-corpus (10-fold cross-validation—10FCV) and cross-corpus (test) setups presented in Table 26. Second, while the phenomena explicitly represented do not cover the entire performance gap (evidenced by the negative difference with respect to the best representation), they are extremely robust and compensate for the overfitting of the BoW representation (evidenced by the consistent difference between the combined representation and the baseline). We happily note that in the cross-corpus ICLE setup (training on ICLE7, testing on TOEFL7), the baseline model enriched with the combined representation of our targeted phenomena has a higher performance than the best character n-gram representation.
These results indicate that there is much to be learned by explicitly analyzing linguistic phenomena that have the potential to interfere in second language production. The advantages are not only in understanding how to adjust materials for a more close-to-optimal second language acquisition but also in obtaining a higher and more robust performance in NLI.
6. Conclusions
In this article, we have presented the results of our investigation of various aspects of language that seep into L2 production: the languages’ structuring of information through the use of punctuation, emotion expression in language, and incorrect expansion of L2’s vocabulary through commonalities or similarities of form with the vocabulary of the native language L1.
The experiments conducted to investigate the impact of punctuation on NLI showed that PMs provide useful information for the NLI task. Their impact is positive for both coarse (family-language level) and fine-grained classification, indicating that there are patterns of punctuation usage that are common across language families, but also patterns specific to individual languages. Punctuation interference does not decrease with the level of proficiency and they are abstract and robust NLI features, as shown by the results of cross-topic and cross-corpus experiments.
We investigated the hypothesis that the use of emotions is indicative of an author’s native language. We used two types of emotion-based features—one that captures the types of sentiments expressed, the other captures the frequency of emotion words in essays. The fact that adding these features to POS and FW n-grams leads to improvements in predicting a text’s author’s native language leads us to conclude that emotion characteristics from a native language are “imported” into the production of L2.
We analyzed misspellings for particular clues about an essay author’s native language: we identified misspelled cognates and L2-ed (here, anglicized) words and analyzed the information they provided separately and combined with other misspellings. Our experiments showed that all three phenomena provide useful information for identifying the native language of the author. An analysis of these phenomena at different levels showed that although the frequency of misspellings in general—and of L2-ed words—decreases with an increase in proficiency, as expected, their contribution to the NLI task remains strong for all levels. When combined, the results increase in most tested scenarios, showing that the L1 signal is boosted by considering all these phenomena together. We find it particularly interesting that L2-ed words are still frequent at the high proficiency level, showing that the impulse of using cognates is so strong that people make them when they are not available.
The analysis of the contribution of the targeted phenomena to the NLI task shows that explicitly analyzing linguistic phenomena that have the potential to interfere in second language production is beneficial from multiple perspectives, including understanding how to adjust materials for better second language acquisition and also building more robust NLI systems.