Implications
Knowledge of ruminal degradation kinetics of starch (ST) and protein is requisite for feed evaluation and maintenance of health and performance of dairy cows. Studies of the ruminal degradation of feeds are laborious and require analyses of a large number of samples. The calibrations presented in the present study simplify the analytical step of in situ studies. In addition, a basic approach is presented for easy and fast prediction of effective ruminal CP and ST degradation of cereal grains using NIRS without animal trials.
Introduction
Cereal and leguminous grains are widely used in ruminant rations. As ST is the main part of cereal grains and its degradation in the rumen can influence the performance and health of the animal, ruminal ST degradation is an important part of feed evaluation in ruminant nutrition (Plaizier et al., Reference Plaizier, Krause, Gozho and McBride2008). In addition to ST, CP is also quantitatively important to ruminant nutrition. Ruminal in situ incubations are often used to describe ST and CP degradation and to assess the nutritional value of feedstuffs for ruminants (Huhtanen and Sveinbjörnsson, Reference Huhtanen and Sveinbjörnsson2006). Applying in situ techniques and subsequent chemical analyses of undegraded feed after in situ incubation (‘bag residues’) after incubation impose substantial costs in terms of both money and time. To simplify the chemical characterisation of bag residues, the first objective of the present study was to develop calibrations for CP and ST concentrations in cereal and pea grains and their residues following ruminal in situ incubation.
Influenced by the principles of the ‘three Rs’, the European Commission issued directive 2010/63/EU on the protection of animals used for scientific purposes. On the basis of this, animal trials should be reduced and alternative methodologies implemented (European Commission, 2010). Various studies have shown the potential of near-infrared spectra (NIRS) in estimating feeding values for a number of feedstuffs for various animal species (Kitessa et al., Reference Kitessa, Flinn and Irish1999; Garnsworthy et al., Reference Garnsworthy, Wiseman and Fegeros2000). As the feeding value of genotypes of cereal species may vary (Seifried et al., Reference Seifried, Steingass, Hoffmann and Rodehutscord2016 and Reference Seifried, Steingass, Schipprack and Rodehutscord2017; Krieg et al., Reference Krieg, Seifried, Steingass and Rodehutscord2017a and Reference Krieg, Seifried, Steingass and Rodehutscord2017b), the feed industry and dairy farms would benefit from a calibration that enables ruminal degradation estimates, which are reliable enough for the evaluation of raw material. Therefore, the second objective of the present study was to calculate calibrations to predict the ruminal degradation characteristics of cereal grains from the NIRS of cereal grains.
Material and methods
Samples and incubations
The grains used in the present study consisted of 20 genotypes each of barley, maize, rye, triticale, and wheat and 13 pea samples. Durum wheat samples were also used and they consisted of five genotypes cultivated in three locations. Barley, maize, rye, triticale and wheat samples were part of the GrainUp project (Rodehutscord et al., Reference Rodehutscord, Rückert, Maurer, Schenkel, Schipprack, Bach Knudsen, Schollenberger, Laux, Eklund, Siegert and Mosenthin2016). The bag residues used to establish the calibrations were obtained by ruminal in situ incubations performed according to Seifried et al. (Reference Seifried, Steingass, Hoffmann and Rodehutscord2016 and Reference Seifried, Steingass, Schipprack and Rodehutscord2017) and Krieg et al. (Reference Krieg, Ziegeler, Steingass, Seifried, Longin and Rodehutscord2015, Reference Krieg, Seifried, Steingass and Rodehutscord2017a and Reference Krieg, Seifried, Steingass and Rodehutscord2017b), all of which used the same approach. The ground (2-mm sieve, cutting mill SM 100 comfort; Retsch GmbH, Haan, Germany) samples were ruminally incubated in three lactating Jersey cows over timespans of 1, 2, 4, 8, 16, 24, 48 and, in case of maize and durum wheat, 72 h. The total mixed ration, the animals received during the incubations differed slightly between the studies and consisted of ~40% concentrate, 20% maize silage, 20% hay, 15% grass silage and 1 to 3% of barley straw, rapeseed meal and a mineral mixture, each (on DM basis). Feed was available for ad libitum consumption. A more detailed methodological description is provided in the aforementioned publications. Before recording the NIRS and the chemical analyses, samples were pulverised (vibrating cup mill, PULVERISETTE; Fritsch GmbH, Idar-Oberstein, Germany).
Chemical reference analysis
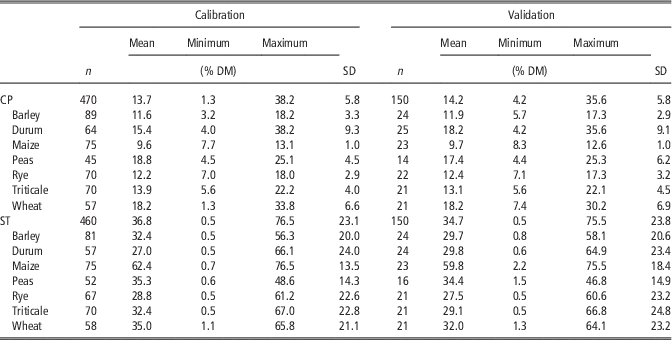
All feed samples and bag residues of at least four genotypes per species (barley: five) were chemically analysed for their CP and ST concentrations, leading to a total of n=620 samples for CP. Only 610 samples were used for the determination of the ST concentration because the bag residue of 10 samples was insufficient for recording of the NIRS and chemical ST analysis. The ST concentration of the 610 samples was determined using an enzymatic method (R-Biopharm AG, Darmstadt, Germany), as described by Seifried et al. (Reference Seifried, Steingass, Schipprack and Rodehutscord2016). The CP concentration of the 620 samples was determined after Kjeldahl as N×6.25 (Verband Deutscher Landwirtschaftlicher Untersuchungs- und Forschungsanstalten (VDLUFA), 2007, method 4.1.1). Chemical analyses were run in duplicate, if the residue after incubation was sufficient in size. The analysed range and the mean CP and ST concentrations are shown in Table 1. The concentrations of ether extract and fibre fractions of the grains are provided in Supplementary Table S1. The standard error of the laboratory (SEL) for the ST determination was calculated based on repeated measurements of a standard (wheat grain) on different days following Workman et al. (Reference Workman, Burns and Ciurczak2001):
 $${\rm SEL}\,{\equals}\,\left( {{{\left( {\sum^{M} _{{j\,{\equals}\,1}} \sum^{N} _{{i\,{\equals}\,1}} \left( {y_{{ij}} {\minus}\overline{y} _{j} } \right)^{2} } \right)} \mathord{\left/ {\vphantom {{\left( {\sum^{M} _{{j{\equals}1}} \sum^{N} _{{i{\equals}1}} \left( {y_{{ij}} {\minus}\overline{y} _{j} } \right)^{2} } \right)} {\left( {N\left( {r{\minus}1} \right)} \right)}}} \right. \kern-\nulldelimiterspace} {\left( {N\left( {r{\minus}1} \right)} \right)}}} \right)^{{0.5}} $$
where y
ij
is the ith replicate value of the jth sample,
$$\bar y_j $$
the mean of all replicates per sample, M the total number of replicates per sample, N the total number of samples and r the number of replicate analyses per sample. The SEL for the ST determination was 1.37% ST on a DM basis.
Number (n), mean, range and SD of chemically analysed CP and starch (ST) concentration of samples (feed and bag residues after in situ incubation) used for calibration development and validation

DM=dry matter.
For the CP concentration, the maximal value of 0.4% (on a DM basis), according to VDLUFA (2007, method 4.1.1), was used as a guide for the SEL.
Ruminal degradation kinetics
An exponential curve as suggested by Ørskov and McDonald (Reference Ørskov and McDonald1979) was fitted to the cumulative degradation of CP and ST observed after in situ incubations:
 $$y\,{\equals}\,a{\plus}b{\times}\left( {1{\!}-e^{{-c{\times}t}} } \right)$$
The washout fraction a represents the part of the sample that disappeared from the bag without incubation during the washing step, b describes the potentially degradable fraction, and the degradation rate c describes the rate at which the b fraction is degraded. From these degradation parameters, the effective degradability (ED) was estimated as:
 $${\rm ED}\,{\equals}\,a{\plus}((b{\times}c)/(c{\plus}k))$$
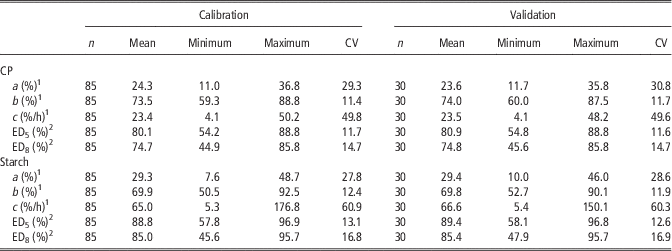
The ED was calculated for specific ruminal passage rates (k), of 5%/h (ED5) and 8%/h (ED8) for all 115 cereal grain samples. Data describing the ruminal degradation of the samples used for calibration and validation are given in Table 2.
Number (n), mean, range and CV (%) of in situ degradation parameters from six cereal grain species used for calibration and validation

Data from Seifried et al. (Reference Seifried, Steingass, Hoffmann and Rodehutscord2016 and Reference Seifried, Steingass, Schipprack and Rodehutscord2017), Krieg et al. (2015, 2017a and 2017b).
1 From equation (2), with a=washout fraction; b=potentially degradable fraction; c=degradation rate.
2 From equation (3), ED k =effective degradation at a passage rate of k=5% or 8%/h, respectively.
Spectra and calibrations
Spectra of all samples were recorded in duplicate using ringcups with inlays for small sample sizes from 680 to 2500 nm (SpectraStar 2500X, Software: Unity InfoStar Version 3.11.1; Unity Scientific, Brookfield, CT, USA). The spectra of an internal standard and external standards (US-STDS-0001 – STD, Wavelength cert, R99 and US-STDS-0003 – STD, Wavelength cert, R99/Poly; Unity Scientific) were recorded and controlled continuously. Treatments of the spectra and calibrations were computed using the software Ucalibrate (Version: 3.0.0.23; Unity Scientific). Before the calibrations, the spectra were averaged per sample and the averaged spectrum of every sample was used for further calculations. Samples were split into a calibration and a validation set for every grain species and every estimated variable (see Tables 1 and 2), attempting to include the whole range of values in both sets. Before the calibrations were calculated, the spectra were mathematically pretreated using standard normal variates and detrending. Derivations were calculated using the default setting for the derivation gap (8) and smoothing (8). The derivation option varied between no derivation and first- or second-order derivation.
The wavelengths of segments were: (1) the complete spectrum (680 to 2500 nm); (2) the spectrum constricted for 50 nm from the beginning and the end of the recorded spectrum (730 to 2450 nm); and (3) the wavelength segment of 1250 to 2450 nm. Wavelength segment (2) was used to eliminate the risk of drifts near the limit of the detectors. Segment (3) was selected based on values reported in literature and information given by the manufacturer to include most N–H and C–H bonds. Every wavelength segment was combined with every derivation. Calibrations were computed by partial least squares regression. Cross-validation was conducted, depending on the number of samples, with five (CP and ST concentrations) or six (degradation parameters) groups. Outliers were excluded from the calibration at the T-limit of 2.5 (predicted v. reference value). To include a broad range of spectra, the global distance limit was set to a value of 13.
The calibrations were evaluated using the standard error of calibration, standard error of cross-validation (SECV) and standard error of prediction (SEP). The SEP was a measure for the accuracy of the calibration (Bellon-Maurel et al., Reference Bellon-Maurel, Fernandez-Ahumada, Palagos, Roger and McBratney2010). A twofold SEL was used as the upper limit for the SEP (Tillmann, Reference Tillmann1996). Besides the error measurements, the R 2 values between the predicted and reference values of every step were used to evaluate the calibrations. As the evaluation of error depends on the variation in the reference values, the ratio of the interquartile distance of the validation samples to the SEP (RPIQ) (Bellon-Maurel et al., Reference Bellon-Maurel, Fernandez-Ahumada, Palagos, Roger and McBratney2010) and the ratio of the standard deviation of validation samples to the SEP (RPD) (Williams and Norris, Reference Williams and Norris1987) were calculated. With increasing RPIQ and/or RPD, the calibration was assumed to show better performance. Other characteristics used to evaluate the performance of the calibrations were the bias, the intercept and the slope of the validation. The target value for the bias and the intercept were 0, and 1 for the slope.
Statistics
In situ degradation parameters for CP and ST calculated from chemically analysed concentrations were compared with the corresponding values calculated from NIRS predicted concentrations (three animals per genotype; four genotypes per grain species). The comparisons were performed using PROC MIXED and pairwise t-tests using version 9.3 of the SAS system for Windows (Copyright© 2011; SAS Institute Inc., Cary, NC, USA). The model was y=µ+method i +sample j +method i ×sample j +e i,j . The animal used for incubation was added as a random effect. All statistical tests were performed at a level of significance of α=0.05.
Results
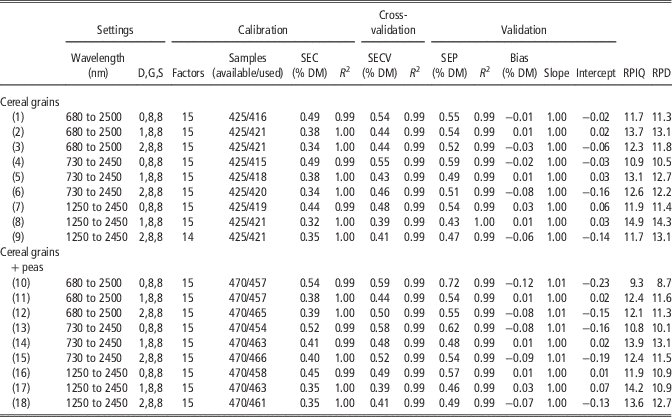
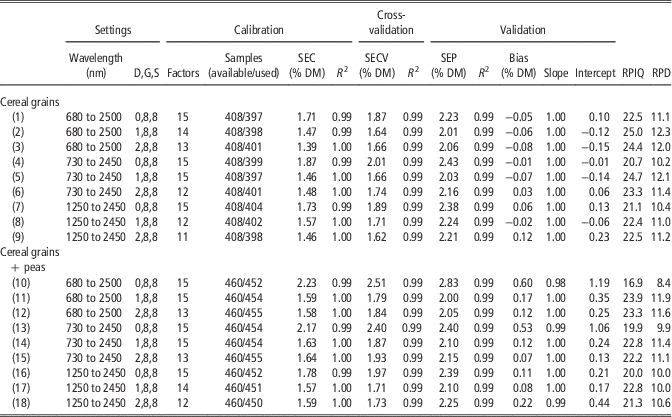
Variation in the calibration and validation data sets was equivalent for every variable (Tables 1 and 2). The coefficient of variation differed slightly between the calibration and validation data set for ruminal degradation parameters. The calibrations developed to predict the CP and ST concentration of the grains and their residues after in situ incubation are shown in Tables 3 and 4, respectively. Overall, the calibrations estimating the CP concentration exhibited lower SEP than did the calibrations estimating ST concentration. For both constituents, the best calibration in terms of the SEP, R 2 of the validation, and validation bias was obtained using the first derivation of the spectra in the wavelength segment from 1250 to 2450 nm. This applied to the calibrations based only on cereal grains (calibration (8) in Tables 3 and 4), as well as the calibrations based on cereal grains and peas (calibration (17) in Tables 3 and 4). For CP and ST calibrations (cereal grains and peas) without derivate treatment of the spectra, the SEP was higher, independent of the wavelength segment, and R 2 was lower than that of calibrations based on mathematically treated spectra.
Performance of different calibrations for estimating the CP concentrationFootnote 1 of cereal grains and peas and their bag residues after in situ incubation; cross-validation groups: 5

D,G,S=derivation, gap, smooth; R 2=squared correlation coefficient; SEC=standard error of calibration; DM=dry matter; SECV=standard error of cross-validation; SEP=standard error of prediction; RPIQ=ratio of the interquartile distance of the validation samples to the SEP; RPD=ratio of the standard deviation of the validation samples to the SEP.
1 Determined according to VDLUFA (2007, method 4.1.1) (N×6.25).
Performance of different calibrations for estimating the starch concentrationFootnote 1 of cereal grains and peas and their bag residues after in situ incubation; cross-validation groups: 5

D,G,S=derivation, gap, smooth; R 2=squared correlation coefficient; SEC=standard error of calibration; DM=dry matter; SECV=standard error of cross-validation; SEP=standard error of prediction; RPIQ=ratio of the interquartile distance of the validation samples to the SEP; RPD=ratio of the standard deviation of the validation samples to the SEP.
1 Measured using an enzymatic determination kit (R-Biopharm AG).
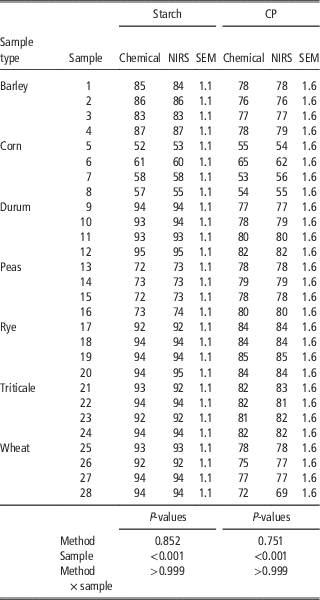
The ED calculated from either CP and ST predicted from NIRS (calibration (17) in Tables 3 and 4) or chemically analysed CP and ST concentrations of the samples are shown in Table 5. The method used for the determination of CP and ST had no significant influence on the calculated ED of the grain samples. The highest numeric difference between chemically derived and NIRS-based calculations for ED was 3% for CP (wheat, sample 28) and 2% for ST (peas, sample 15).
Comparison of the effective ruminal in situ degradation (%) of CP and starch at a passage rate of 8%/h for cereal grains and peas with nutrient concentration of feeds and bag residues either estimated by chemical analysis or by NIRS (lsmeans, n=3 replicates per sample)

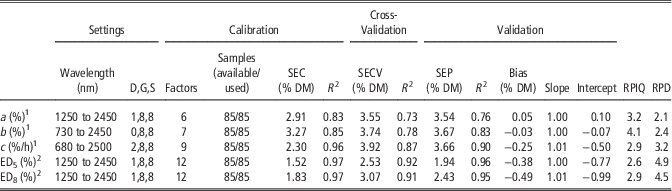
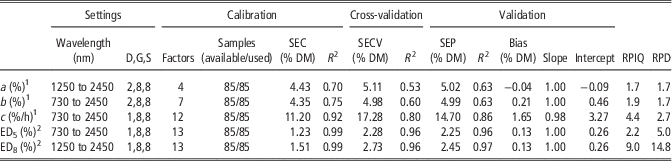
Performance of calibrations developed to estimate ruminal degradation parameters directly from the spectra of the grains is described in Tables 6 and 7. The calibrations for the estimation of ruminal degradation parameters had a lower R 2 Validation and higher SEP value than that of the calibrations that were computed to estimate the ED of CP and ST. The calibration for the ED of ST had a higher R 2 Validation than that of the calibration used to predict the ED of CP. The SEP of the calibration for the ED of ST was higher than that of the ED of CP.
Performance of calibrations for ruminal in situ degradation kinetics of CP from cereal grains

Selection by the R 2 of validation, SEP, RPIQ and the bias of the validation; cross-validation groups: 6.
D,G,S=derivation, gap, smooth; R 2=squared correlation coefficient; SEC=standard error of calibration; DM=dry matter; SECV=standard error of cross-validation; SEP=standard error of prediction; RPIQ=ratio of the interquartile distance of the validation samples to the SEP; RPD=ratio of the standard deviation of the validation samples to the SEP.
1 From equation (2), with a=washout fraction; b=potentially degradable fraction; c=degradation rate.
2 From equation (3), ED k =effective degradation at a passage rate of k=5% or 8%/h, respectively.
Performance of calibrations for ruminal in situ degradation kinetics of starch from cereal grains

Selection by the R 2 of validation, SEP, RPIQ and the bias of the validation; cross-validation groups: 6.
D,G,S=derivation, gap, smooth; R 2=squared correlation coefficient; SEC=standard error of calibration; DM=dry matter; SECV=standard error of cross-validation; SEP=standard error of prediction; RPIQ=ratio of the interquartile distance of the validation samples to the SEP; RPD=ratio of the standard deviation of the validation samples to the SEP.
1 From equation (2), with a=washout fraction; b=potentially degradable fraction; c=degradation rate.
2 From equation (3), ED k =effective degradation at a passage rate of k=5% or 8%/h, respectively.
Discussion
Estimation of CP and starch concentrations
In the present study, NIR calibrations that could be used as alternatives to chemical CP and ST analysis in in situ studies were developed. The ED based on NIRS-estimated CP and ST concentrations (using the calibration (17) in Tables 3 and 4) did not differ from values calculated from chemical analyses. The numeric differences between the two approaches were negligible. This together with the high R 2 Validation in combination with the relatively low SEP values revealed that NIRS can be used as a fast alternative to chemical analyses in in situ studies.
Although calibrations for CP and ST showed good results, the best-fit CP calibration (number (17), Table 3) exhibited better performance than did the best ST calibration (number (17), Table 4). In addition to the distribution of reference values, this could have been caused by various factors. First, the chemical method to determine the ST concentration had a higher SEL than that of the CP determination, which could lead to a higher error of the calibration. Another reason could be the higher variability in the chemical structure of ST. As NIRS estimations are based on the absorption of energy by atomic bonds, CP with its characteristic molecular structure (N–H bonds) could be predicted with higher precision than a more chemically unspecific variable like ST (mainly C–H and C–O–H bonds). Kovalenko et al. (Reference Kovalenko, Rippke and Hurburgh2006) hypothesised that correlations between the estimated variables could lead to an indirect estimation of one variable through the absorption caused by the other variable. Chemically determined CP and ST concentrations were negatively correlated in (non-incubated) cereal grains (r=−0.42; P<0.001). The interaction of ST with the protein matrix might also have led to interference between the absorption bands of CP and ST (Garnsworthy et al., Reference Garnsworthy, Wiseman and Fegeros2000). The main wavelength described in the literature that was used for protein estimation in wheat flour is 2180 nm. Wheat ST showed a broad, partly overlapping absorption band at 2100 nm (Osborne, Reference Osborne2008). Osborne (Reference Osborne2008) noted that based on the negative correlation and the possible overlap of the bands, both wavelengths were often included in ST, as well as in protein calibrations. This supports the theory, at least in part, that indirect prediction of ST can be made using the CP concentration.
Starch and N (CP/6.25) concentration of in situ bag residues have been estimated by NIRS, but the performance of the calibration was not defined (Garnsworthy and Wiseman, Reference Garnsworthy and Wiseman2000). Compared with other calibrations used to estimate the CP concentration in feedstuff or cereal grains, the R 2 of the validation in the present study was high for all calibrations (Bruno-Soares et al., Reference Bruno-Soares, Murray, Paterson and Abreu1998; Garnsworthy et al., Reference Garnsworthy, Wiseman and Fegeros2000; Xiccato et al., Reference Xiccato, Trocino, De Boever, Maertens, Carabaño, Pascual, Perez, Gidenne and Falcao-E-Cunha2003; Lin et al., Reference Lin, Chen, Jian, Shi, Jin and Zhang2014). In the present study, the lowest SEP values for CP were 0.43% and 0.47% DM without and including pea samples, respectively. These values were higher than the SEP described by Lin et al. (Reference Lin, Chen, Jian, Shi, Jin and Zhang2014) for a calibration to predict the CP concentration in barley grains (SEP=0.23% DM). Garnsworthy et al. (Reference Garnsworthy, Wiseman and Fegeros2000) found higher errors in the estimation of the CP concentration in wheat grains (SECV=5.01 g/kg DM) than in the present study. In other matrices, for example, compound feeds (Xiccato et al., Reference Xiccato, Trocino, De Boever, Maertens, Carabaño, Pascual, Perez, Gidenne and Falcao-E-Cunha2003) or green crop cereals (Bruno-Soares et al., Reference Bruno-Soares, Murray, Paterson and Abreu1998), the SEP for CP calibrations was also higher than in the present study. All CP calibrations in the present study exhibited a SEP that was less than two times the SEL (0.4% DM). The slight increase in the SEP from calibrations based on cereal grains to calibrations based on cereal grains and peas indicated the applicability of the established NIRS calibrations to other concentrate feedstuffs in addition to cereal grains.
No calibration for such a wide range of enzymatically analysed ST concentrations as conducted in the present study was found in literature. Jancewicz et al. (Reference Jancewicz, Penner, Swift, McKinnon, Waldner and McAllister2016) established calibrations with a comparable variation in ST concentration (0.2% to 53.0% DM), but found a higher SEP and lower R 2 Validation than in the present study. This might have been caused by the more complex composition of faeces samples in the study of Jancewicz et al. (Reference Jancewicz, Penner, Swift, McKinnon, Waldner and McAllister2016) compared with the residues used in the present study. Compared with calibrations for other sample matrices and concentration segments, the ST calibration established in the present study exhibited higher error measurements but also had a high R 2 Validation (e.g. Kim and Williams, Reference Kim and Williams1990; Garnsworthy et al., Reference Garnsworthy, Wiseman and Fegeros2000; Xiccato et al., Reference Xiccato, Trocino, De Boever, Maertens, Carabaño, Pascual, Perez, Gidenne and Falcao-E-Cunha2003). The relatively wide range of CP and ST concentrations might have caused the higher error measurement and R 2 in the present study (Bellon-Maurel et al., Reference Bellon-Maurel, Fernandez-Ahumada, Palagos, Roger and McBratney2010), compared with studies with a smaller range in CP and ST concentrations. A higher error of the laboratory could also be the cause for higher error measurements. If the limit of twofold the SEL for SEP, as suggested by Tillmann (Reference Tillmann1996), was used to evaluate the calibrations, only calibration (10) in Table 4 would exceed this limitation.
Despite the favourable performance of the calibrations, a number of samples were excluded from the calibrations based on the outlier test. Samples with sufficient mass to repeat the chemical measurements were analysed again. The repeated analyses showed that the exclusion was caused by analytical errors. Thus, NIRS may also be used as a tool to identify analytical errors. Therefore, samples with insufficient residue for repeated analyses and a significant outlier test were excluded from the calibration.
Ruminal degradation
In the present study, calibrations that enabled an estimation of the ruminal ED of CP and ST from spectral NIR data of cereal grains were also developed. The calibrations for the ED of CP and ST had an R 2 Validation of 0.96 or higher and moderate error measurements. Foskolos et al. (Reference Foskolos, Calsamiglia, Chrenková, Weisbjerg and Albanell2015) used calibrations to estimate the ED of CP for various non-forage feedstuffs with an R 2 Validation of 0.81. The corresponding SEP was 5% DM. Compared with our results, the higher SEP for the calibrations of Foskolos et al. (Reference Foskolos, Calsamiglia, Chrenková, Weisbjerg and Albanell2015) were probably caused by the higher variation in the validation set and the higher variability in the sample origin.
An estimation of degradation parameters followed by the calculation of the ED from the estimates was also considered. This approach would allow for the calculation of the ED for different passage rates, without the need for additional calibrations. In addition to the relatively high error of the calibrations for single degradation parameters, the calibration for the c value of ST led to negative values for two samples (data not shown). Hence, the approach of calculating the ED from estimated degradation parameters was not pursued further with the present dataset, but should be considered in future studies.
Although the results of the present study exhibited the potential that estimation of the ED of cereal grains by using NIRS is possible, the calibrations did not contain sufficient samples to allow their practical use. However, the results are promising and should be interpreted to expand the data set for calibration in order to improve the predictions, as indicated by Sapienza et al. (Reference Sapienza, Berzaghi, Martin, Taysom, Owens, Mahanna, Sevenich and Allen2008). Based on the performance of the calibrations for ED computed in the present study, a successful expansion of the calibrations appears realisable. The in situ method is relatively fast, especially when NIRS is used to predict the ST and CP concentration of the residues. Hence, the future expansion of the calibrations for ST-rich feedstuffs would be easily manageable and its adaptation to new concentrate feedstuffs should be possible.
Because of the frequently incomplete description of NIRS calibrations in the literature, Dardenne (Reference Dardenne2009) proposed a standard layout for summary tables to describe calibrations. On the basis of this proposal, the calibrations with the best performance in predicting the concentration and ED of CP and ST are described in Supplementary Table S2. The RPD is a commonly used variable to describe the performance of calibrations, but was omitted from this table. It is calculated using the standard deviation of the validation samples. As a necessary condition, data must follow a Gaussian distribution if the RPD is used to compare calibrations. In the present study, CP and ST concentrations did not follow a Gaussian distribution (CP: positive skew; ST: β-distribution). In addition, in very large, normally distributed populations, the RPD is connected to R 2 by RPD=(1−R 2)0.5 (Bellon-Maurel et al., Reference Bellon-Maurel, Fernandez-Ahumada, Palagos, Roger and McBratney2010; Minasny and McBratney, Reference Minasny and McBratney2013). However, Dardenne (Reference Dardenne2009) described the RPD as more discriminant than R 2 when a R 2 near 1 is reached. On the basis of these considerations, in the present study, the RPD would be mathematically incorrect and in large, normally distributed populations redundant. The RPIQ uses the interquartile distance and is less sensitive to changes in the sample distribution. Nonetheless, the RPD and the RPIQ are given in Tables 3, 4, 6, and 7 to demonstrate differences in the ranking of calibrations between these measures. The only variable with the same RPD and RPIQ was the a-fraction of ST. The a-fraction of ST was the only data set with a Gaussian distribution. The SEP is also influenced by the distribution of samples. Normally distributed validation data sets lead to a lower SEP than values from a skewed distribution (Bellon-Maurel et al., Reference Bellon-Maurel, Fernandez-Ahumada, Palagos, Roger and McBratney2010). As the samples in the current study were distributed differently, distribution should be considered when the performance of calibrations is compared.
The calibrations presented in the present study simplified the analytical step of in situ studies without affecting the results. Furthermore, a basic approach to predict the ED of CP and ST of cereal grains by using NIRS and without animal trials has been developed.
Acknowledgements
This project was supported by funds from the Federal Ministry of Food and Agriculture (BMEL) based on a decision by the Parliament of the Federal Republic of Germany via the Federal Office for Agriculture and Food (BLE) under the innovation support program. J.K. was supported by a graduate scholarship granted by the state of Baden-Württemberg via the Faculty of Agricultural Sciences of Hohenheim University.
Supplementary Material
To view supplementary material for this article, please visit https://doi.org/10.1017/S1751731117001926