

Introduction
Epidemiological studies have shown that low weight at birth, slow infant weight gain and rapid childhood weight and Body mass index (BMI) gain are associated with high risks for adult type 2 diabetes and cardiovascular disease (CVD).Reference Barker 1 – Reference Bhargava, Sachdev and Fall 4 Recent studies have shown that these associations between size at birthReference Bavdekar, Yajnik and Fall 5 , Reference Lawlor, Riddoch and Page 6 and post-natal growthReference Joglekar, Fall and Deshpande 7 and CVD risk markers are apparent even in children. Chronic maternal undernutrition reduces birthweight among Indian neonates,Reference Fall, Yajnik and Rao 8 and may underlie a characteristic Indian ‘muscle-thin but adipose (thin-fat)’ neonatal phenotype.Reference Yajnik, Fall and Coyaji 9 , Reference Krishnaveni, Hill and Veena 10 The recent rise in prevalence of type 2 diabetes and CVD in countries like India may be explained by this, and by a recent economic transition resulting in enhanced postnatal growth.Reference Yajnik 11 Few studies have explored the above associations using neonatal and childhood measurements other than weight and height.
In a prospective study (Parthenon study) established to examine the maternal and developmental influences on the risks of chronic diseases in the offspring, at the Holdsworth Memorial Hospital (HMH) in Mysore, India, detailed neonatal and postnatal anthropometry was performed in a large sample of children.Reference Krishnaveni, Hill and Veena 10 Maternal gestational diabetes (GDM) was a strong risk factor for adiposity, and altered glucose and insulin concentrations in the offspring at 5 and 9.5 years of age.Reference Krishnaveni, Hill and Leary 12 The present paper aims to investigate the relationships of birth anthropometry and postnatal growth to cardiovascular risk factors in all children at 9.5 years. We hypothesised that smaller birthweight and muscle size at birth, poorer linear and muscle growth in infancy, and greater post-natal weight and adipose tissue gain, especially after infancy, would be associated with increased risk factors 9.5 years.
Methods
Mysore Parthenon birth cohort (Fig. 1)
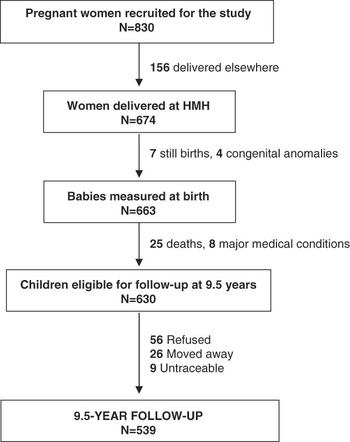
Between 1997 and 1998, we performed an oral glucose tolerance test (OGTT) in 830 women attending the antenatal clinics of the HMH, and meeting our eligibility criteria (gestational age 30 ± 2 weeks, singleton pregnancy, no known history of diabetes, plan to deliver at HMH); 49 women were diagnosed with GDM using the Carpenter–Coustan criteria.Reference Carpenter and Coustan 13 Six-hundred and seventy-four women delivered at HMH, and 663 of these were live, normal babies. Neonatal anthropometry was performed within 72-h of birth by one of the four trained measurers, using standardised techniques, including weight (Seca digital weighing scales, Germany), crown-heel length (Harpenden neonatal stadiometer, CMS instruments, London, UK), and mid-upper arm circumference (MUAC; blank tapes and ruler), and subscapular and triceps skinfold thickness measurements (Harpenden callipers, CMS instruments).
Flow diagram illustrating the study participation.

Postnatal follow-up
Excluding 25 deaths and eight children with major medical conditions, all available children were measured annually until 5 years of age, and six monthly thereafter. A 2-h OGTT was also performed in children at 5-year follow-up as described elsewhere,Reference Krishnaveni, Hill and Leary 12 and blood pressure (BP) and fasting lipid concentrations were measured. Fathers were considered diabetic if they were already known to have diabetes or if their fasting glucose concentration was ⩾7 mmol/l at the time of the children’s 5-year follow-up. Offspring of non-GDM mothers and non-diabetic fathers were considered as control children.
9.5-year follow-up
Five-hundred and thirty-nine children were available for follow-up at 9.5 years of age (35 offspring of diabetic mothers/ODM)). Detailed anthropometry was carried out in all children including the measurement of weight (Salter, Tonbridge, Kent, UK), height (Microtoise, CMS instruments), MUAC and waist circumference (anthropometric tape) and triceps and subscapular skinfold thickness measurements (Harpenden callipers, CMS instruments). Percentage body fat (fat%) was measured using bioimpedance (Bodystat, Quadscan 4000, Isle of Mann, UK).
Systolic and diastolic BP were measured in the left arm using an automatic BP monitor (Dinamap8100, Criticon, FL, USA), using appropriate-sized cuffs based on the MUAC. Measurers were standardised by regular intra- and inter-observer variation studies. The socio-economic status (SES) of the family was determined by the Standard of Living Index designed by the National Family Health Survey-2. 14
Plasma glucose and insulin concentrations were measured in all children from a 2-h OGTT after an overnight fast. An intravenous cannula was inserted after anaesthetising the skin with EMLA cream. Blood samples were collected for measurement of plasma glucose and insulin concentrations fasting, and 30 and 120 min after a 1.75 g/kg body weight load of anhydrous glucose in 150 ml of water. Fasting samples were used for measuring plasma cholesterol, triglyceride and HDL-cholesterol concentrations. Laboratory assays were carried out at the Diabetes Research Centre, KEM Hospital, Pune, India, whose laboratory is a member of the UK (National External Quality Assessment Service) quality control programme for insulin assays. Plasma glucose and lipid concentrations were measured on an autoanalyzer (Alcyon 300, Abbott laboratories, Abbott Park, IL, USA) by standard enzymatic methods. Insulin was measured using a time-resolved, fluoroimmunoassay (Delfia, Wallac QY, Turku, Finland). Inter-assay co-efficients of variations were 12.5% at <45 pmol/l, 9.6% at 45–90 pmol/l and 4.3% at >90 pmol/l.
The hospital ethical committee approved the study, and informed written consent was obtained from the parents and assent from children.
Statistical methods
Insulin resistance was estimated using the Homeostasis Model Assessment equation (HOMA).Reference Matthews, Hosker and Rudenski 15 Offspring BMI, skinfold measurements, insulin concentrations at all time-points and HOMA were log-transformed to satisfy assumptions of normality. Measurements at birth were adjusted to 40-weeks gestation using linear regression. The association between birth and postnatal size, and CVD risk factors was analysed using linear regression.
To examine associations between size at birth and risk factors at 9.5 years, we fitted four regression models as proposed by Lucas et al.Reference Lucas, Fewtrell and Cole 16 The first model included the child’s current weight as the independent variable, the second included the birth measurement, the third included both birth size and current weight and the fourth tested the interaction between these two variables. Sex differences were tested using interaction terms (sex × birth size) in regression models.
To examine associations with postnatal growth (changes in body size), we derived ‘conditional’ variables for each body measurement for the age intervals birth to 2 years (representing infant growth), 2–5 and 5–9.5 years. The anthropometric measurement at the end of a given interval was regressed on the measurement at the beginning of the interval and all earlier time points. These regression models were sex-specific, and included squared terms for the measurements at each age, to allow for non-linearity. The residuals were extracted (these represent the change in a particular measurement observed during each interval, over and above what would be expected given the child’s earlier size) and stored as s.d. scores to allow comparison of effects of growth at different ages. By construction, conditional s.d. scores for different age intervals are uncorrelated, allowing them to be included simultaneously in regression models, to identify associations between specific periods of post-natal growth and the outcome of interest.
Data were analysed using SPSS v 16 (SPSS Inc, Chicago, USA).
Results
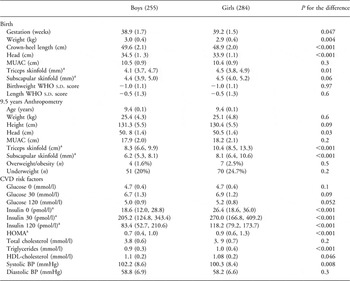
Table 1 describes the general characteristics of the boys and girls at birth and 9.5 years of age. Mysore newborns were shorter and lighter compared to WHO standards. Boys were larger than girls in all measurements at birth, except skinfold thickness. There were no statistically significant differences in mean birth measurements between those who took part in the study and those who did not (birthweight 2.99 kg v. 2.97, P = 0.7; length 49.2 cm v. 49.4, P = 0.5; MUAC 10.5 cm v. 10.4, P = 0.4; subscapular skinfolds 4.4 mm v. 4.5, P = 0.6).
Characteristics of the study children at birth, and at 9.5 years

MUAC, mid-upper arm circumference; BP, blood pressure.
aMean (s.d.) or Median (inter quartile range).
At 9.5 years of age, girls had greater skinfold thickness compared to boys. The prevalence of obesity/overweight according to the International Obesity Task Force cut-offReference Cole, Bellizzi, Flegal and Dietz 17 was 2% (n = 11); 22.4% (121) of the children were underweight (BMI ⩽ 2 s.d. of the WHO reference 18 ). Glucose concentrations at 120-min, insulin concentrations at 0, 30 and 120 min, HOMA insulin resistance, HDL cholesterol and triglyceride concentrations were significantly higher in girls; boys had higher systolic BP than girls. The SES of the family was a significant positive predictor of current anthropometric measurements (skinfolds: P < 0.05, others: P < 0.001).
Current weight was positively associated with 120-min glucose concentrations (P = 0.02), fasting, 30-min and 120-min insulin concentrations, HOMA, systolic BP (P < 0.001), diastolic BP (P = 0.03) and fasting triglyceride concentrations (P = 0.052; all adjusted for age and sex). Associations were similar in boys and girls. Positive associations were also observed between other anthropometric measurements including height, MUAC and skinfold measurements, and metabolic outcomes at 9.5 years. Greater subscapular skinfold thickness was additionally associated with higher 30-min glucose concentrations (P = 0.03), and total cholesterol concentrations (P = 0.051).
Birth size and adiposity and CVD risk factors at 9.5 years
Birthweight was positively correlated with weight (r = 0.32), height (r = 28), MUAC (r = 0.23), head circumference (r = 0.35), triceps and subscapular skinfolds (r = 0.15, P < 0.001; adjusted for age and sex) at 9.5 years.
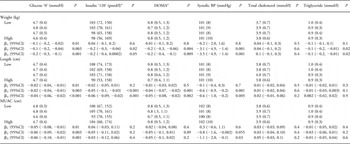
Lower weight, shorter length and smaller MUAC at birth were associated with higher fasting glucose concentrations at 9.5 years of age (P = 0.01 adjusted for age and sex; Table 2). There were no other direct associations between measures of size at birth and cardiovascular risk factors.
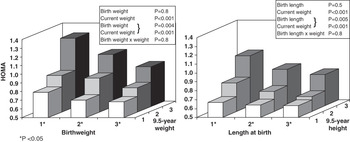
After adjusting for current weight, there were inverse associations between birthweight, and birth length and risk factors (Table 2), including insulin concentrations at 0, 30 and 120 min, HOMA, and systolic BP. Lower birthweight was also associated with higher diastolic BP and triglyceride concentrations. The associations were stronger when the analyses were restricted to control children and offspring of diabetic parents were excluded (Table 2). The values, particularly for HOMA, tended to be higher in children who were in the lowest thirds of weight or length at birth, and in the highest thirds of weight/height at 9.5 years of age (Fig. 2). However, there were no interactions between birth size and current weight for any of the risk factors, and no evidence of sex differences in the associations described.
Risk outcomes at 9.5 years according to fourths of weight, length and MUAC at birth. Values given are mean (s.d.) or geometric meanFootnote a (inter quartile range) and regression co-efficients (95% CI)

MUAC, mid-upper arm circumference.
a Logged variable: β1, regression co-efficients adjusted for sex and age; β2, regression co-efficients adjusted for sex, age and body weight at 9.5 years; β3, regression co-efficients after excluding offspring of diabetic parents and adjusted for sex, age and body weight at 9.5 years.
Insulin resistance (HOMA) in children of Mysore according to thirds of weight and length at birth and current weight or height (P adjusted for age and sex).

Postnatal growth and CVD risk factors at 9.5 years
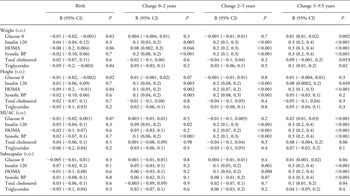
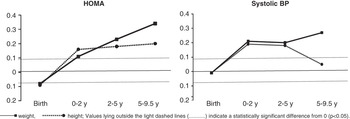
Greater conditional gain in weight and height in infancy (0–2 years) was associated with higher insulin concentrations, HOMA and systolic BP (Table 3; Fig. 3). A greater increase in MUAC during this period was associated with higher systolic BP. Greater gain in weight, height, MUAC and subscapular skinfolds at 2–5 and 5–9.5 years of age was positively associated with the same risk outcomes. Greater increase in weight, MUAC and subscapular skinfold thickness between 5 and 9.5 years was also related to higher fasting and 120-min glucose concentrations. Postnatal increase in weight and MUAC between 5 and 9.5 years was associated with higher diastolic BP. There were no differences in association between boys and girls.
Multiple linear regression analyses using conditional s.d.-scores for weight, height, MUAC and subscapular skinfolds from birth-9.5 years to predict risk outcomes (s.d.) at 9.5 years of age

MUAC, mid-upper arm circumference; BP, blood pressure.
For all measurements, s.d. scores for birth measurements and conditional s.d. scores for postnatal change in size at birth to 2 years, 2–5 years and 5–9.5 years were included simultaneously in the regression models.
Mean and 95% confidence intervals for s.d. change in HOMA and systolic blood pressure (BP) at 9.5 years per s.d. increase in conditional growth in weight between 0–2, 2–5 and 5–9.5 years.

Discussion
In this large birth cohort of 9.5-year-old children in India, smaller birth size (birthweight, length and MUAC) was related to higher fasting glucose concentrations. After adjusting for current weight, lower weight and length at birth were associated with higher insulin resistance and systolic BP. Faster conditional weight and length growth during infancy was associated with higher 9.5-year insulin resistance and blood pressure. Faster conditional weight, height, MUAC and skinfold growth after infancy were associated with an increase in almost all risk factors at 9.5 years.
This study has several strengths. Detailed neonatal anthropometry available for all children enabled assessment of the effects of different components of body weight on the risk factors. The children were regularly measured, using standardized techniques, which allowed determination of associations of different stages of postnatal growth with later risk factors. The mothers’ glucose tolerance status during pregnancy and the fathers’ diabetes status were known for the majority of the children, thus we were able to examine associations with birth size in control children without intra-uterine exposure to gestational diabetes or a family history of diabetes. A limitation of the study was that about 14% of the eligible children were lost to follow-up, which could have introduced selection bias. However, birth measurements were similar in children who participated in the study and in those lost to follow-up.
As shown in a number of studies in children,Reference Kelishadi 19 larger current size was a strong determinant of cardiovascular risk markers at 9.5 years. These associations were particularly strong with the indicators of body fat such as weight, BMI and subcutaneous skinfolds, but were also seen even with height. Smaller weight, length and MUAC at birth were associated with higher fasting glucose concentrations. These associations remained significant after adjusting for current weight. After adjusting for current weight, birthweight and length were inversely associated with insulin concentrations, HOMA and systolic blood pressure. However, there was no significant interaction between birth size and current weight for any of these outcomes. These findings are consistent with earlier studies of children in IndiaReference Bavdekar, Yajnik and Fall 5 and other parts of the world,Reference Whincup, Kaye and Owen 2 , Reference Huxley, Owen and Whincup 3 though a recent study in Pune, India did not show an association with birth size in a rural cohort.Reference Joglekar, Fall and Deshpande 7
Most of the inverse associations seen between birth size and risk outcomes were apparent only after adjusting for current weight. Different researchers have interpreted this phenomenon in different ways. Birth size is positively related to current size, which, in turn, is positively related to current risk factors. Failure to adjust for current size may therefore mask any ‘programming’ effect of small size at birth. One interpretation of our findings is that, given equal current size, children of smaller birth size have higher risk factors. Others have suggested that adjusting for current size may artificially produce an inverse association with birth size.Reference Lucas, Fewtrell and Cole 16 , Reference Huxley, Neils and Collins 20 , Reference Tu, West, Ellison and Gilthorpe 21 Lucas et al.Reference Lucas, Fewtrell and Cole 16 proposed three regression models to interpret the birth size association with risk outcomes; they suggested that an effect of small birth size can be deduced only if there is an association without adjustment for current size, whereas, an inverse association with birth size after adjusting for current weight would imply an effect of post-natal growth on the risk outcome. An interaction between birth size and current size would suggest that birth size modifies the association between post-natal growth and the outcome. Using these models, we observed an inverse association, without adjustment for current size, between birthweight, length and MUAC at birth and fasting glucose concentrations, but not for the other risk factors. We did not, however, find any significant interaction between birth size and current size for risk outcomes. Thus, we can say that there was evidence of an effect of poor intra-uterine growth on fasting glucose, consistent with the thrifty phenotype hypothesis, which proposes that nutritional insults experienced during critical stages of growth in utero permanently programme the foetus, predisposing such individuals to type 2 diabetes.Reference Hales and Barker 22
Our conditional growth analysis indicated significant effects of post-natal growth, of both weight and height and of MUAC and subscapular skinfold thickness on risk markers. Our study is one of few to report childhood CVD risk markers in association with the detailed postnatal anthropometry. There is debate about the effect of growth at different time points on risk outcomes. Earlier studies in the west have shown that smaller size during infancy is associated with an increased risk of adult CVD and type 2 diabetes.Reference Barker and Fall 23 Other studies have shown that rapid infant growth is disadvantageous in terms of subsequent CVD risks.Reference Singhal and Lucas 24 , Reference Ekelund, Ong and Linné 25 A study in New Delhi in India observed that individuals who developed type 2 diabetes and glucose intolerance as young adults were thinner during infancy, but had accelerated childhood weight or BMI gain.Reference Bhargava, Sachdev and Fall 4 In the same setting, accelerated infant weight or BMI gain was associated with higher prevalence of metabolic syndrome.Reference Fall, Sachdev and Osmond 26 In Pune, infant weight gain and linear growth was largely unrelated to CVD risk factors at 6 years, whereas there were strong positive associations with post-infancy weight gain and growth.Reference Joglekar, Fall and Deshpande 7 The relevance of infant weight gain and growth to later CVD risk is important in policy terms, because increasing emphasis is now being placed on promoting better nutrition during infancy in order to prevent stunting.Reference Uauy, Kain, Mericq, Rojas and Corvalán 27 In our study, faster infant weight gain, and also linear growth (0–2) as well as increased weight gain and linear growth post-infancy, were related to higher insulin concentrations, HOMA and systolic BP at 9.5 years. Future follow-up may reveal whether elevated risk markers associated with infancy and/or childhood growth are relevant to the development of adult disease. As infant growth is very important in terms of short-term survival of babies and their neuro-cognitive development, especially in countries like India, it may be important to promote growth.Reference Adair, Martorell and Stein 28
In conclusion, our study provides evidence that smaller size at birth makes a contribution to later risk of diabetes. Accelerated weight gain, and also faster linear growth, during infancy as well as early childhood, is associated with higher cardiovascular risk factors in mid-late childhood.
Acknowledgements
We are grateful to the families, who participated, and the paediatric consultants. We thank Jayakumar, Geetha, Chachyamma, Saroja, Kiran, Nalinakshi, Stephen, Rumana, Jane Pearce and Patsy Coakley for their contributions and Sneha-India for its support. We thank Dr C. S. Yajnik and staff (KEM Hospital, Pune) for biochemical assays. The study was funded by the Parthenon Trust, Switzerland, the Wellcome Trust, UK and the Medical Research Council, UK.
Statement of Interest
None.