Introduction
Most of the accumulation area of temperate glaciers is taken up by the wet-snow zone, defined as an area where all the snow deposited since the end of the previous summer has been raised to a temperature of 0°C by the end of the summer (Paterson, 1994). In this zone, the snow is rapidly transformed into firn by repeated melting and refreezing processes near the snow surface. Densification in the presence of liquid water is the predominant transformational process from firn to ice in the deeper firn layer, because no temperature gradient and no heat transfer exist. Since liquid water can weaken the mechanical strength of snow, and the densification of snow is accelerated by the existence of liquid water within snow (Wakahama, 1975), the depth and age of firn–ice transition found in temperate glaciers are known to be much smaller than those in polar ice sheets free from melting (Benson, 1962). However, until now most quantitative investigations of the densification process have been concerned with polar firn, because of insufficient data on the internal structure of temperate glaciers and the difficulty in recreating the conditions existing in the wet-snow zone for a long time experimentally.
Recently, after the development of a drill system, many drillings were carried out to the depth of ice body in the wet-snow zone of temperate glaciers. As a result, the water-saturated firn layer, which occurs where the vertical percolation of meltwater is interrupted just above the firn-ice transition, has been found in many temperate glaciers and perennial snow patches throughout the world (Sharp, 1951b; Vallon and others, 1976; Ambach and others, 1978; Oeschger and others, 1978; Akbarov and others, 1980; Oerter and Moser, 1982; Yamada, 1987; Fountain, 1989; Kameda and others, 1993; Kawashima and others, 1993; Schneider, 1994). This layer is often called “firn aquifer”, and the presence of aquifer is believed to be a common feature of temperate glaciers. Aquifers are formed in the early ablation period, and almost completely disappear at the beginning of the accumulation period. It was observed that the transformation of firn into ice happened almost entirely in summer, when the firn aquifer existed (Vallon and others, 1976). A discontinuity in the density profile was found at the level of the water table, resulting in the shift in firn density from 650kg m–3 to 750 kg m–3 or more (Kawashima and others, 1993). It is obvious from the above facts that the firn aquifer accelerates the transformation from firn to ice. Nevertheless, how much time is required for transformation into ice in the firn aquifer is still unknown, because the densification rate of water-saturated firn and its pressure dependence have not been sufficiently clarified.
To obtain an empirical relationship between densification rate of water-saturated firn and time/pressure applicable to the firn aquifer, and to discuss mechanisms controlling the depth of firn–ice transition in the wet-snow zone, compression tests of water-saturated firn were conducted in a cold room. In this paper, the term “density” means the ice mass per unit volume, namely the dry density excluding liquid mass.
Previous Work
Early compression experiments on water-saturated snow were done by Kinosita (1963) and Wakahama (1965). They carried out unconfined compression tests at pressures of less than 0.06 MPa and pointed out that snow containing liquid water can deform more rapidly than dry snow. The compactive viscosity coefficient of water-saturated snow with densities of 300–500 kg m–3 was found to be three orders of
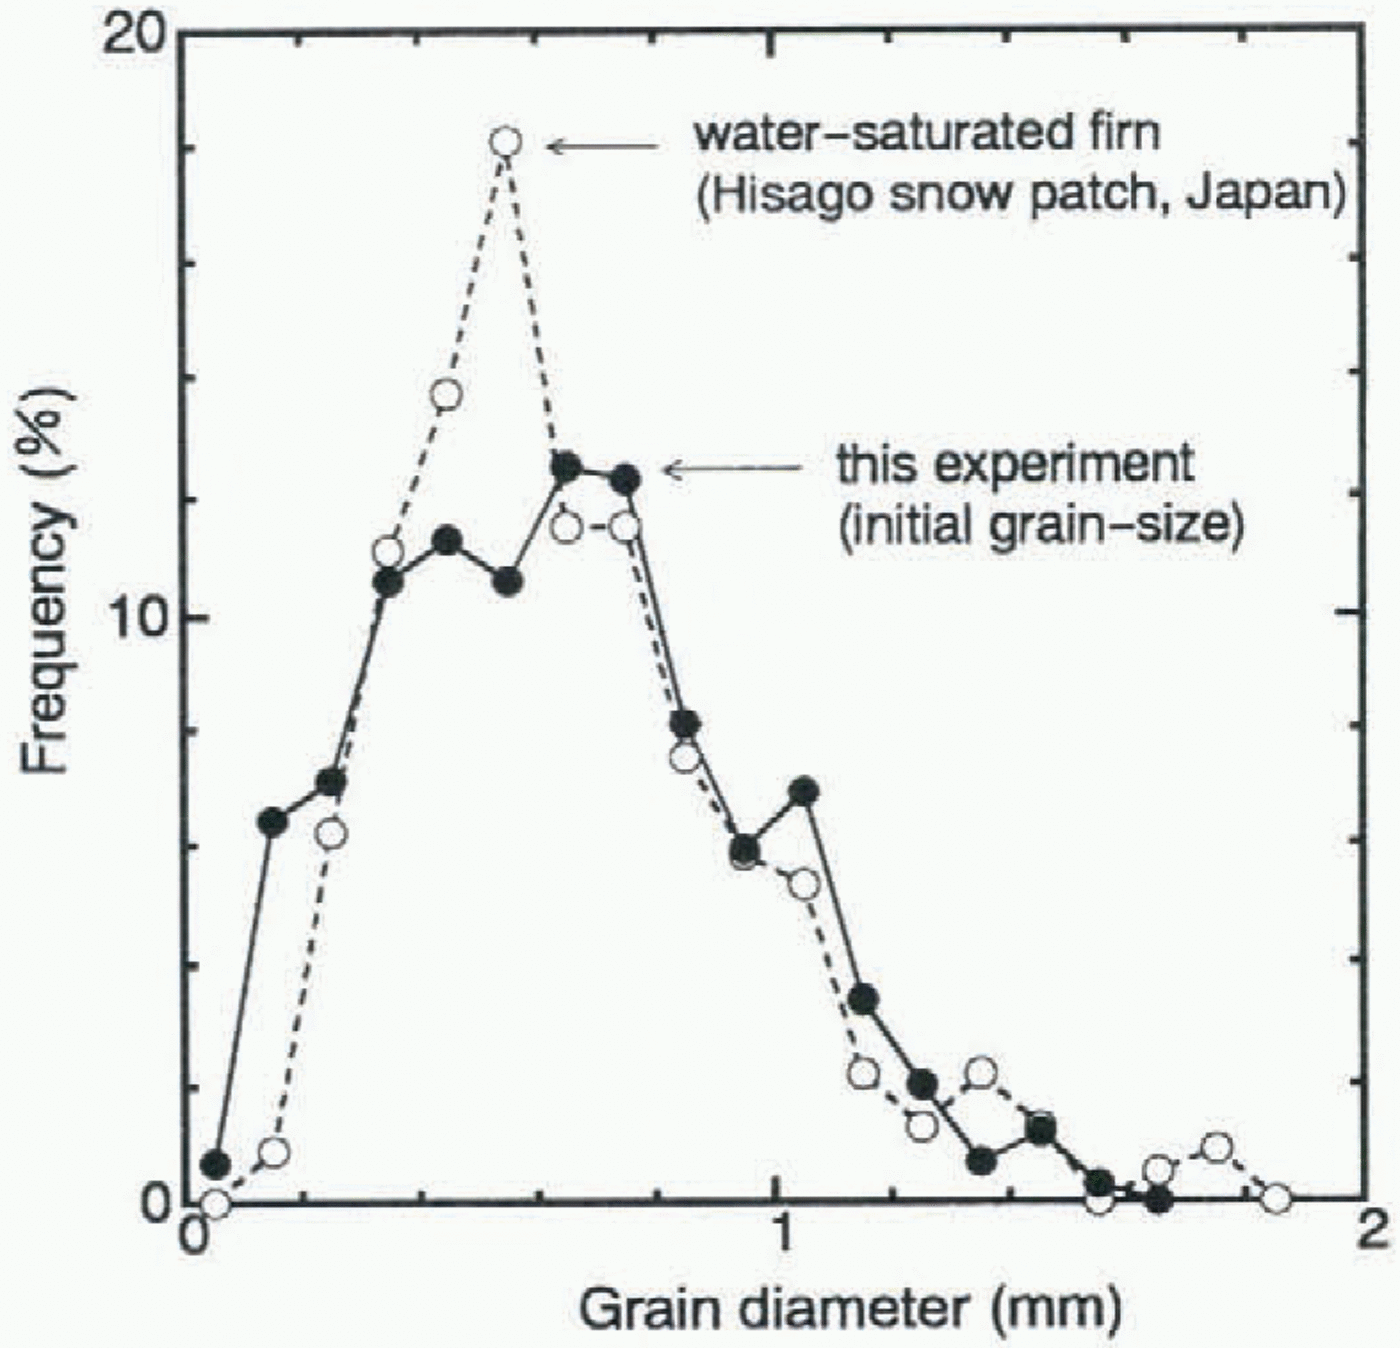
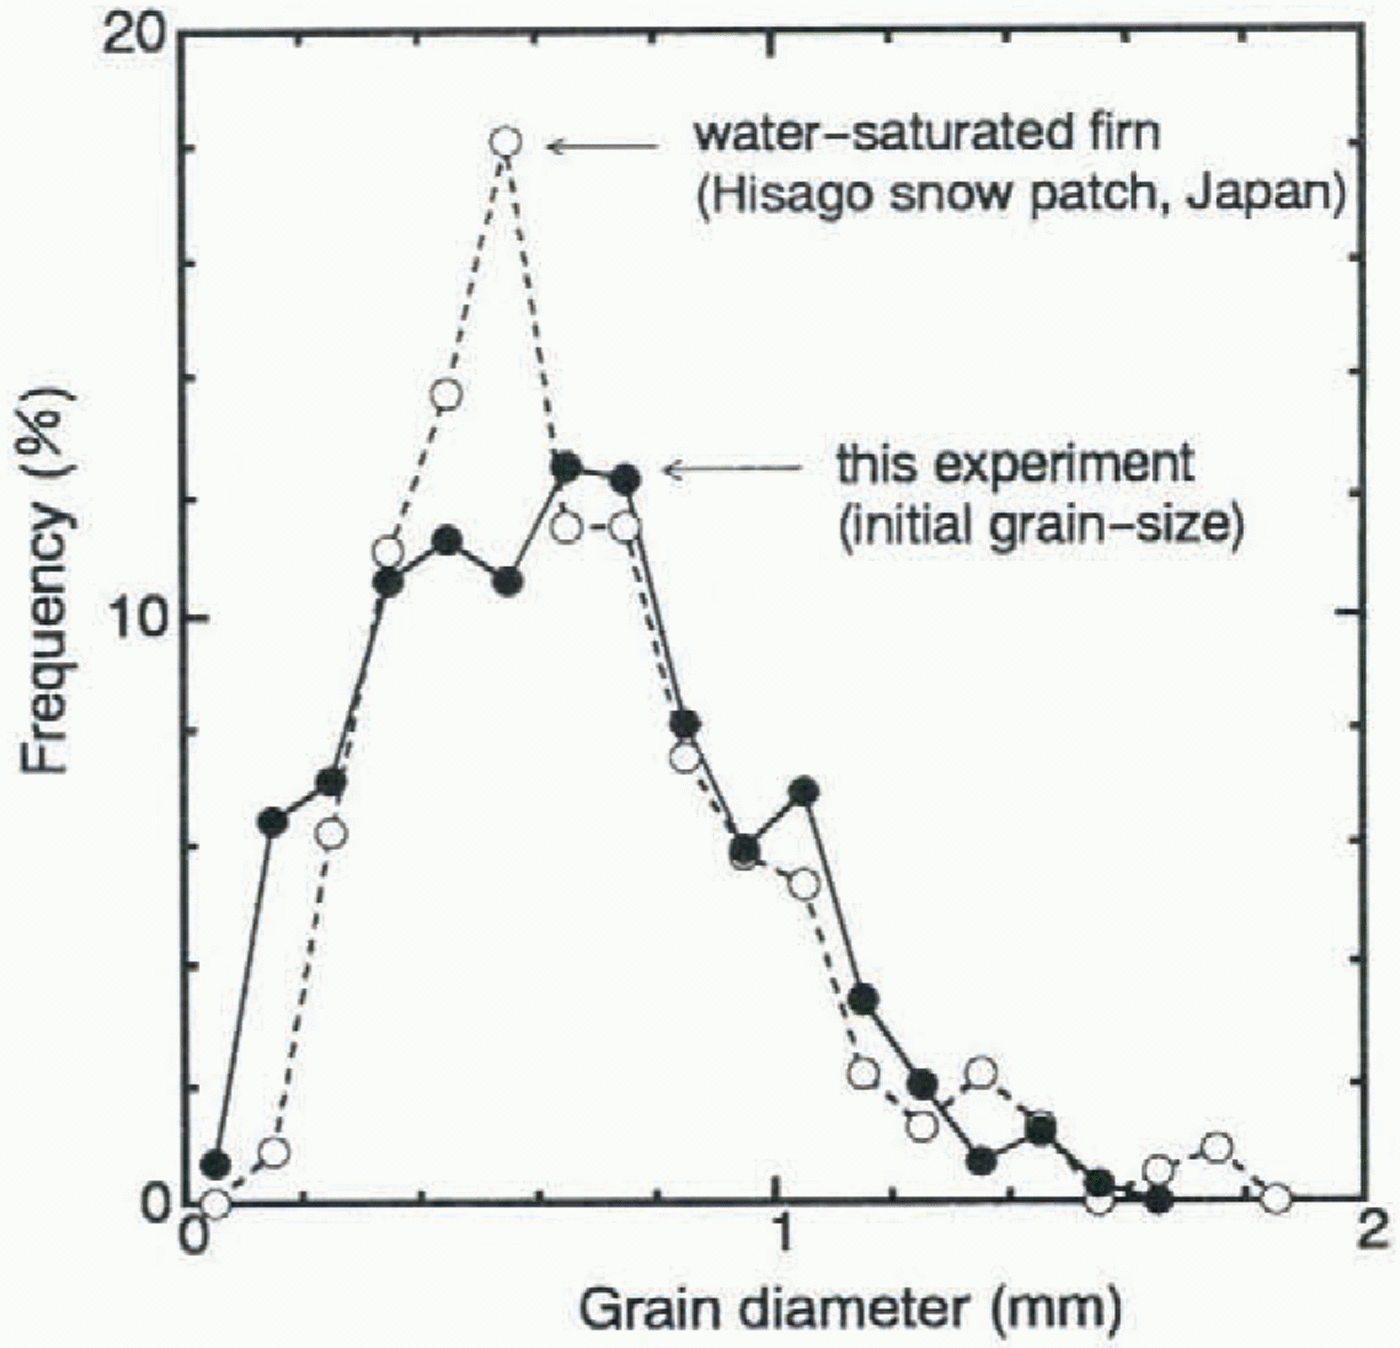
Frequency distribution of snow-grain diameter. Solid circles and open circles, respectively, indicate the frequency distribution of snow samples used for the tests and of watet-saturated firn obtained at the start of the ablation period in Hisago perennial snow patch, Daisetsu mountain, Japan.
magnitude lower than that of dry snow. Tusima (1973) showed from compression tests with repeated loadings at a pressure of 0.32 MPa that densification rate increases as liquid-water content increases. Colbeck (1976) and Colbeck and others (1978) developed a quantitative model of densification processes, which simulated the heat flow, meltwater flow, non-linear viscous creep and particle geometry, to demonstrate that the thermodynamics of wet snow controls its rapid deformation in a different manner to the dry-snow densification. Their results indicated that the wet snow deformed predominantly by regelation, and that the densification rate was highly dependent on the stress, initial particle size, liquid-water content and ionic impurity content of the snow. Although their densification model of wet snow is complex, it was suggested that the change of density may be expressed as a function of time using the simple expression:

where ρ is the density of snow, t is the time, ρ 0 is the initial density and C is the parameter. This expression is available for estimating the densification rate of water-saturated firn and the time required for ice formation in the firn aquifer if the parameter C can be determined properly.
Experimental Procedures
Samples of ice grains for the compression tests were prepared by sieving the compacted snow preserved in a cold room at–10°C to give a uniform grain-size distribution. According to Colbeck and others (1978), the initial grain-size has a significant effect on the densification rate of wet snow; therefore it was determined in the light of the observed grain-size of firn in temperate glaciers and perennial snow patches. Many measurements of grain-size distribution in temperate firn showed that the diameter of ice grain did not usually exceed 2 mm (Seligman, 1941; Vallon and others, 1976; Kawamura and others, 1989). Thin sections of snow samples used for the tests were made to measure the initial grain-size (area-equivalent diameter) distribution. The diameter of grains was in the range 0.1–1.6 mm, the average being 0.64 mm with a standard deviation of 0.25 mm (Fig.
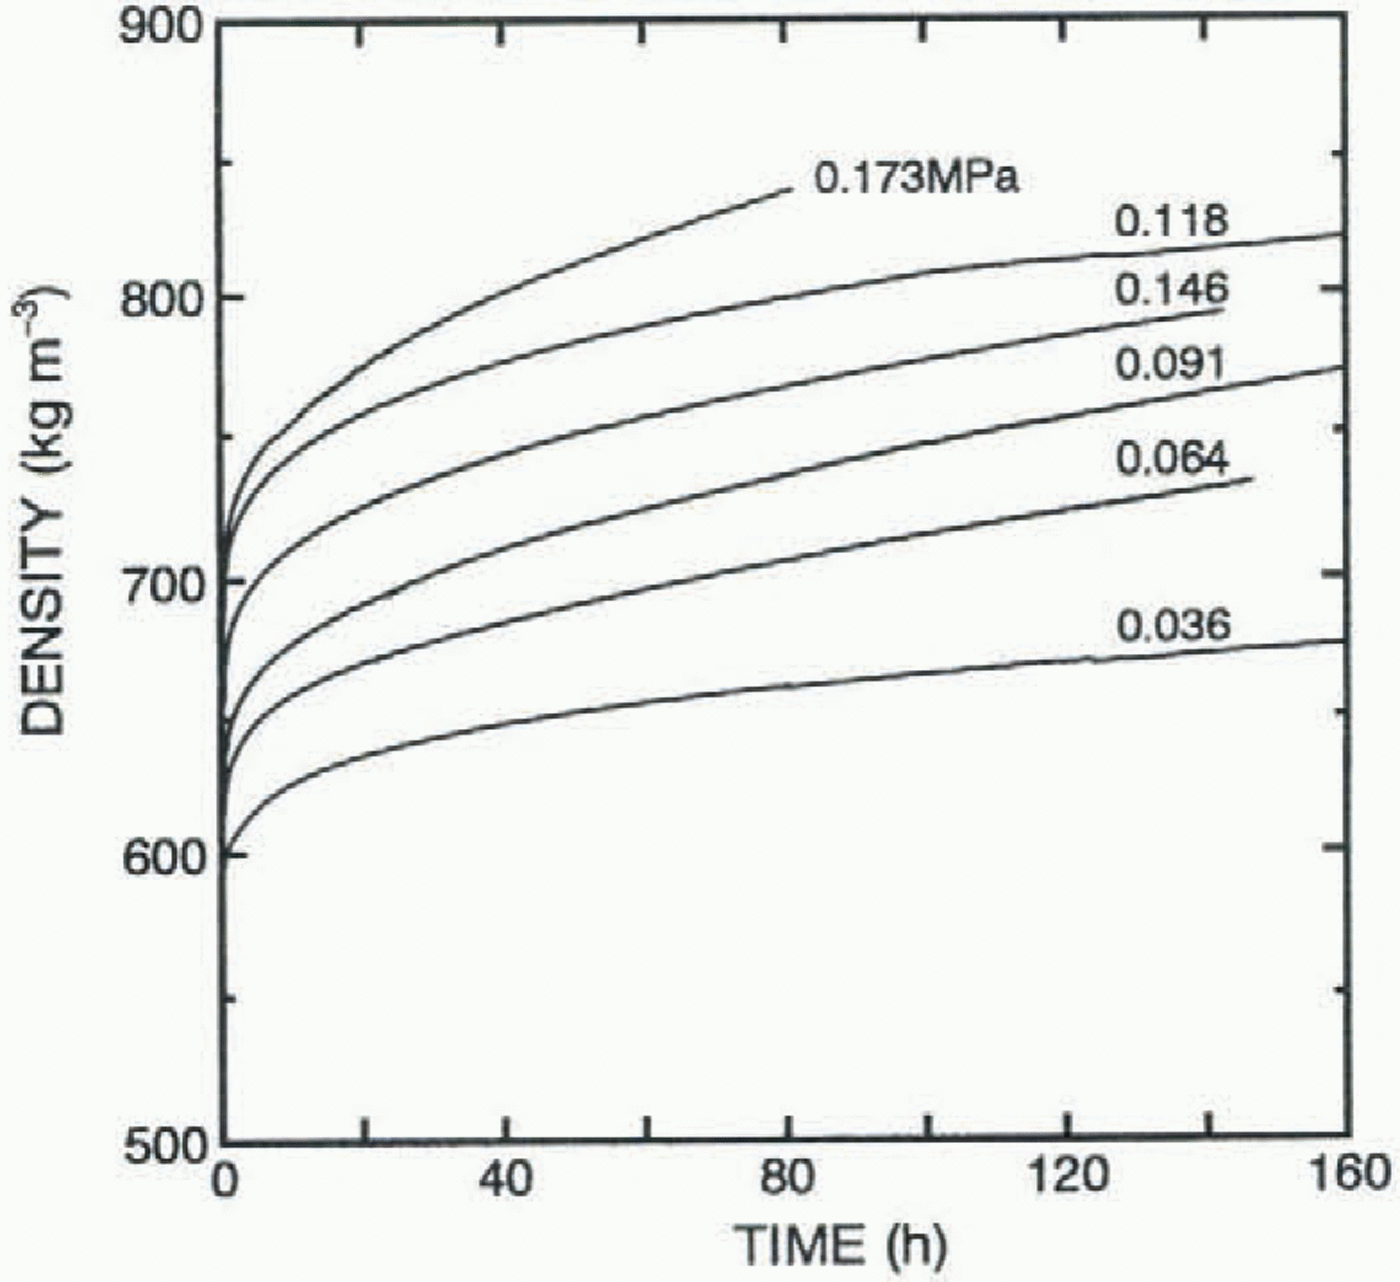
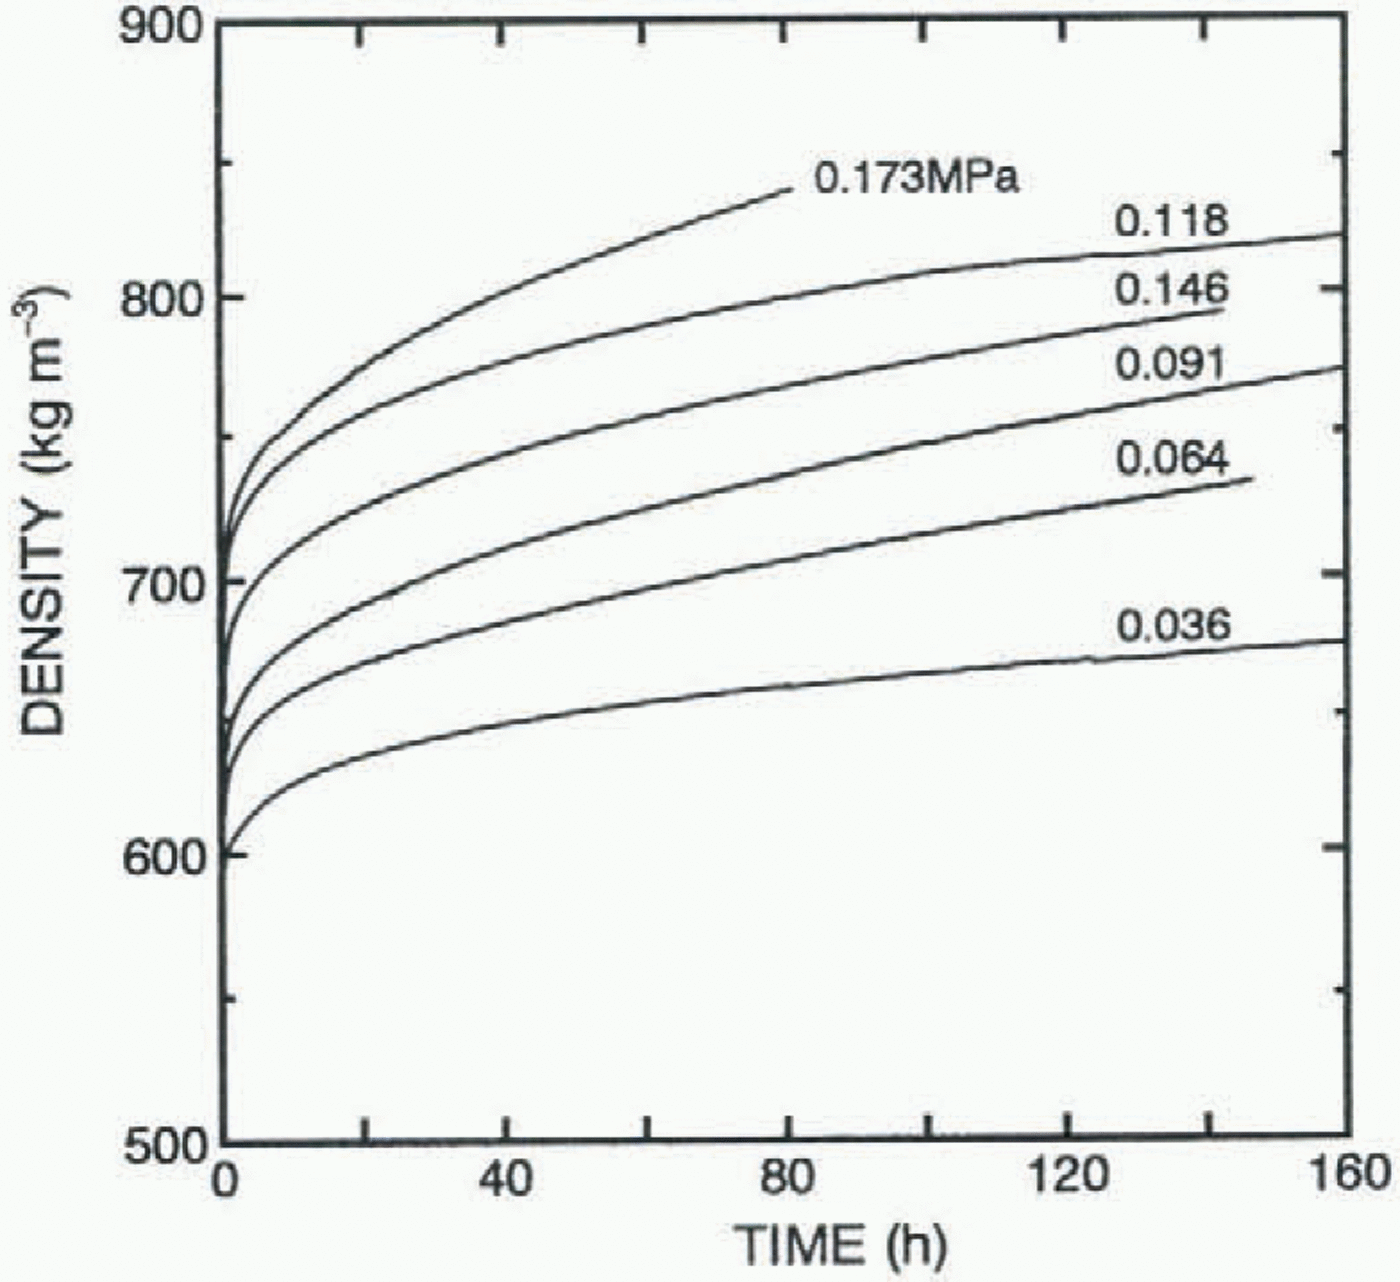
Change in density with time for various values of pressure. The initial density is 500 kgm–3 in all cases. The curves clearly show the decreased densification rate at lower pressures.
1). The frequency distribution of samples closely resembles that of the water-saturated firn which we obtained at Hisago perennial snow patch, Japan, in June 1986.
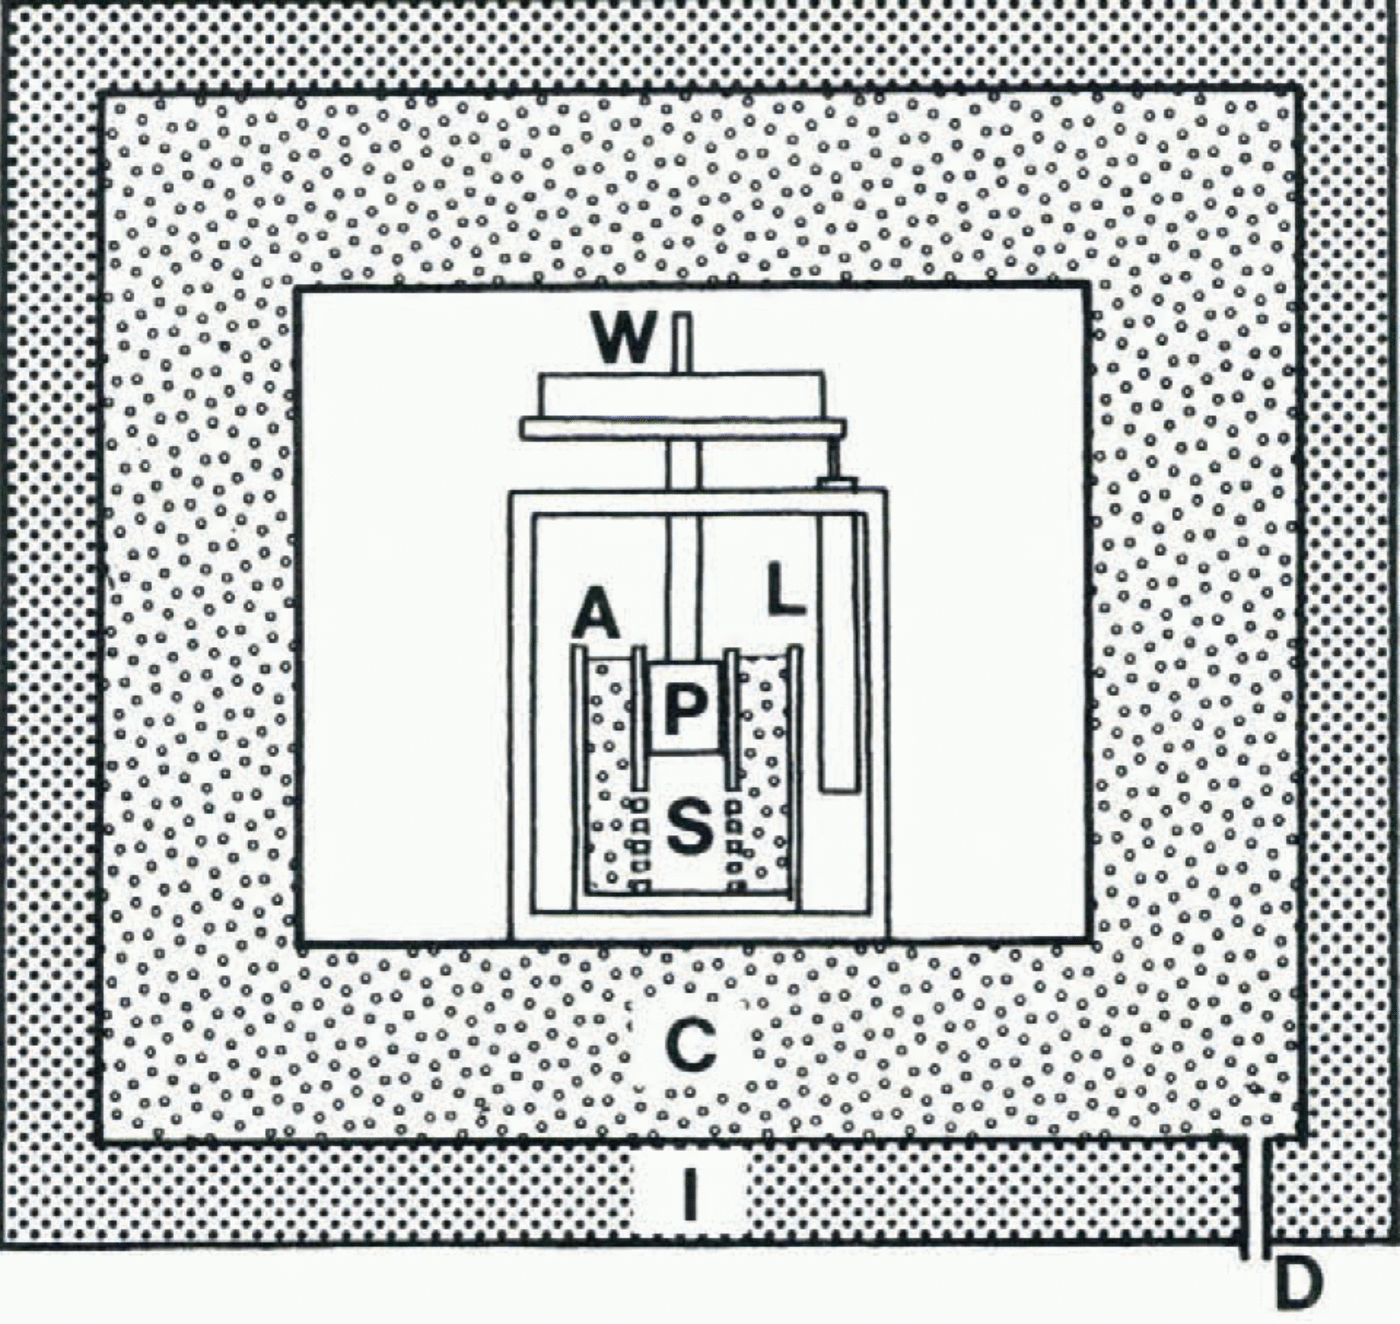
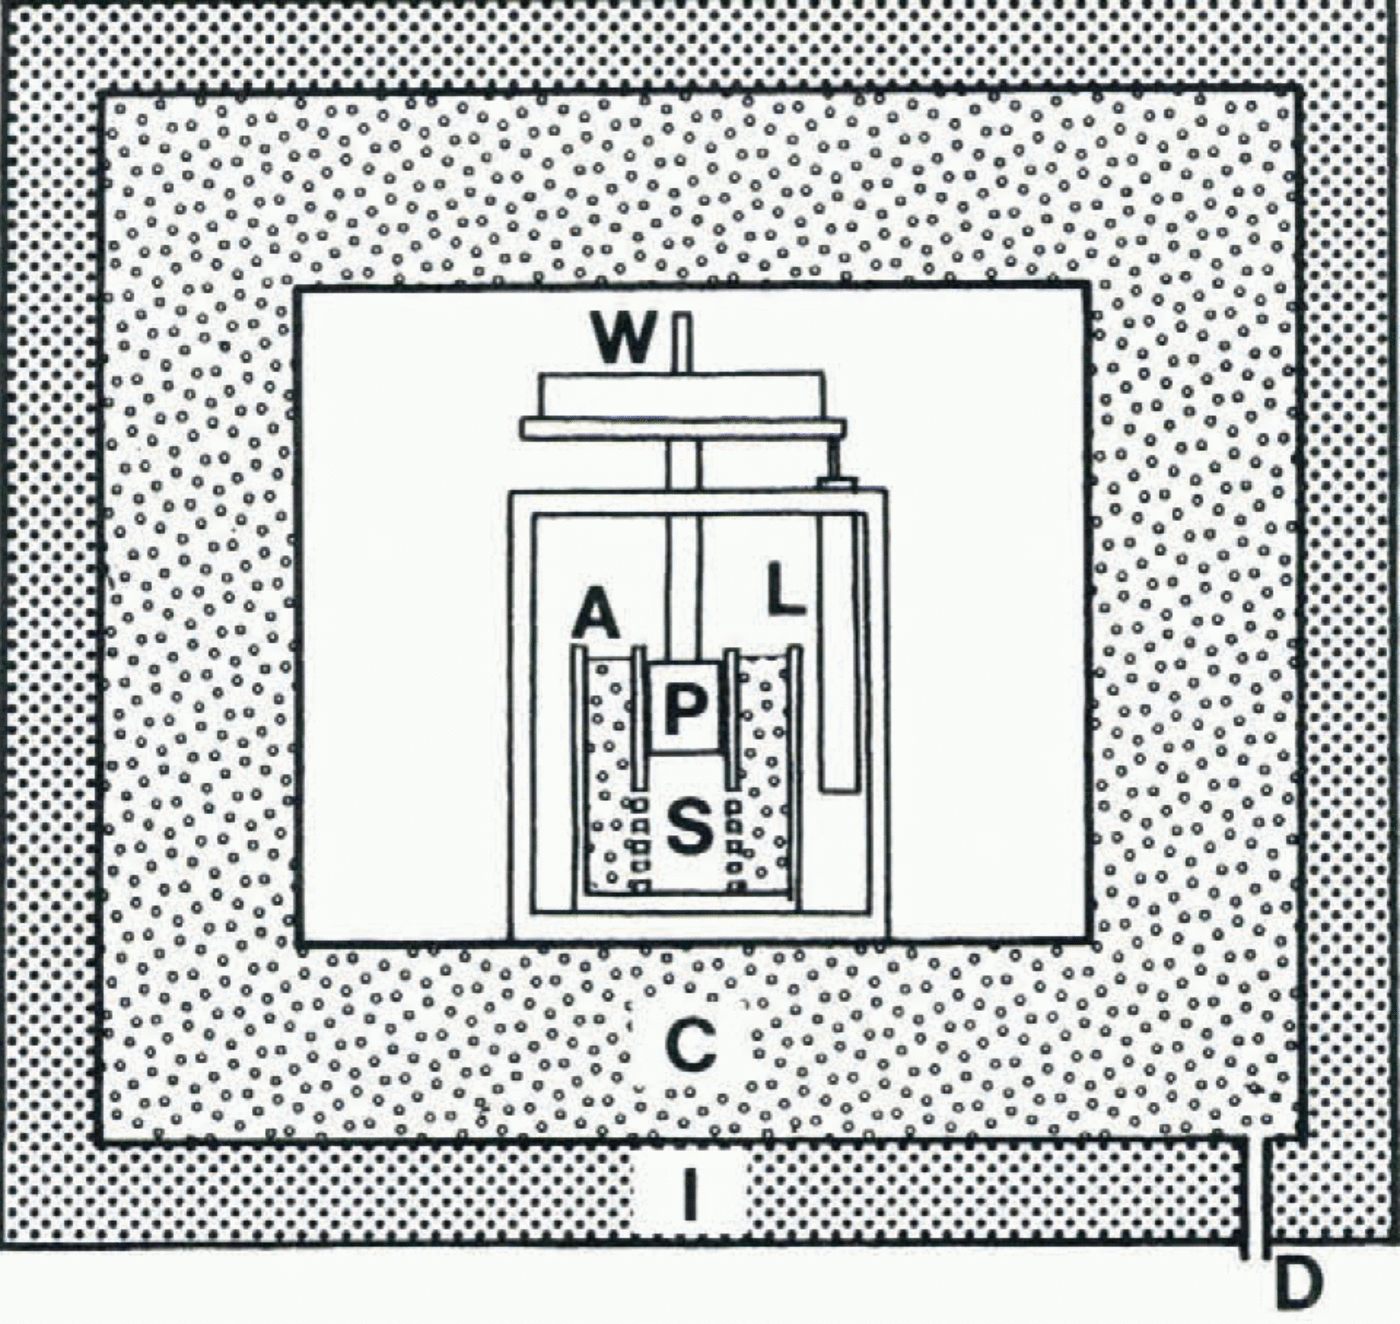
Experimental apparatus used for compression tests of water-saturated snow is shown schematically in Figure 2. To maintain samples at 0°C, compression tests were conducted in a cold room precisely controlled to 0 ± 0.5° C, and the compression apparatus is located in the insulated container surrounded by the crushed ice at 0°C (inner) and the insulation material (outer).
After samples were compressed to 500 kgm–3 in the inner part of a double-sided acrylic cylinder with an inside diameter of 48 mm, it was located in the insulated container for 10 h to be raised to a temperature of 0°C. Then the outer part of the cylinder was filled with crushed ice and distilled water at 0°C. Because the partition between two parts has many holes (3 mm in diameter), distilled water flows into the inner part and soaks into the sample. After being
Schematic diagram of the experimental apparatus used for compression tests of water-saturated snow. A, acrylic cylinder; C, crushed ice at 0°C; D, drain; I, insulation material; L, linear gauge; P, piston; S, sample; W, weight.
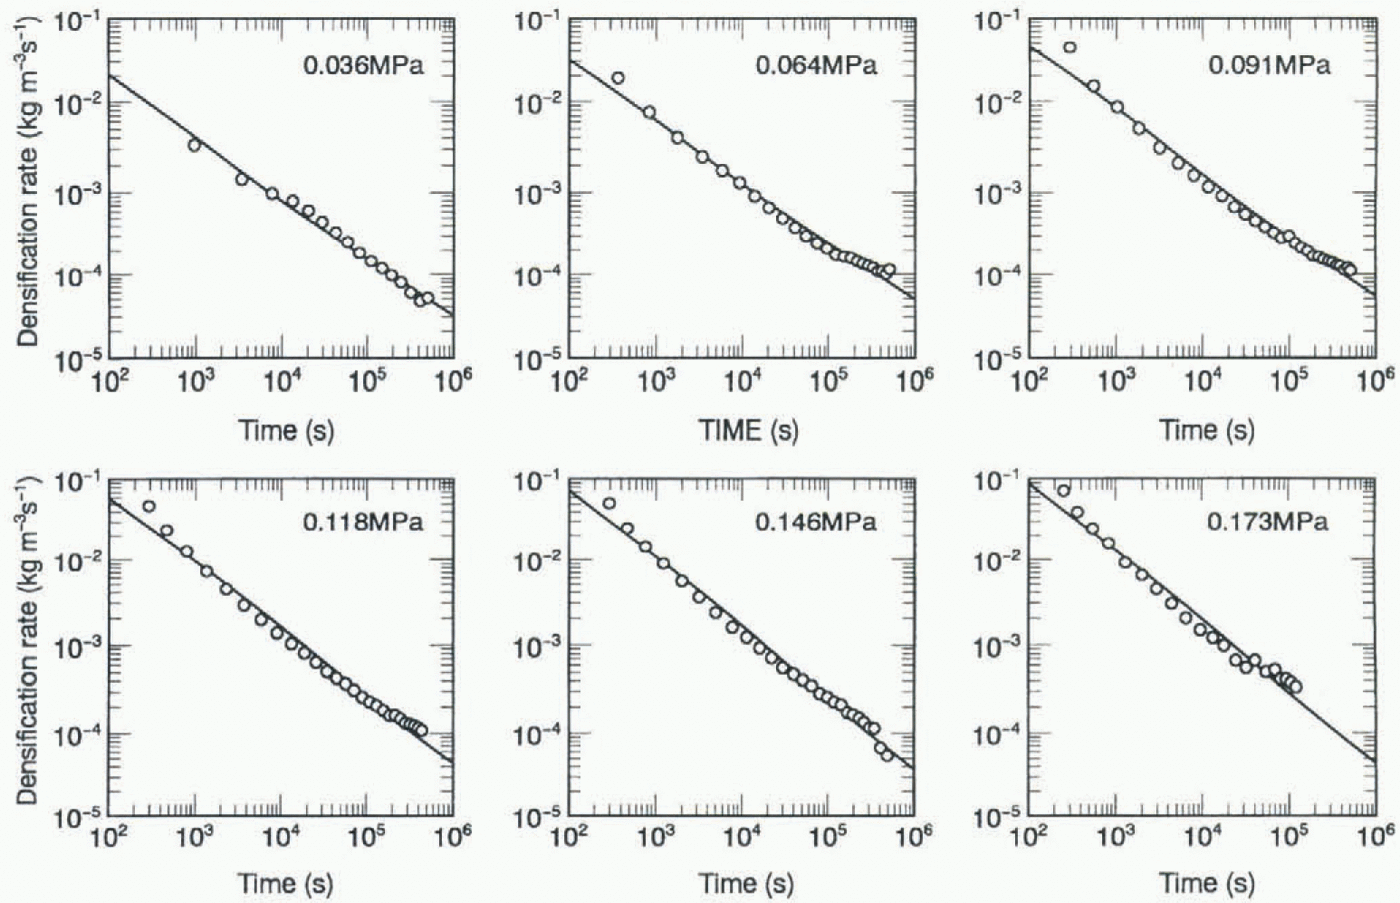
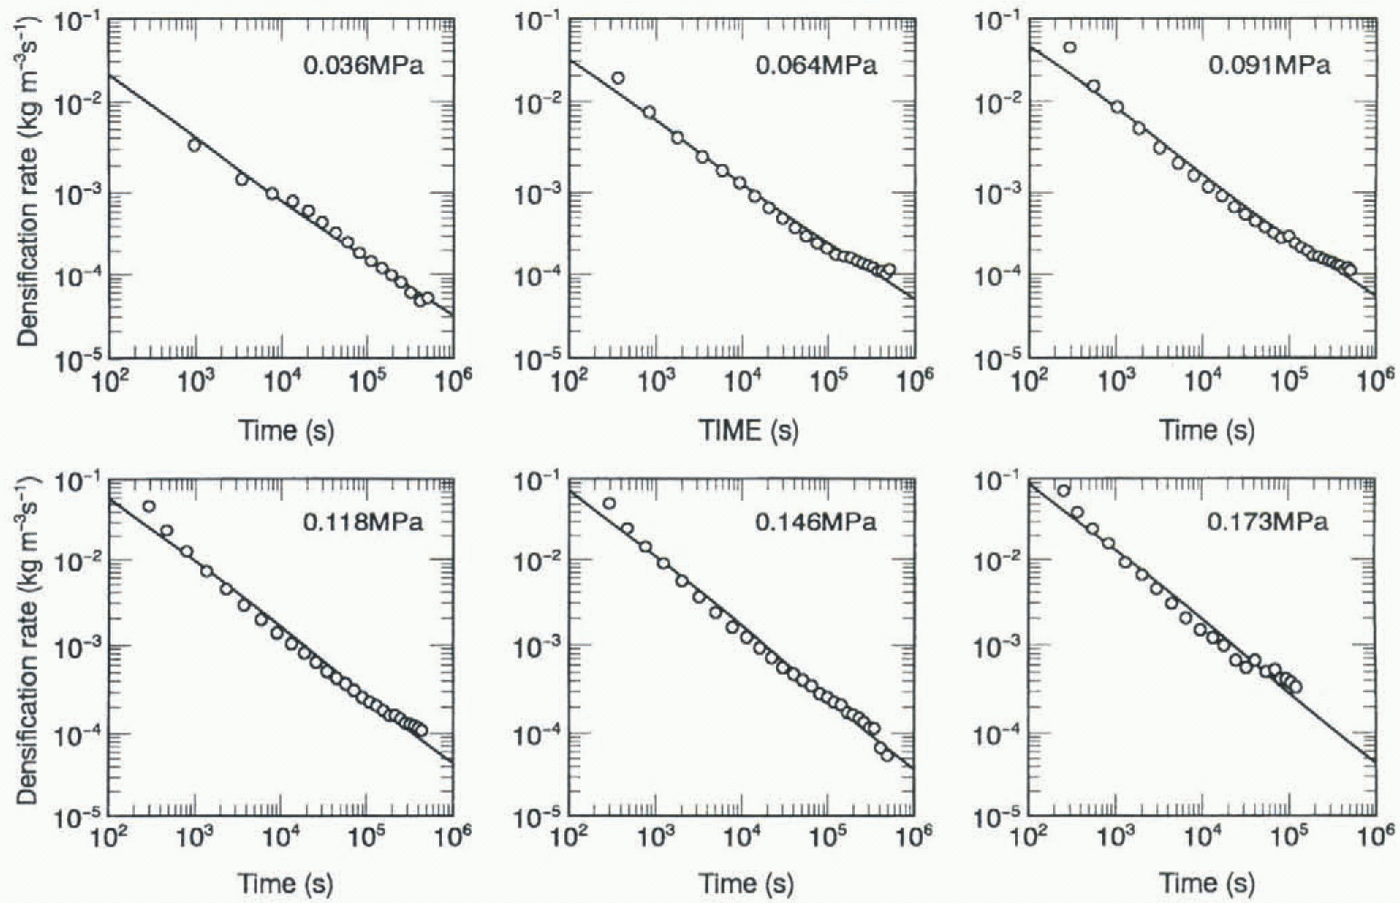
Relation between densification rate and time for different pressures. The densification rate was calculated at intervals of 5 kg m–3. A linear relationship between logarithm of densification rate and logarithm of time is seen at each pressure.
immersed in water for 1 h, samples were compressed by the hardened plastic piston at a constant pressure for about 150 h. The mass and the initial height of samples were 90.5 g and 100 mm, respectively. Part of the applied load is lost by the friction between the acrylic cylinder and the piston. Thus, the frictional losses were measured for each test, using a load cell to obtain the effective loads acting on samples. The pressure was calculated by dividing the effective load by the cross-sectional area of the cylinder. Various pressures from 0.036 to 0.173 M Pa were adopted in the experiments. The change in sample length was measured using a linear gauge, and recorded digitally at intervals of 72 s by a personal computer. During compression, the air temperature in the insulated container was monitored using a thermocouple, and confirmed as remaining at 0∘C.
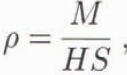
Since the mass of the sample, M, and the cross-sectional area of the cylinder, S, are kept constant during compression, the density, ρ, and the densification rate, ρ, of the sample are written as
and

where H is the sample length. Thus, we can calculate ρ and ρ only by measuring H.
Results
The change in density with time for various values of pressure is shown in Figure 3. Marked increases in density were found at the start of each compression, and then the increasing rate of density tends to decrease gradually with increasing time. The rate of increase in density is remarkably dependent on pressure. For example, at a lapse of time of 80 h, a density of about 830 kg m–3 is attained at a pressure of 0.173 MPa, and a density of only 660 kg m–3 at 0.036 MPa.
The densification rate was calculated at intervals of 5 kg m–3, and its relation to time is shown in Figure 4. At each pressure, the logarithm of the densification rate was proportional to the logarithm of the time:
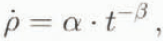
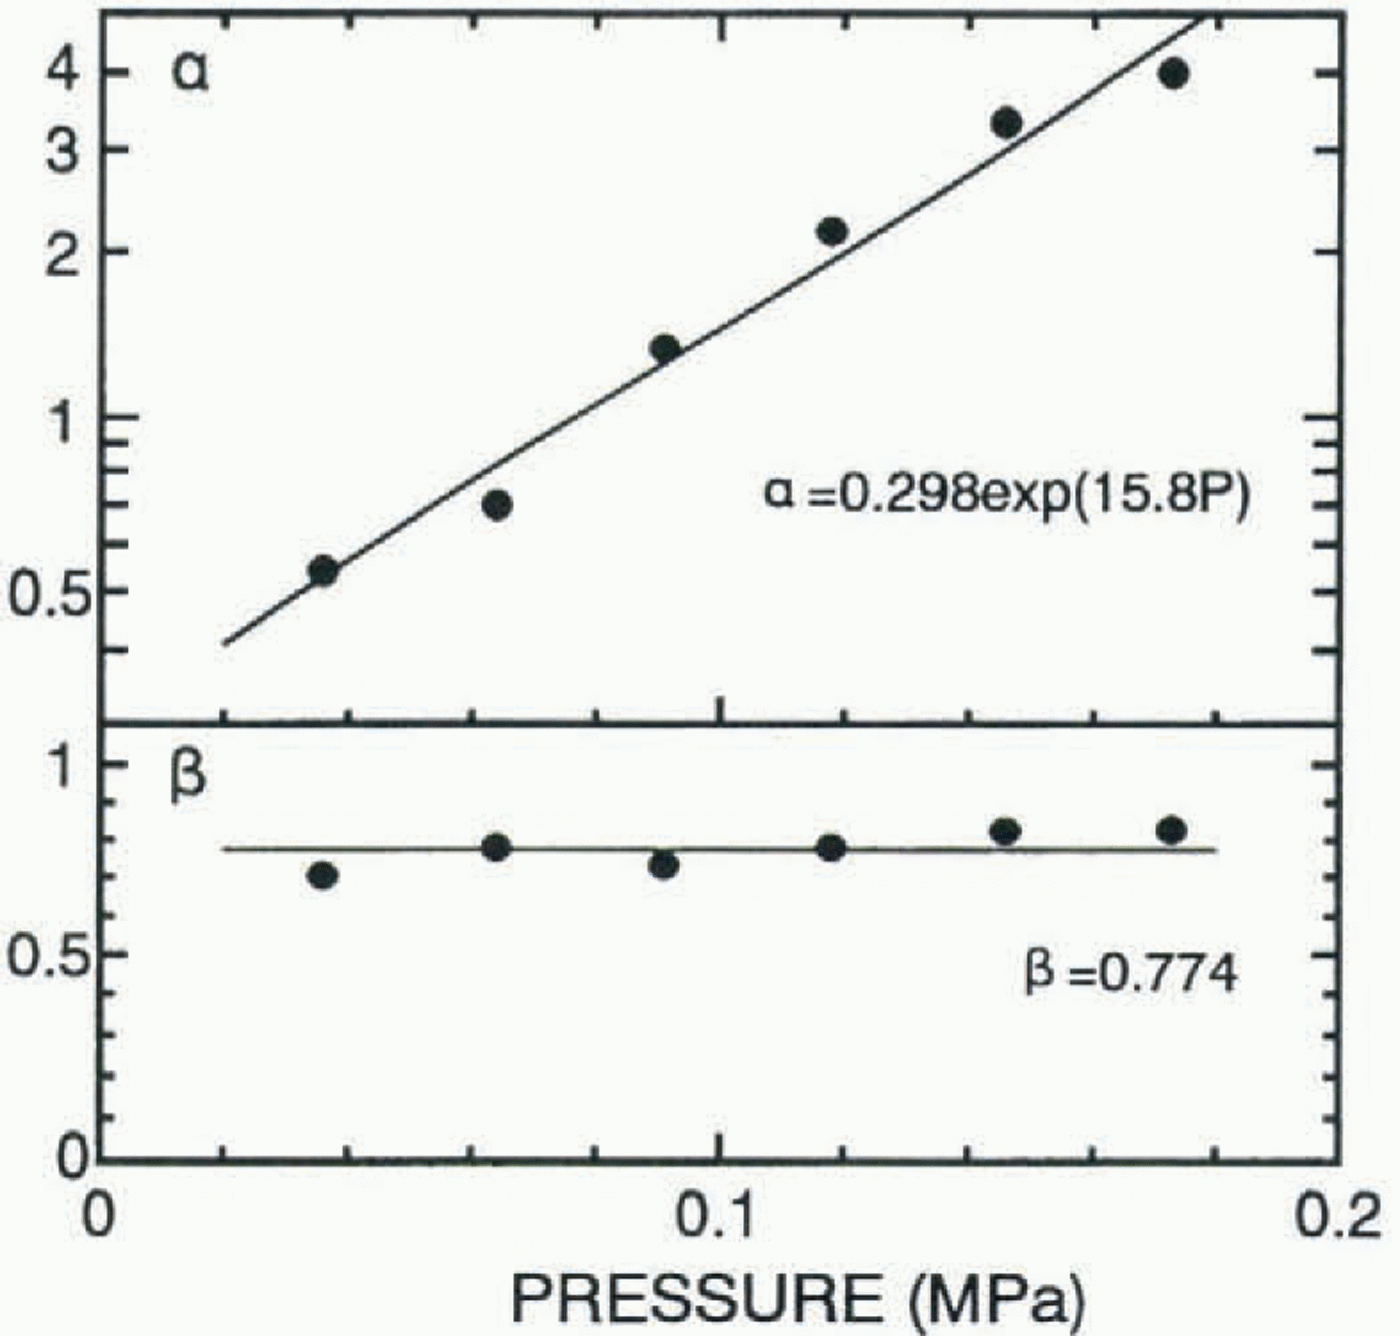
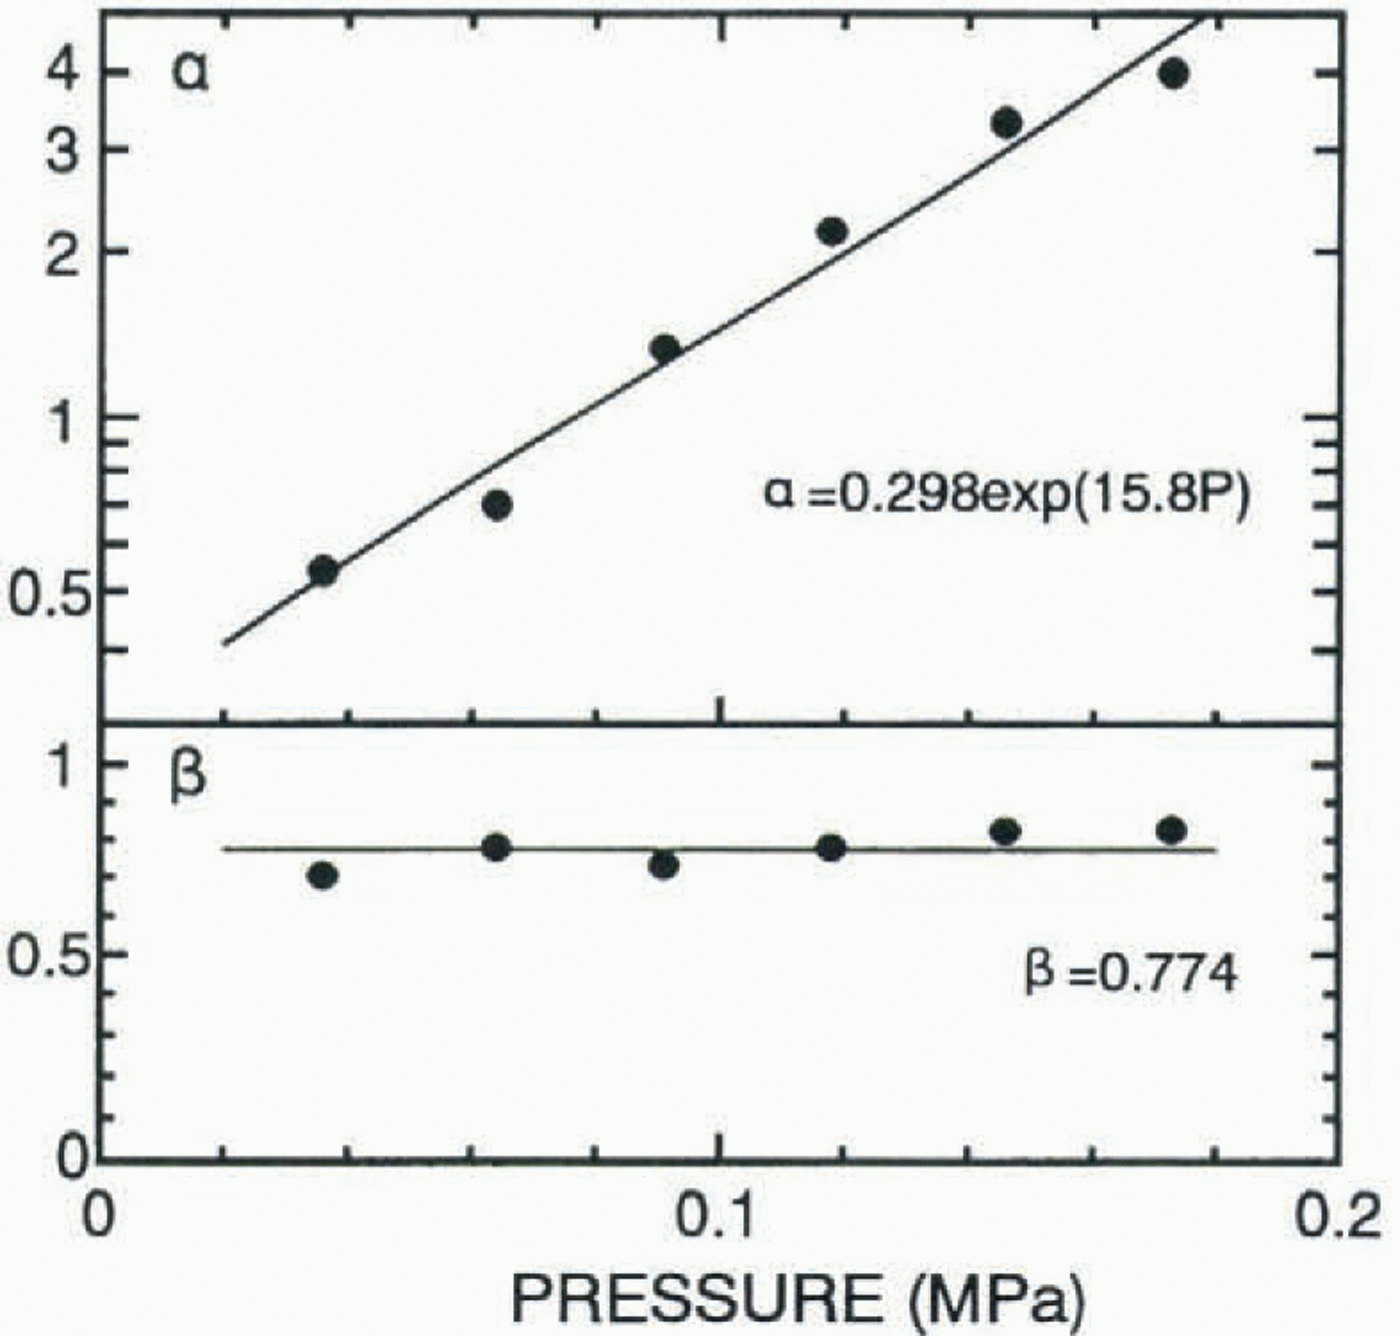
where α and β (α,β > 0) are parameters, α and β are plotted against pressure (P) in Figure 5, when ρ, t and P are given in kg m–3 s–1, s and MPa, respectively. It is seen that α, which means the densification rate at t = 1, increases exponentially with increasing pressure and is expressed approximately as

while β is almost constant, not depending on pressure:
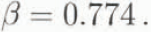
Substituting α and β into Equation (4) from Equations (5) and (6) yields
Relation between parameters, α and β, and pressure. The parameters were calculated when ρ and t were given in kg m–3 s–1 and s, respectively. It is seen that a increases exponentially with increasing pressure, while β is almost constant.
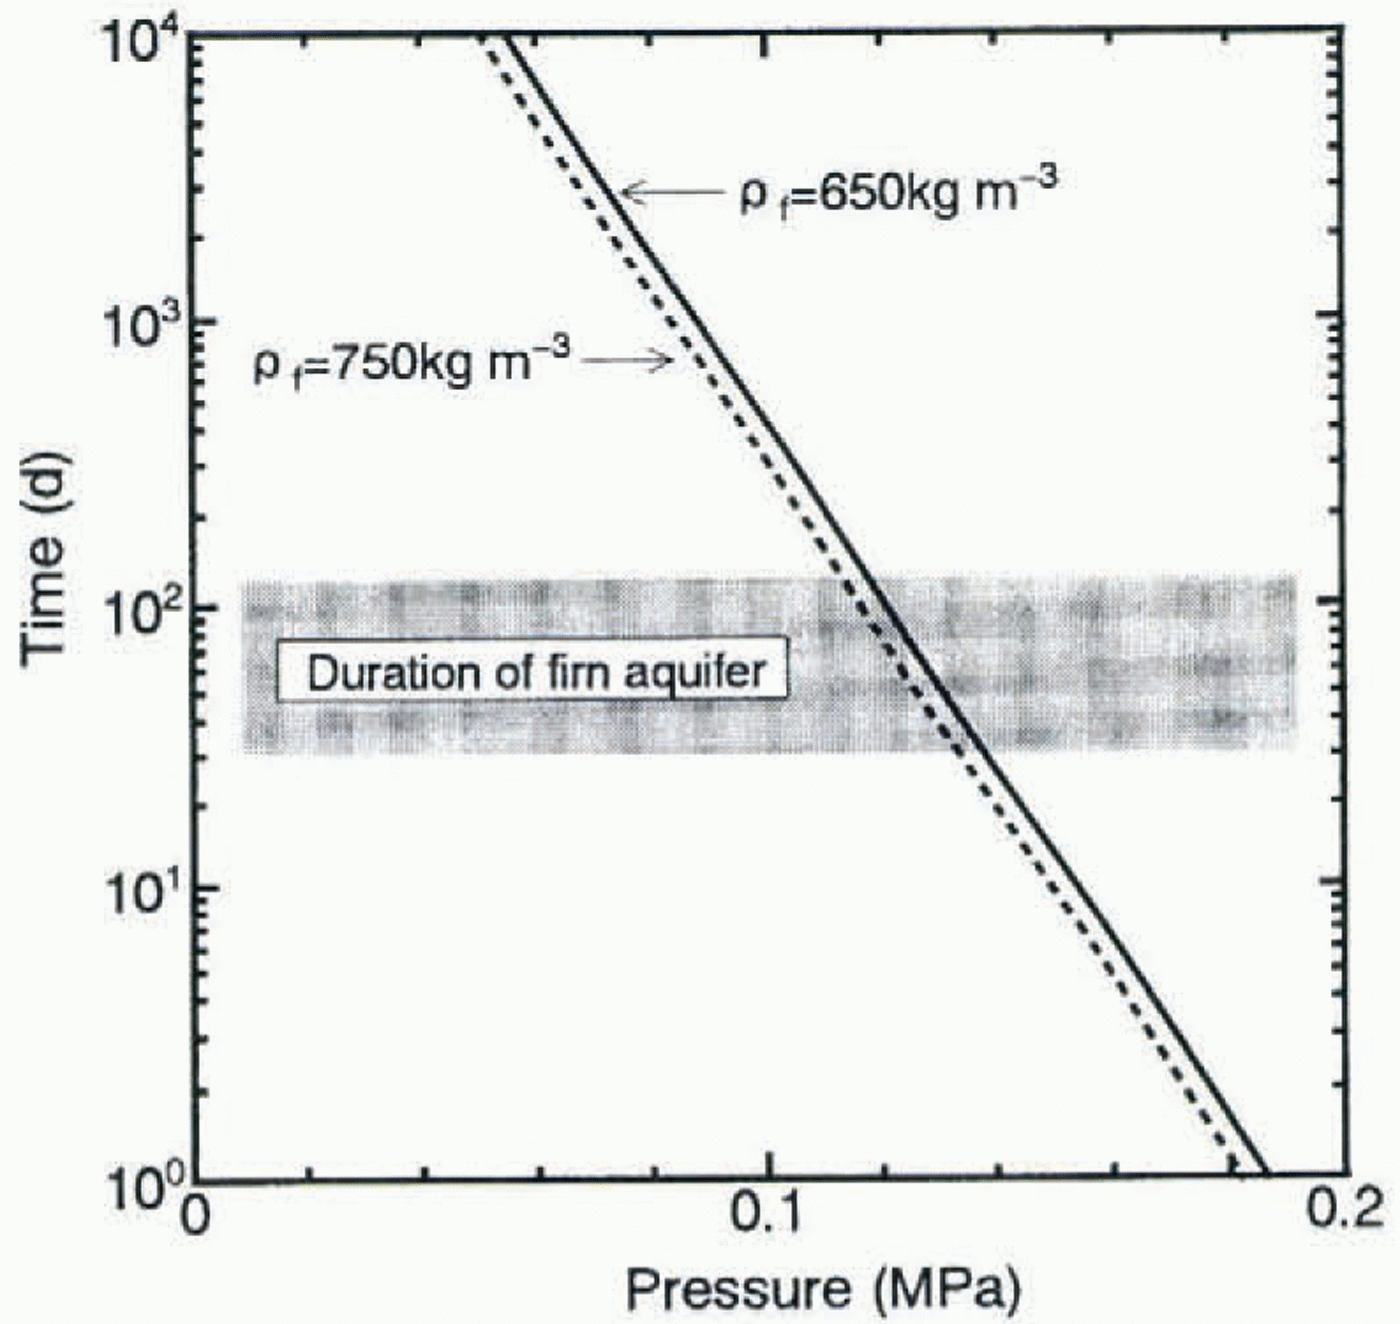
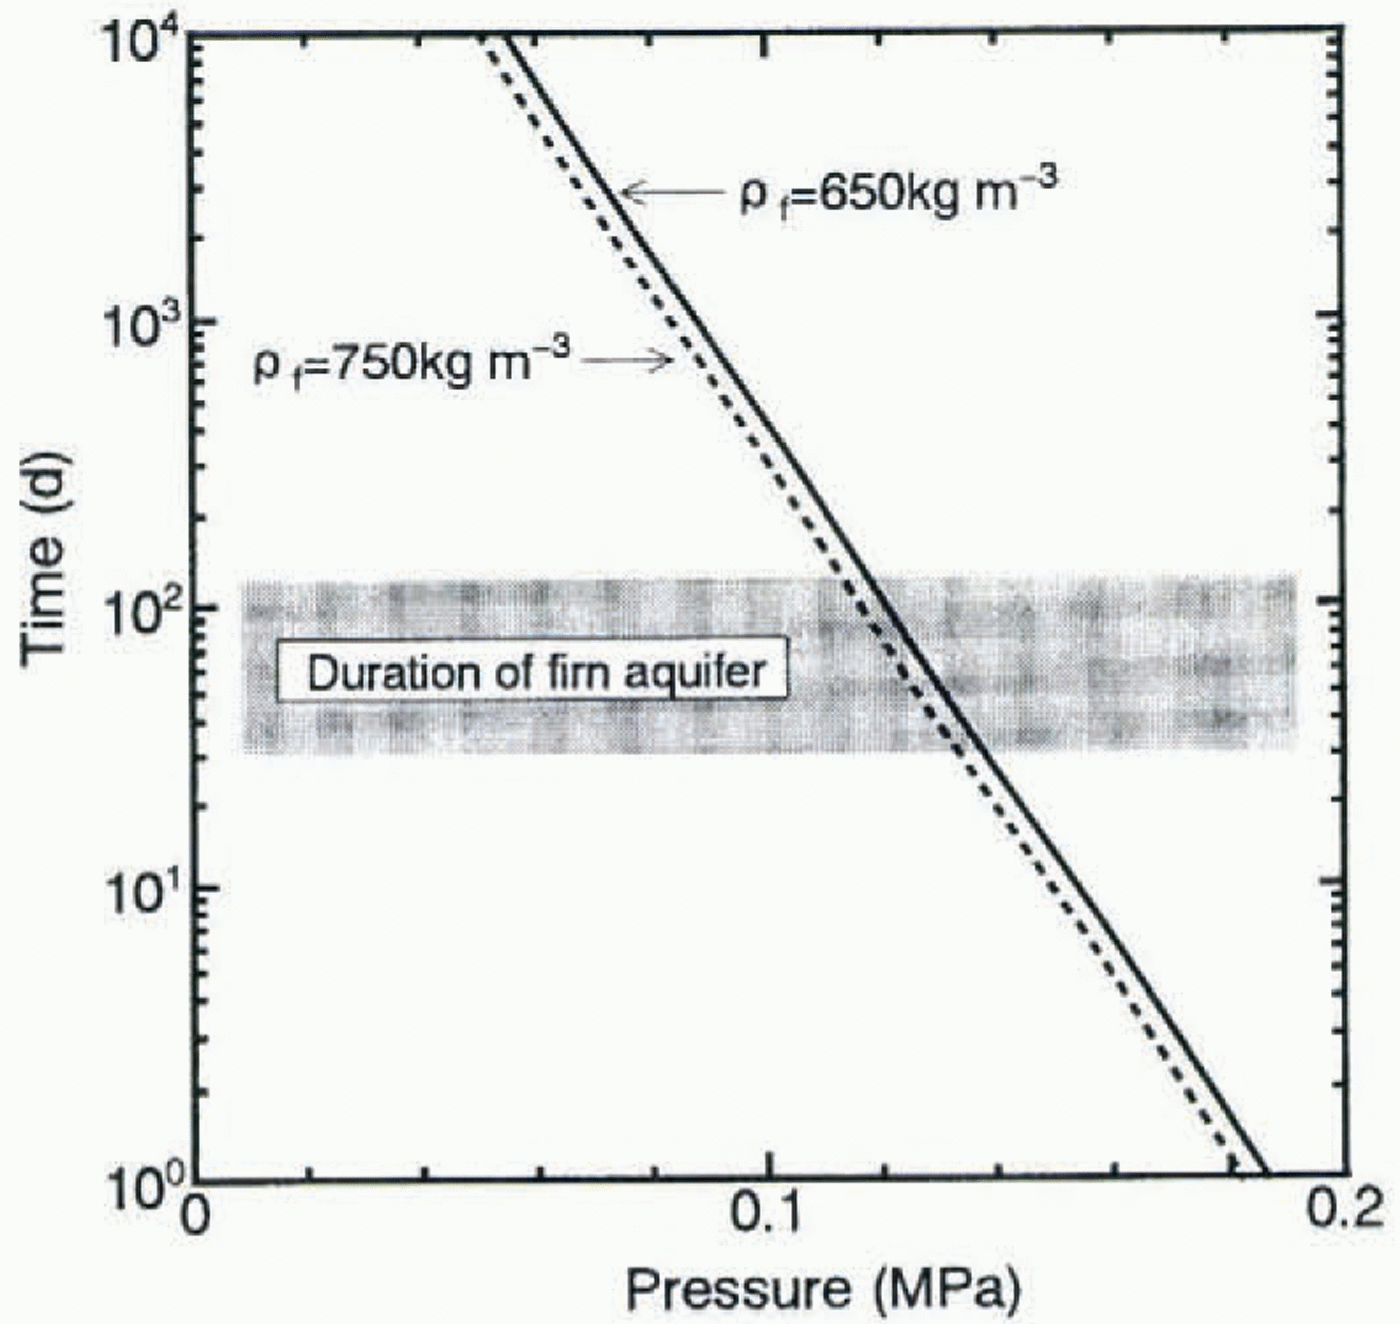
Time required for the transformation from firn to ice by densification in firn aquifer as a function of pressure. Calculations were done in two cases when ρf = 650kg m–3 (solid line) and ρf = 750 kg m–3 (broken line). Dotted area represents the range of period when firn aquifer exists. The time necessary for ice formation decreases exponentially with increasing pressure in both cases.

Integration of Equation (7) gives

where ρ 0 is the initial density (500 kg m–3). Equation (8) is almost identical to Equation (1) except that parameter C is expressed as a function of P, which supports the thermodynamic model of wet-snow densification developed by Colbeck and others (1978).
Discussion
The following equation is obtained by rewriting Equation (8):
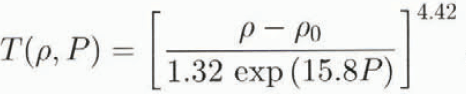
where T(ρ, P) is defined as the time required to increase the density of firn from ρ 0 (500 kg m–3) to ρ at a pressure of P. If the density of pore close-off is taken to be 830 kg m–3, we can approximately calculate the time (T i) required for the transformation from firn with a density of ρ f to ice, using the following formula:

The necessary time for ice formation in the firn aquifer is shown as a function of P for two values of ρ f in Figure 6. Because the density of firn just before it is saturated with water above the firn–ice transition is considered to fall into the 650–750 kg m–3 range (lida and others, 1984; Yamada, 1987; Kawashima and others, 1993), both 650 and 750 kg m–3 were taken as values of ρ f resulting in the slight difference of T i. The necessary time for ice formation decreases exponentially with increasing pressure. If the pressure is above a critical value, the transformation from firn to ice canbe completed within the period when the firn aquifer exists, as was observed at Vall’e Balache, French Alps, by Vallon and others (1976). It is conceivable that the duration of firn aquifer is nearly equal to the ablation period of 1–4 months, so the critical value is presumed to be 0.12–0.14 MPa. This result is supported by the fact that the water-saturated firn with a density of 650kg m–3 was not transformed into ice under a pressure of 0.07 MPa or less during the ablation period (4 months) in Hisago perennial snow patch (Kawashima and others, 1993).
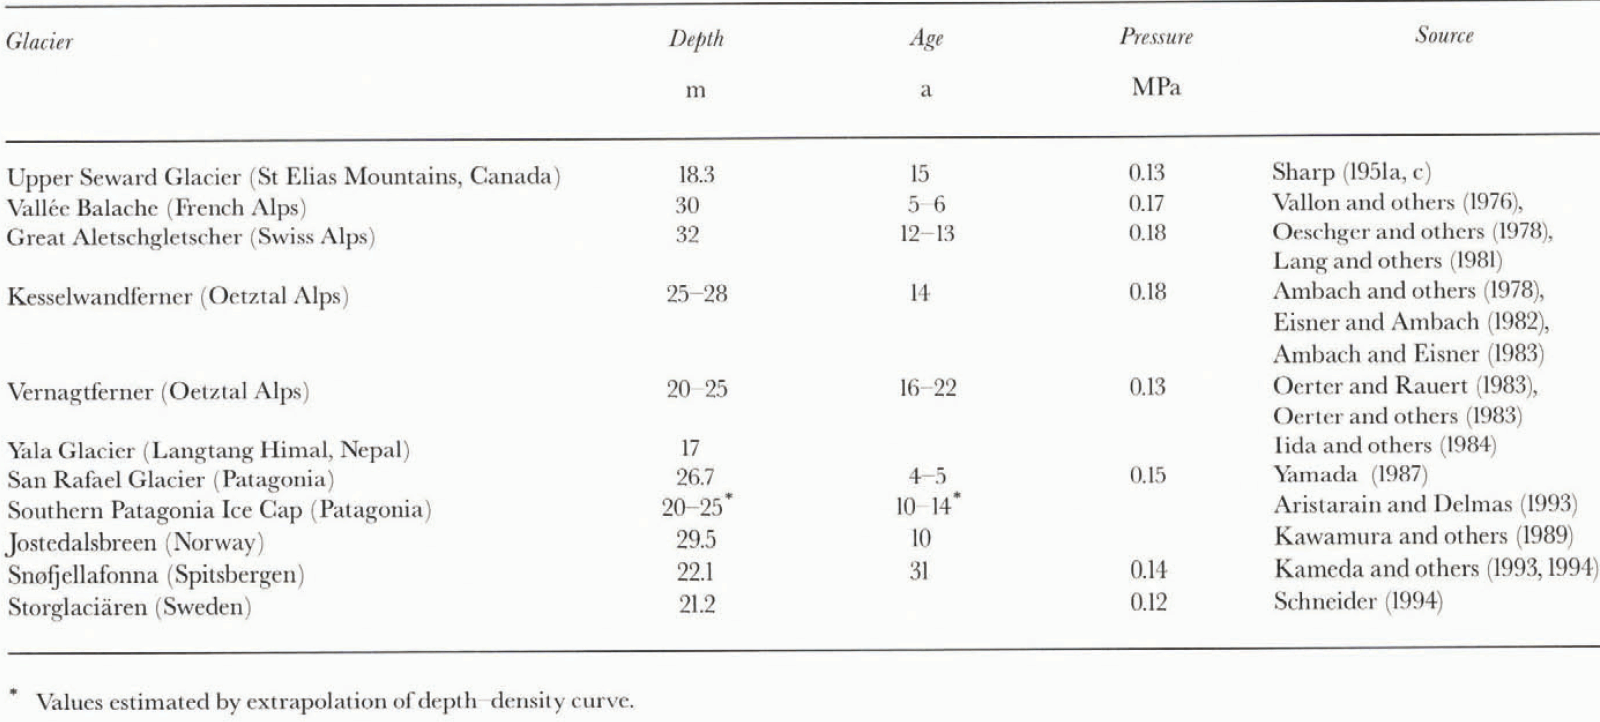
The critical value mentioned above can be compared with the overburden pressure acting on the water-saturated firn found in the wet-snow zone of temperate glaciers. The overburden pressure is calculated from the depth–density curves and is listed in Table 1, together with the depth and age of the firn–ice transition. The age of the firn-ice transition, obtained by dividing the cumulative mass of overburden firn at the transition by the average net accumulation rate, varies widely from 4 to 31 a, while most of the depth of firn–ice transition falls within the range 20–30 m and is independent of the elapsed time since snow deposition.
Depth and age of firn–ice transition, and overburden pressure acting on the water-saturated firn layer in the wet-snow zone of temperate glaciers
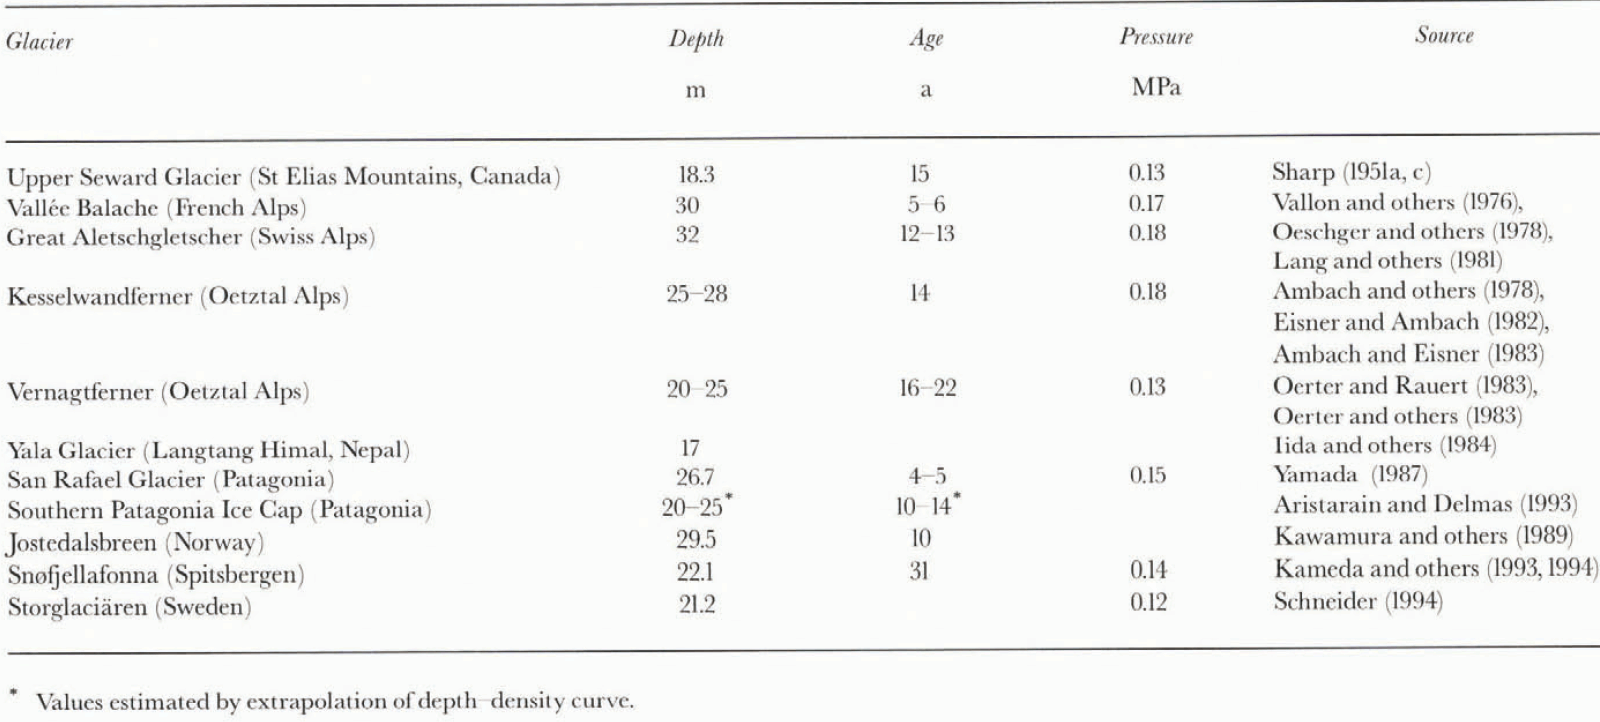
The overburden pressure is characterized by a concentration between 0.12 and 0.18 MPa, and its minimum value is in good agreement with the critical pressure mentioned above. These facts strongly indicate that the depth of firn–ice transition in the wet-snow zone is determined mainly by the overburden pressure and the duration of the firn aquifer, not the elapsed time since snow deposition. Furthermore, it is certain that the transformation from firn to ice occurs by densification largely within the period when the firn aquifer exists in the wet-snow zone. The strong dependence of ice formation on the overburden pressure suggests that the self-balancing mechanism for controlling the concentration of the depth of firn–ice transition exists. That is, the decrease in the depth of firn–ice transition to less than 20 m leads to the decrease in the overburden pressure to less than 0.12–0.14 MPa, resulting in the interruption of ice formation, which increases the thickness of firn layer; conversely, too thick a firn layer, exceeding 30 m, brings about a large densification rate due to high overburden pressure, and the consequent increase in the rate of ice formation reduces the depth of firn–ice transition.
Concluding Remarks
Results from compression tests of water-saturated firn provide valuable information on the transformational process from firn to ice in the wet-snow zone of temperate glaciers, and contribute to an understanding of the role of firn aquifer in the ice formation quantitatively.
The density of firn is expressed as a power function of time, as introduced by Colbeck and others (1978), while the densification rate increases exponentially with increasing pressure. The necessary time for ice formation in the firn aquifer, estimated from the empirical formula, decreases exponentially as the pressure increases, showing that the overburden pressure acting on the water-saturated firn is the most important factor in determining the depth of firn–ice transition. The fact that the thickness of firn layer found in temperate glaciers is concentrated between 20 and 30 m can be explained in terms of the self-balancing mechanism controlled by the overburden pressure.
Acknowledgements
The authors wish to express their appreciation to Hon. Prof. G. Wakahama of the Institute of Low Temperature Science, Hokkaido University, for guidance and advice for this work. The authors also would like to acknowledge the assistance of Messrs T. Segawa, K. Shinbori, S. Matsumoto and S. Nakatsubo of the Institute of Low Temperature Science, Hokkaido University, for fabricating experimental apparatus.