Implications
Genotyping costs are still the major limitation for the uptake of genomic selection (GS) by the pig industry. As a large number of genomic markers are needed for accurate genomic prediction of breeding values, an alternative to reduce costs is to genotype a large proportion of animals for a smaller number of markers and impute the missing ones. In this study various scenarios/strategies were investigated, allowing for making recommendations for the development of single nucleotide polymorphism (SNP) chip panels based on accuracy of imputation and its impact on predicted genomic breeding values of selection candidates in pig breeding.
Introduction
Genomic selection (Meuwissen et al., Reference Meuwissen, Hayes and Goddard2001) has been successfully implemented or is under investigation in various livestock breeding programmes (Carillier et al., Reference Carillier, Larroque, Palhière, Clément, Rupp and Robert-Granié2013; Meuwissen et al., Reference Meuwissen, Hayes and Goddard2013; Silva et al., Reference Silva, dos Santos, Boison, Utsunomiya, Carmo, Sonstegard, Cole and Van Tassell2014; Chesnais et al., Reference Chesnais, Cooper, Wiggans, Sargolzaei, Pryce and Miglior2016; Meuwissen et al., Reference Meuwissen, Hayes and Goddard2016; Brito et al., Reference Brito, Clarke, McEwan, Miller, Pickering, Bain, Dodds, Sargolzaei and Schenkel2017) and has also a great potential to play an important role in the pig industry (Lillehammer and Sonesson, Reference Lillehammer and Sonesson2011; Knol et al., Reference Knol, Nielsen and Knap2016). Genomic selection add most information for: (1) traits which recording is invasive such as meat quality, (2) diseases resistance, (3) maternal traits that cannot be recorded on males, (4) crossbred performance, which cannot be recorded on the purebred animals and (5) traits measured late-in-life (Knol et al., Reference Knol, Nielsen and Knap2016). Research on the applications of genomics in pig breeding started in 2009 with the development of the Illumina Porcine60K BeadChip (60 K; San Diego, CA, USA) containing 62 163 SNPs. After that, GeneSeek (Lansing, MI, USA) introduced the Genomic Profiler for Porcine (GGP-Porcine) high-density (HD) SNP panel that contains 70 231 SNPs (70 K). These HD SNP panels are important tools for obtaining faster genetic gains and increasing breeding value accuracy in pigs (Cleveland and Hickey, Reference Cleveland and Hickey2013). Grossi et al. (Reference Grossi, Jafarikia, Brito, Buzanskas, Sargolzaei and Schenkel2017) investigated crucial parameters (e.g. linkage disequilibrium and genetic diversity) for the implementation of GS in Canadian pigs and the results indicated that GS could be successfully implemented in Canadian pigs using a commercial HD SNP chip. However, the overall genotyping cost of the HD SNP chip (e.g. 60 K or 70 K) panels is still a limiting factor for implementation of GS in large scale, considering that each sow has two or more farrows per year with more than 10 piglets per litter and these are all selection candidates.
One feasible alternative to reduce genotyping costs is to genotype animals using a cheaper low-density (LD) SNP panel and expand it to an HD panel by accurately imputing the un-genotyped SNPs (Howie et al., Reference Howie, Donnelly and Marchini2009; Huang et al., Reference Huang, Hickey, Cleveland and Maltecca2012; Khatkar et al., Reference Khatkar, Moser, Hayes and Raadsma2012; Knol et al., Reference Knol, Nielsen and Knap2016). In brief, a reference population of usually key ancestors is genotyped with a HD panel in order to impute the HD genotypes of animals genotyped with a LD panel at a lower cost. The missing genotypes in the LD panel can be accurately imputed using software such as Beagle (Browning and Browning, Reference Browning and Browning2013), FImpute (Sargolzaei et al., Reference Sargolzaei, Chesnais and Schenkel2014), and Alphaimpute (Hickey et al., Reference Hickey, Kinghorn, Tier, van der Werf and Cleveland2012).
Accuracy of imputation is affected by several factors such as the size and structure of reference population, effective population size, marker allele frequencies, density of LD panels and the SNPs in the LD panel that relapse the HD panels in the reference population (Brøndum et al., Reference Brøndum, Rius-Vilarrasa, Strandén, Su, Guldbrandtsen, Fikse and Lund2011; Ma et al., Reference Ma, Brøndum, Zhang, Lund and Su2013; Badke et al., Reference Badke, Bates, Ernst, Fix and Steibel2014; Sargolzaei et al., Reference Sargolzaei, Chesnais and Schenkel2014). Huang et al. (Reference Huang, Hickey, Cleveland and Maltecca2012) studied the imputation performance when parents, grandparents and other relatives of the candidates are genotyped in a combination of different densities. They reported that the imputation accuracy can be as high as 96.7% for the animal to be imputed using an ultra-LD panel of 384 SNPs if the 2699 animals in the reference population are genotyped using the 60 K panel and includes both parents and all four grandparents. Cleveland and Hickey (Reference Cleveland and Hickey2013) also reported that when both parents and all four grandparents are genotyped using 60 K panel, the imputation accuracy rate can be as high as 96.3% for animals imputed using an LD panel containing 450 SNPs. In addition, Wellmann et al. (Reference Wellmann, Preuß, Tholen, Heinkel, Wimmers and Bennewitz2013) showed that imputing from a very small LD panel (384 SNPs) is a promising strategy if at least one parent is genotyped using the 60 K panel.
Despite the findings reported in these studies, they did not investigate various LD panels of increasing densities (i.e. a few chosen LD panels were used), which would give a systematic distribution of imputation accuracy in pigs. Furthermore, accuracy of imputation depends on the size of reference population (number of animals genotyped with HD panel) and can vary between populations, which highlights the need for more studies using large data sets (i.e. more in line with current practical scenarios) from different populations. The main end goal of generating imputed genotypes is to predict genomic breeding values more accurately, which depends not solely on the panel density, but also on population parameters (Meuwissen et al., Reference Meuwissen, Hayes and Goddard2016), making important to validate genomic predictions for economically important traits using different imputed genotypes in unrelated populations. Furthermore, the genotype data currently available in Canada were not specifically gathered to build a proper reference population for the purpose of improving the genotype imputation accuracy from an LD panel to an HD panel, as not all the parents of the selection candidates were genotyped.
An affordable LD panel that balance the tradeoffs among genotyping density, imputation accuracy, and accuracy of genomic predictions is not currently commercially available to the Canadian pig industry. Therefore, the main objectives of this study were to: (1) investigate the accuracy of genotype imputation under alternative scenarios and provide detailed information on the imputed genotypes in order to guide the development of an affordable LD panel that can widen GS applications in Canadian pigs; and (2) determine the impact of using imputed genotypes on accuracies of predicted genomic breeding values for various economically important traits. A large genotypic and phenotypic dataset for the most numerous pig breeds in North America was available for this study.
Material and methods
Genotypes and pedigree data
A total of 1378 Duroc (DU), 2361 Landrace (LA), and 3192 Yorkshire (YO) pigs born between 1998 and 2013 were genotyped using the Illumina Porcine SNP60K BeadChip (San Diego, CA, USA) consisting of 62 163 SNPs distributed throughout the genome. These animals were sampled from herds distributed across Canada, which are part of the Canadian Swine Improvement Program coordinated by the Canadian Centre for Swine Improvement (CCSI, www.ccsi.ca).
The genotyping quality control (QC) filtered out: (1) SNPs with more than 20% missing genotypes, (2) non-autosomal SNPs, (3) animals with call rate lower than 90%, (4) minor allele frequency (MAF) <1%, (5) excess of heterozygosity greater than 15% (Wiggans et al., Reference Wiggans, Sonstegard, VanRaden, Matukumalli, Schnabel, Taylor, Schenkel and Van Tassell2009), and (6) 603 SNPs that had unusual or unexpected linkage disequilibrium patterns (Grossi et al., Reference Grossi, Jafarikia, Brito, Buzanskas, Sargolzaei and Schenkel2017). After QC, the number of remaining SNPs was 38 942, 45 124 and 45 129 for DU, LA and YO, respectively. The pedigree files contained 10 752, 20 873 and 14 313 individuals, which spanned up to 40, 43 and 44 generations, for DU, YO and LA, respectively. The genotyped animals were from the most recent five, nine and 10 generations for DU, LA and YO, respectively.
Pseudo-phenotypes
Five economically important traits were chosen for the analyses of genomic predictions. The traits were: growth rate (GRATE), backfat thickness (BFAT) and loin muscle depth adjusted to 100 kg of live weight (loin depth, LOIND), loin intramuscular fat (LIMF) and total number of piglets born per litter (total born, TBORN). Growth rate (or age to 100 kg) is the number of days required to reach 100 kg. If weighed within a set weight range (75 to 140 kg), an animal’s age was adjusted to a 100 kg basis using the actual weight, age, breed and sex of the animal. Backfat thickness and LOIND were measured ultrasonically using a B-mode scanner on the live animal between the third and fourth last ribs, 5 cm from the midline. Loin intramuscular fat was also ultrasonically predicted by collecting eight images at the 10th rib. Total number of piglets born per litter was measured as the sum of piglets born alive and stillborn. Mummified piglets were excluded from the total. Estimated breeding values (EBVs) generated from routine genetic evaluations performed by CCSI were made available for this study. De-regressed estimated breeding values (dEBVs) for BFAT, GRATE, LIMF (DU animals), LOIND, and TBORN (LA and YO) were calculated using the method proposed by Garrick et al. (Reference Garrick, Taylor and Fernando2009) and used as pseudo-phenotype for the genomic estimated breeding value (GEBV) predictions.
Low-density genotyping panels
Nine incremental LD panels were created by masking SNPs originally present in the 60 K panel. The LD panels contained 300 (LD300), 502 (LD500), 802 (LD800), 1003 (LD1K), 2004 (LD2K), 2995 (LD3K), 4005 (LD4K) and 4998 (LD5K) SNPs (Supplementary Material Table S1). The other LD panel, labelled as LD7K, contained 7256 SNPs which overlapped between the GeneSeek GGP-Porcine 10 K SNP panel and the 60 K panel. For the other LD panels, the number of SNPs on a chromosome was proportional to the length of the chromosome for each size of LD panel. Supplementary Material Table S1 presents the number of SNPs selected for each chromosome and LD panel. Two alternatives to design the LD panels were investigated aiming to increase imputation accuracy, that is, evenly spaced and unevenly spaced SNP selection. For evenly spaced SNP selection, SNPs were selected to be evenly located throughout the chromosomes. For unevenly spaced SNPs a chromosome was divided into one middle zone and two-tail zones. The two-tail zones were the beginning (5%) and ending (5%) of chromosomal regions that represent 10% of the overall chromosome length. Single nucleotide polymorphism density was doubled or quadrupled in the two-tail zones and evenly spaced in the middle zone.
Grossi et al. (Reference Grossi, Jafarikia, Brito, Buzanskas, Sargolzaei and Schenkel2017) reported that in an evenly spaced LD5K the minimum distance between adjacent SNPs was 0.479 Mb and the average linkage disequilibrium (r 2) for the three studied breeds was smaller than 0.30 for SNPs spaced at distances higher than 0.45 Mb. Therefore, the linkage disequilibrium between any two consecutive SNPs in the LD panel was expected to be small and, thus, the linkage disequilibrium was ignored in the SNP selection process.
Genotype imputation
The population genotype imputation was implemented using the FImpute software (Sargolzaei et al., Reference Sargolzaei, Chesnais and Schenkel2014). FImpute software uses both the genealogy and population information for genotype phasing and imputation. By using different sizes of overlapping sliding windows for haplotypes, FImpute first phases animals with closest relationships (e.g. parent–offspring relationship) using long windows and then proceeds with distantly related animals using shorter windows. A haplotype library is built for phasing and imputation within each window. Each chromosome is swept thoroughly starting with a long window and then repeatedly with shrunken windows.
The imputation accuracy was assessed based on two metrics. Concordance rate (CR), where the imputed marker genotypes were compared with the actual marker genotypes present in the original 60 K panel and, thus, the proportion of genotypes that were imputed correctly or erroneously was calculated. Therefore, CR represents the proportion of correctly imputed genotypes. The squared allelic correlation (allelic r 2) was also calculated. Allelic r 2 was determined by the Pearson correlation between the allele dosage of the most likely imputed genotype and the allele dosage of the true genotype (Browning and Browning, Reference Browning and Browning2009).
Reference and validation populations to access imputation accuracy
The reference and validation populations were defined based on year of birth. The reference populations included animals born up to 2011, while animals born in 2012 and 2013 were included in the validation populations. The reference population sizes were 931, 1613 and 2103 for DU, LA and YO breeds, respectively, while the corresponding validation population sizes were 447, 748 and 1089.
To investigate the impact of reference population size on the imputation accuracy, 931 animals from the reference population of each of the LA and YO breeds were randomly selected to create smaller reference populations (same size than DU population). Hereafter, the original reference populations of LA (n=1613) and YO (n=2103) will be referred to as the full reference (FR) populations, and the smaller (n=931) reference populations will be referred to as the reduced reference (RR) populations. The influence of the reference population size on the imputation accuracy can then be investigated by comparing the original and the reduced reference populations within LA and YO breeds, respectively. On the other hand, the imputation performance can be fairly compared across three breeds when the reference population sizes are the same (n=931).
The availability of parental genotype information in the reference population increases the accuracy of imputation. On average, DU, LA and YO animals in the validation populations had 0.44, 0.84 and 0.76 parents (i.e. less than one parent per animal), respectively, in the reference population. In order to investigate the impact of the relatedness between the reference and validation populations on the imputation accuracy and precision of GEBV prediction within each breed, the validation population was further divided into three groups for each breed: animals with no parent, one parent or both parents in the reference population. Supplementary Material Table S2 details the number of animals and the corresponding percentage for each group in the validation population for each breed. The main objective of this analysis was to identify an LD panel as small as possible for genotyping a candidate for selection when both parents are genotyped using the HD panel, while at the same time maintain an acceptable imputation performance. The results were compared with respect to imputation accuracy and precision of GEBVs.
Prediction of genomic breeding values
The major reason for performing genotype imputation is to generate HD SNP data at a lower cost in order to enable prediction of GEBVs that are more accurate than estimates obtained from original LD panels. Therefore, predictions of GEBVs were compared using imputed or actual 60 K panel genotypes. The GBLUP method was used as proposed by VanRaden (Reference VanRaden2008) and was implemented via the GEBV software (Sargolzaei et al., Reference Sargolzaei, Schenkel and VanRaden2009).
Given that not all genotyped animals have dEBV information for all traits, the number of animals in the reference and validation populations for each trait was different (Supplementary Material Table S2). The average (±SD) size of reference populations was 828±81, 1434±237 and 1771±284 animals for DU, LA and YO, respectively. The average (±SD) size of validation populations was 375±93, 469±264 and 673±386 animals for DU, LA and YO, respectively. The average reliability (±SD), in percentage, of the estimated breeding values for the training populations for DU, LA and YO was: 54.40±11.22, 62.57±14.33 and 62.71±14.34 for GRATE; 69.47±9.71, 76.49±12.28 and 76.69±12.19 for BFAT; 51.07±11.68, 59.72±15.12 and 59.65±15.27 for LOIND; 55.51±14.90 for LIMF (only measured in DU); and, 46.55±19.08 and 47.43±19.66 for TBORN (only measured in LA and YO), respectively. The accuracies of genomic predictions were estimated as the Pearson correlation between GEBVs and dEBVs for the animals in the validation population for each breed. In order to assess bias of genomic predictions, the following regression model was used:
 $${\rm dEBV} \equals\, b_o+b_1 {\mib GEBV}+{\rm e},$$
where dEBVs are de-regressed estimated breeding values obtained from each genomic prediction scenario; b 0 the intercept; b 1 the linear regression coefficient indicating bias of predictions (regression coefficient equal to 1 indicates that estimates are neither inflated or deflated); GEBVs are the GEBVs; and e the residual. The usefulness of imputed genotypes was investigated by calculating the Pearson correlation between GEBVs predicted using the imputed 60 K genotypes (LD300 to LD7K SNPs) and the true 60 K genotypes.
Results
Assessment of genotyping imputation accuracy
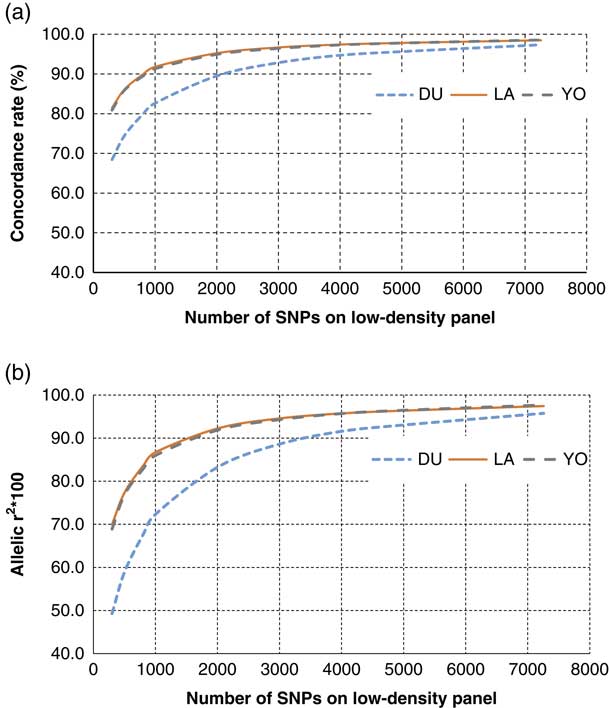
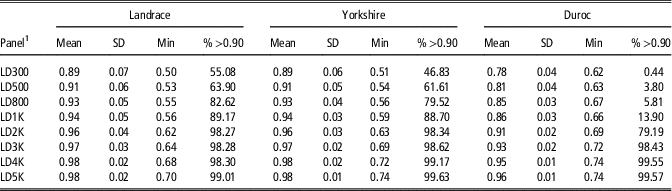
The LD panels: LD300, LD500, LD800, LD1K, LD2K, LD3K, LD4K, LD5K and LD7K (Supplementary Material Table S1) were imputed to 60 K panel. Figure 1 shows the imputation accuracy, in terms of CR and allelic r 2, for each of the different LD panels with evenly spaced SNPs for each breed. Concordance rates for the lowest-density panel (LD300) ranged from 68% (DU) to 81% (LA and YO) and for LD7K it ranged from 97% (DU) to 99% (LA and YO). Similar trends (but in slightly lower magnitude) were observed based on allelic r 2 and it ranged from 49% (DU) to 70% (LA) for the LD300 and from 96% (DU) and 98% (LA and YO) for LD7K (Figure 1). In general, as the LD panel density increased, the imputation accuracy rate increased as well, however, increase rates were substantially smaller for greater LD panel densities. For all breeds, the imputation accuracies increased substantially from LD300 to LD3K (CR from 68% to 93% for DU and from 81% to 96% for both LA and YO), and then the rates of increase in imputation accuracy diminished or became steady up to LD7K. As a similar trend was observed based on CR or allelic r 2, when the absolute values were not essential to compare scenarios, CR was used. However, the corresponding allelic r 2 were presented for completeness. As shown in Table 1, the proportion of animals with imputation accuracy higher than 0.90 was greater than 98% for all breeds when using genotypes imputed from LD3K or greater density. The accuracy of imputation per chromosome is also presented as Supplementary Material Table S3, which is a useful information when designing LD panels. Briefly, the average imputation accuracy per chromosome across traits, breeds and SNP panels was higher for chromosome 1 (0.94), 13 (0.94) and 2 (0.94), followed by chromosomes 14 (0.93), 7 (0.93), 9 (0.93), 17 (0.93), 15 (0.93), 4 (0.93), 16 (0.92), 8 (0.92), 3 (0.92), 5 (0.92), 11 (0.91), 6 (0.91), 10 (0.90), 12 (0.90) and 18 (0.90).
(colour online) Imputation accuracy in pigs measured as concordance rate (a) and allelic r 2 (b), of 60 K single nucleotide polymorphisms (SNP) panel from different evenly spaced low-density and 7 K SNP panels per breed. DU=Duroc; LA=Landrace; YO=Yorkshire.

Descriptive statistics of imputation accuracy in pigs based on individual animals

SD=standard deviation; Min: minimum imputation accuracy observed; %>0.90=percentage of animals with imputation accuracy higher than 0.90 (measured as concordance rate).
1 The low-density panels contained 300 (LD300), 502 (LD500), 802 (LD800), 1003 (LD1K), 2004 (LD2K), 2995 (LD3K), 4005 (LD4K) and 4998 (LD5K) markers.
When using the unevenly spaced SNP selection criteria, regardless of the double- or quadruple-spaced scenarios (i.e. SNP density was doubled or quadrupled in the two-tail zones and evenly spaced in the middle zone of the chromosomes), the imputation accuracy rates were largely similar as those using the evenly spaced SNPs panels (Supplementary Material Figure S1). For the lowest-density panels (i.e. LD300 and LD500), the evenly spaced panels performed even better than the unevenly spaced panels with a slightly higher imputation accuracy. Given this result, hereafter the focus will be solely on the scenarios with evenly spaced SNPs when investigating the impact of reference population size and the availability of parental information in the reference population on the imputation accuracy.
Impact of reference population size on imputation accuracy
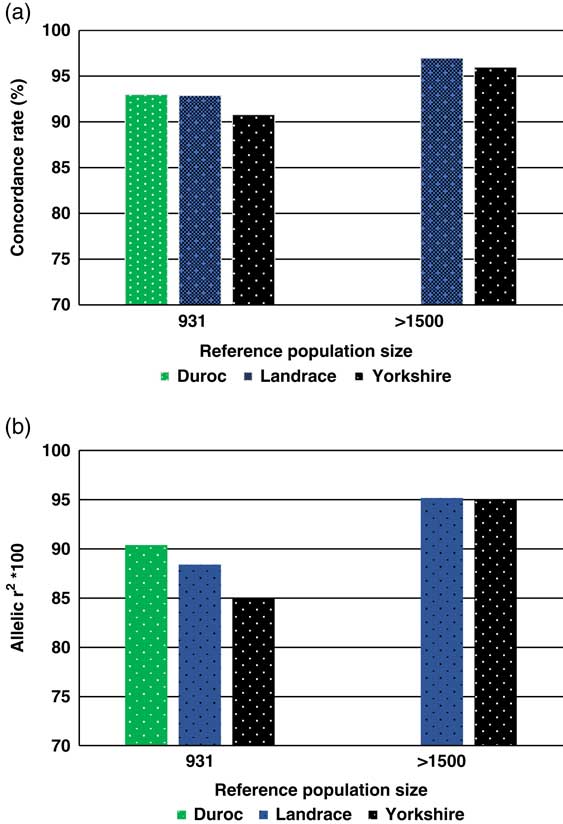
As expected, imputation accuracies when using the full reference populations were greater for LA and YO compared with DU, which had the smallest reference population size (n=931). For a LD panel with more than 2000 markers, the accuracy of imputation obtained for LA and YO was 90% or higher (based on CR or allelic r 2, Figure 1). However, for DU, LD panels of 3000 and 4000 SNPs were needed to yield similar imputation accuracy rates (Figure 1). Using the reduced reference populations and LD3K, imputation accuracies for LA dropped to a similar level compared with DU (~93% and ~89% based on CR and allelic r 2, respectively), while for YO the imputation accuracy was lower (~91% and ~85% based on CR and allelic r 2, respectively). Among the three breeds, YO had the largest number of animals (2103) in the full reference population, but the imputation accuracy rates for YO were consistently lower than those for LA. The DU breed also had fewer genotyped parents in the reference population, which could have contributed to the lower imputation accuracies observed here, as discussed later.
Impact of parental genotypes on imputation accuracy
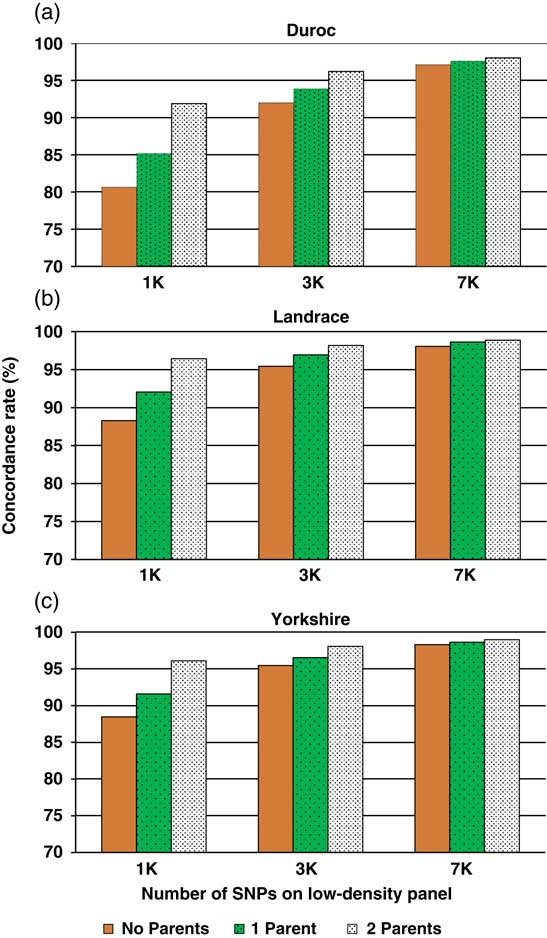
The strategy to genotype Canadian pigs did not take into account the population structure that would maximize imputation accuracy. For instance, 61% (DU), 43% (LA) and 48% (YO) of the individuals in the validation populations did not have any of its parents in the reference population (Supplementary Material Table S4). Figure 2 presents the imputation accuracies for LD1K, LD3K and LD7K panels when no parent, one parent or two parents were included in the reference population. For each LD panel, the imputation accuracy was generally higher when more parental genotype information was available. For LD1K, and when both parents were in the reference population, the imputation accuracies were 92%, 96% and 96% for DU, LA and YO breeds, respectively. When there were no parents included in the reference population, the corresponding imputation accuracies dropped to 81%, 88% and 88%, respectively. The improvement in imputation accuracy with the inclusion of parental genotypes in the reference population was smaller when using a larger-density LD panel (i.e. LD3K or LD7K, Figure 2) and for LD7K, the improvement was not clear.
(colour online) Average imputation accuracy of a 60 K panel from 1 K (LD1K), 3 K (LD3K), or 7 K (LD7K) panel when two, one, or no genotyped parents were in the reference population of Duroc (a), Landrace (b) and Yorkshire (c) Canadian pigs.

Genomic breeding value predictions
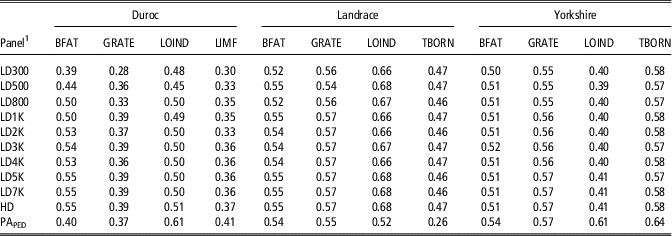
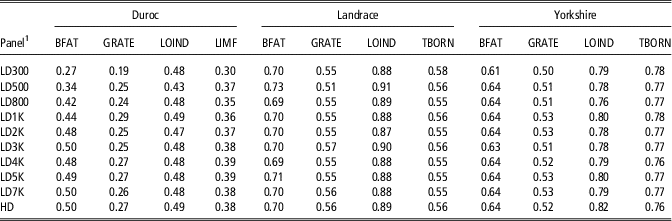
The genomic prediction accuracies (Table 2) for DU, LA and YO, when using the actual HD genotypes were 0.55, 0.55 and 0.51, respectively, for BFAT; 0.39, 0.57 and 0.57 for GRATE; 0.51, 0.68 and 0.41 for LOIND; 0.37 for LIMF (only DU); and, 0.47 and 0.58 for TBORN (only for LA and YO breeds, respectively). The accuracies of predictions were similar across breeds, but tended to be higher for LA and YO, which had larger reference populations. The average (±SD) accuracy of genomic prediction across traits and breeds was 0.52±0.08 compared with 0.50±0.11, when using solely pedigree information. The regression coefficients (slope) of the dEBVs on the GEBVs (Table 3) ranged from 0.19 (GRATE in DU) to 0.91 (LOIND in LA). In general, smaller regression coefficients were observed for genotypes imputed from lower density panels, but the differences were very small.
Accuracies of genomic prediction (GEBVs) and parent average (PAPED, calculated based on pedigree and phenotypic information) for growth rate (GRATE), backfat thickness (BFAT) and loin muscle depth adjusted to 100 kg of live weight (loin depth, LOIND), loin intramuscular fat (LIMF) and total number of piglets born per litter (total born, TBORN) for Canadian Duroc, Landrace and Yorkshire pigs

HD=high-density panel.
1 The low-density panels contained 300 (LD300), 502 (LD500), 802 (LD800), 1003 (LD1K), 2004 (LD2K), 2995 (LD3K), 4005 (LD4K), 4998 (LD5K) and 7256 (LD7K) markers.
Regression coefficient (slope) of the de-regressed estimated breeding values on the genomic estimated breeding values for growth rate (GRATE), backfat thickness (BFAT) and loin muscle depth adjusted to 100 kg of live weight (loin depth, LOIND), loin intramuscular fat (LIMF) and total number of piglets born per litter (total born, TBORN) for Canadian Duroc, Landrace and Yorkshire pigs

HD=high-density panel.
1 The low-density panels contained 300 (LD300), 502 (LD500), 802 (LD800), 1003 (LD1K), 2004 (LD2K), 2995 (LD3K), 4005 (LD4K), 4998 (LD5K) and 7256 (LD7K) markers.
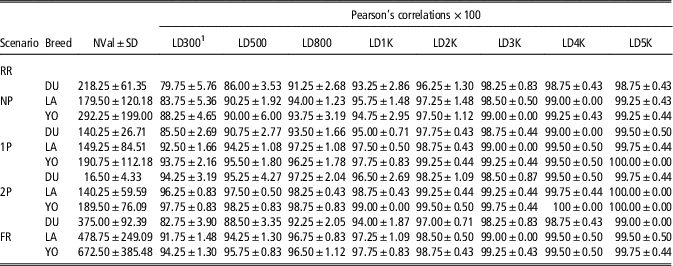
The correlations between predicted GEBVs using the actual 60 K panel genotypes and the predicted GEBVs using the imputed 60 K genotypes from LD300 to LD5K are shown in Table 4 and Supplementary Material Table S5 for all breeds and all traits. The average correlations were greater than 0.93 for all breeds when using LD1K or a higher density panel. As expected, the correlations were generally higher when using a denser LD panel. However, there were some exceptions, particularly when the validation population size was small. For instance, for the DU validation population that contained only 19 animals that have both parents in the reference population, the correlations fluctuated when using the smaller LD panels (LD300 to LD2K) for BFAT (Supplementary Material Table S5). In general, as the density of the LD panel increased, the correlation values stabilized and converged to a correlation of 0.99 for all breeds and traits.
Average (across five traits) of Pearson’s correlation between genomic estimated breeding values (GEBVs) from imputed (from evenly spaced low-density panels) and from actual 60 K genotypes when two, one or none parents were included in the reduced reference population and Pearson’s correlation for the full reference population in Duroc (DU), Landrace (LA) and Yorkshire (YO) pigs

RR=reduced reference population (the same size for all breeds); NP=no parents of validation animals in the reference population; 1P=one parent in the reference population; 2P=both parents in the reference population; FR=full reference population; NVal=number of individuals in the validation population; SD=standard deviation.
1 The low-density panels contained 300 (LD300), 502 (LD500), 802 (LD800), 1003 (LD1K), 2004 (LD2K), 2995 (LD3K), 4005 (LD4K) and 4998 (LD5K) markers.
The performance of GEBV predictions was generally better when more parental genotypes were in the reference population. However, the improvement from using the parental information became smaller as the LD panel density increased. When the LD panel had at least 3000 SNPs (e.g. LD3K), the gaps between genotyped markers were smaller (data not shown), and therefore, the additional information from the parental genotype in the reference population became less crucial for improving the precision of the GEBV prediction. This conjecture seems to be supported by the fact that all the correlations for higher density LD panels (⩾LD3K) were <0.97 regardless of the availability of parental genotype information (Supplementary Material Table S5), that is, at least 94% of the variance in the GEBVs from actual 60 K genotypes were explained by the GEBVs from imputed genotypes for the three breeds and all traits.
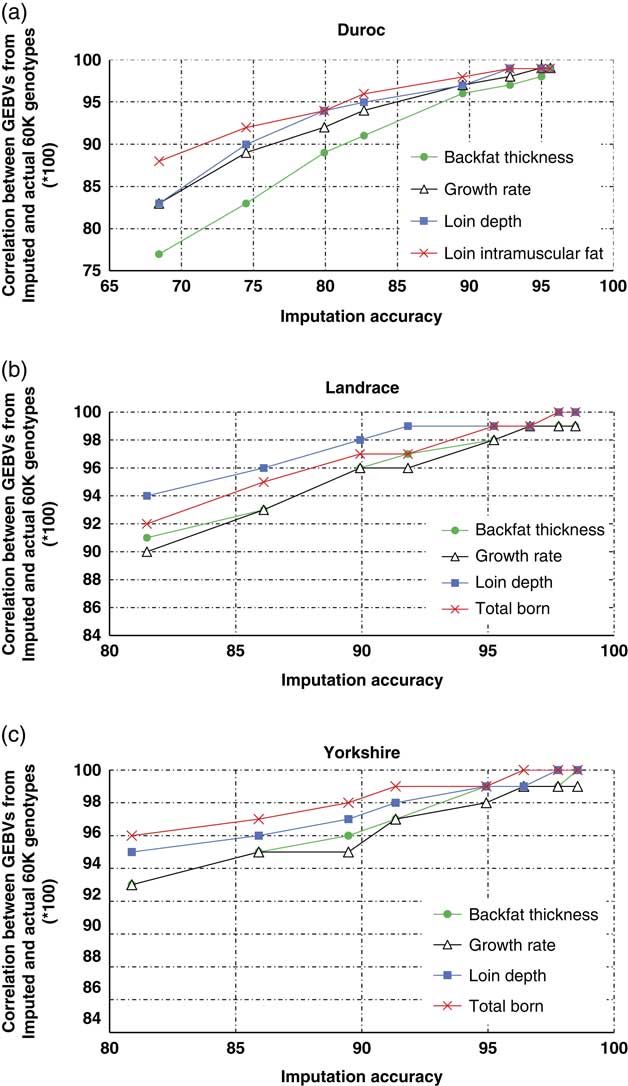
Figure 3 shows the correlations of the GEBVs predicted using the actual 60 K panel genotypes and the imputed genotypes against the levels of imputation accuracy. Overall, the correlations improved as the imputation accuracies increased for all breeds and traits.
(colour online) Imputation accuracy v. the correlation between genomic predictions using imputed (from evenly spaced low-density panel) and actual 60 K single nucleotide polymorphisms (SNP) genotypes in Duroc (a), Landrace (b) and Yorkshire (c) pigs.

Discussion
Previous studies have shown that using dense SNP panels for genomic evaluation will increase the breeding value prediction accuracies in pigs (Cleveland et al., Reference Cleveland, Hickey and Forni2012; Cleveland and Hickey, Reference Cleveland and Hickey2013; Knol et al., Reference Knol, Nielsen and Knap2016). However, genotyping costs of HD panels remain a significant barrier for the adoption of genomics by the industry (Cleveland and Hickey, Reference Cleveland and Hickey2013). Therefore, genotype imputation using various LD panels and subsequent GEBV prediction was compared with the GEBV prediction from actual HD panel genotypes in this study, aiming to envision genotyping strategies to reduce genotyping costs and thus accelerate the uptake of the GS by the pig industry. The evaluation of various LD panels with decreasing densities in this study allowed to assess the trend in imputation accuracy in pigs as less dense panels were used, which has not been reported before. This also allowed to evaluate the tradeoff between the imputation accuracy resulting from different panel densities and the precision of the corresponding GEBV predictions for various economically important traits in three important breeds. The most important factors that influence imputation accuracy are the size of the reference population and the relationship between the reference and target populations (He et al., Reference He, Wang, Fu, Ding and Zhang2015). As expected, when increasing the reference population size, greater imputation accuracies were observed for the alternate LD panels (Figure 4). This indicates the need of maintaining a reasonable sized reference population for the purpose of imputing from LD panels.
(colour online) Average imputation accuracy in pigs, measured as concordance rate (a) and allelic r 2 (b), of a 60 K single nucleotide polymorphisms (SNP) panel from a 3 K panel, considering different reference population sizes.

As the density of LD panels increases, greater genotype imputation accuracies were observed. However, the ideal LD density might vary among species and breeds (or even lines). For instance, in dairy cattle, it was recommended to genotype animals on a panel denser than 3 K (e.g. LD7K) to obtain sufficiently accurate imputed genotypes (Ma et al., Reference Ma, Brøndum, Zhang, Lund and Su2013; Weng et al., Reference Weng, Zhang, Zhang, Fu, He and Ding2013). In chickens, Wang et al. (Reference Wang, Habier, Peiris, Wolc, Kranis, Watson, Avendano, Garrick, Fernando, Lamont and Dekkers2013) reported that in a pedigreed population, GS could be implemented by genotyping selection candidates with panels containing about 400 evenly spaced markers with <6% loss in accuracy. In pigs, the current study indicated that a 3 K panel would be sufficient to obtain accurately imputed SNP genotypes, which would yield GEBV highly correlated to GEBVs from actual 60 K SNP panel genotypes for selection candidates and the high imputation accuracy was consistent among the whole population, in which more than 98% of imputed genotypes had accuracies >0.90. However, an increase in the LD panel density would still increase the imputation accuracy in a smaller rate, but would have much lower impact on GEBV correlation with the one from actual 60 K genotypes. These results are in agreement with other studies (e.g. Wellmann et al., Reference Wellmann, Preuß, Tholen, Heinkel, Wimmers and Bennewitz2013), which, however, did not investigate the trend on increasing panel density. The decision of using a 3 K or higher density panel should be based on the cost-effectiveness analysis and the availability of parental HD genotypes, which should be the focus of a follow-up study. There are alternative ways to design LD panels. For instance, Badke et al. (Reference Badke, Bates, Ernst, Schwab, Fix, Tassell and Steibel2013) investigated LD tagSNP (average distance between tagSNP from 100 kb to 1 Mb) sets in pigs, selected using linkage disequilibrium information, physical location, or accuracy for genotype imputation. They reported that TagSNP density of at least 1 tagSNP per 340 kb (~7000 tagSNP) selected using pairwise LD information was necessary to achieve average imputation accuracy higher than 0.95. Grossi et al. (Reference Grossi, Jafarikia, Brito, Buzanskas, Sargolzaei and Schenkel2017) reported that in an evenly spaced LD5K the minimum distance between adjacent SNPs was 0.479 Mb and the average linkage disequilibrium for the three studied breeds was smaller than 0.30 for SNPs spaced at distances higher than 0.45 Mb. Therefore, the linkage disequilibrium between any two consecutive SNPs in the LD panel was expected to be small and, thus, the linkage disequilibrium was ignored in the SNP selection process.
Depending on the genomic relationship among breeds and/or lines, using a mixed reference population for genotyping imputation could produce a slightly better imputation accuracy in some scenarios (Ventura et al., Reference Ventura, Miller, Dodds, Auvray, Lee, Bixley, Clarke and McEwan2016). In this study, within-breed analyses were performed and it was observed that LD3K was sufficient to yield a satisfactory accuracy under the scenarios that were investigated. It means that in practice, this panel size would result in even better accuracies of imputation, as all animals will be used in the reference population. For commercial applications, it is most likely that within-breed imputation will be performed, however, the results presented here are the lower limit of what would be expected if using multi-breed reference populations, which is a useful information for breeding companies.
The impact of including genotyped parents in the reference population on imputation accuracy was also investigated. As expected, imputation accuracy was higher when more parental information was available (Figure 2). For the reduced reference populations similar imputation accuracy was observed for DU and LA (Figure 2) most likely due to stronger linkage disequilibrium across the genome in DU compared with LA (Grossi et al., Reference Grossi, Jafarikia, Brito, Buzanskas, Sargolzaei and Schenkel2017), what possibly compensated the lower amount of parental information in the reference population of DU. Despite the similar pattern and level of linkage disequilibrium observed in LA and YO (Grossi et al., Reference Grossi, Jafarikia, Brito, Buzanskas, Sargolzaei and Schenkel2017), a lower imputation accuracy was observed for YO. This might be due to the fact that YO had less parental information in the reference population compared with LA. Genomic selection using imputed genotypes might reduce genetic diversity of the population, if not performed adequately, by favoring selection candidates more related to the reference population, which might include close relatives. However, we observed that >98% of animals had accuracy of imputation >0.90 when using the LD3K or a denser panel, indicating that the relatedness with the reference population and the corresponding imputation accuracy should not lead to a selection biased towards related individuals.
Overall, the observed imputation accuracies in this study were comparable with those reported by Cleveland and Hickey (Reference Cleveland and Hickey2013), Huang et al. (Reference Huang, Hickey, Cleveland and Maltecca2012) and Wellmann et al. (Reference Wellmann, Preuß, Tholen, Heinkel, Wimmers and Bennewitz2013). However, these studies had at least one parental genotype available in the reference population per animal in the validation population, while in the current study the average number of genotyped parents in the reference population was less than one for the three breeds about 50% of the animals in the validation population did not have any of the parents genotyped. Despite the similar performance of genomic and pedigree-based predictions, it is important to note that genomic predictions enable selection within-litter, while by using EBVs (or parent average for young animals) this would not be possible, as all siblings in a litter would have the same estimated breeding value.
Findings from this study are encouraging. Results showed that most of the genotype information contained in the 60 K panel can be determined by imputing the un-genotyped SNPs from LD panels. The ultimate goal of imputation is to allow for genomic evaluation by predicting the GEBV based on the imputed HD panel. This study showed that GEBV could be predicted based on the imputed genotypes from the LD3K panel with a correlation of 0.97 compared with the GEBVs predicted based on the actual 60 K panel for all the three breeds and all traits. This finding means that 94% of the variation in the GEBVs from actual 60 K genotypes would be explained by the GEBVs from imputed genotypes. Huang et al. (Reference Huang, Hickey, Cleveland and Maltecca2012) and Cleveland and Hickey (Reference Cleveland and Hickey2013) showed that the accuracy of imputation and GEBV prediction from imputed genotypes depends on the density of the LD panel and population structure. These studies suggested that strategies for selecting candidates for genotyping and determining an adequate LD panel density were required to reap the benefits of genomics. Wellmann et al. (Reference Wellmann, Preuß, Tholen, Heinkel, Wimmers and Bennewitz2013) suggested that genotyping selection candidates using a very LD panel (384 SNPs) with at least one of the parents genotyped with an HD panel could be a feasible alternative to reduce genotyping costs for implementing GS in pigs. Huang et al. (Reference Huang, Hickey, Cleveland and Maltecca2012) recommended to genotype the sires using HD panels, dams using LD panels (e.g. 3 K SNP), and young candidates using a panel consisting of 384 SNPs. Lillehammer and Sonesson (Reference Lillehammer and Sonesson2011) proposed genotyping dams using HD panels if the genetic progress on maternal traits is the main interest rather than the production traits. In the current study, if genotype information for both parents was available in the reference population, an LD panel of as low as 300 SNPs would yield predicted GEBVs with a correlation of at least 0.90 with GEBV predicted from the actual 60 K panel (Supplementary Material Table S5) and with an average correlation of 0.96 across all traits and breeds (Table 4). Therefore, when genotype information for both parents is available, it seems that the panel density might be further lowered to even 300 SNPs while at the same time maintaining a fairly accurate GEBV prediction compared with GEBVs derived from actual 60 K genotypes.
As presented in Figure 3, there was generally a positive quadratic trend (average R 2±SD: 0.98±0.01 across traits and breeds) between the imputation accuracies and the magnitude of the correlations between GEBVs from imputed genotypes and the GEBVs from actual 60 K genotypes. The results for LD7K in the current study are similar to the findings by Badke et al. (Reference Badke, Bates, Ernst, Fix and Steibel2014), who investigated GEBV prediction in YO based on the 60 K imputed panel from an 7 K LD panel. Based on our findings, imputed genotypes have great value for genomic prediction of breeding values. This was also confirmed by performing genomic predictions using the actual LD panels (i.e. not imputed to 60 K panel). Their GEBV accuracies were on average, across traits and scenarios, 21% less accurate than by using imputed genotypes (data not shown).
As reviewed by Calus et al. (Reference Calus, Bouwman, Hickey, Veerkamp and Mulder2014), there are various ways to assess imputation accuracy such as CR and allelic r 2. CR, which represents the proportion of correctly imputed genotypes, can be inflated by low MAF of the imputed SNPs. In this study, despite the slightly lower values for allelic r 2 compared with CR, a similar trend was observed with respect to the imputation accuracy obtained from the alternative LD panels considered and all interpretations were the same when using either metric.
In summary, this study provides a general guideline to the swine industry for the overall benefit and tradeoffs of the use of imputation for GS. Different scenarios with respect of densities of LD panels and number of parents genotyped and included in the reference population were evaluated in the three major commercial breeds in Canada. For a small reference population size with no parents on reference population, it is recommended the use of a panel at least as dense as the LD3K and, when there are two parents in the reference population, a panel as small as the LD300 might be a feasible option. These LD panels should allow for obtaining fairly high imputation accuracies and, subsequently, predict GEBVs highly correlated to GEBVs from actual 60 K SNP panel genotypes. Results also indicate that enlarging the reference population would be beneficial for increasing accuracy of imputation and, consequently, the accuracy of GEBV prediction, particularly for DU. Further studies will investigate the use of LD panels for screening of piglets within litters as potential selection candidates.
Acknowledgements
The authors thank the Natural Sciences and Engineering Research Council of Canada – Engage Grant program for financial support. The authors also express their appreciation for the support and collaborations with the following organizations: Atlantic Swine Centre, Ontario Swine Improvement, Western Swine Testing Association, PigGen Canada, Canadian Swine Research and Development Cluster (Swine Innovation Porc), Growing Canadian Agri-Innovation Program, Canadian Agri-Science Cluster Initiative of Agriculture, Agri-Food Canada (AAFC), Ministère de l’Agriculture, des Pêcheries et de l’Alimentation du Québec (MAPAQ), Fédération des producteurs de porcs du Québec (FPPQ), and Agriculture Adaptation Councils of Québec, New Brunswick, Nova Scotia, Manitoba, and Ontario. Breeders who actively participated in the project and provided their valuable time, animal information, and support in various project activities are also greatly acknowledged by the authors.
Declaration of interest
The authors declare they have no competing interests.
Ethics statement
The animals included in this study were managed in accordance with the Code of practice for the care and handling of pigs (National Farm Animal Care Council, NFACC, 2017). All the samples were collected from commercial farms and the animal owners agreed to be involved in the project. Samples were collected by well-trained staff following industry best practices.
Software and data repository resources
The data supporting the results of this article are included within the article and in its supplementary files. The raw data cannot be made available, as it is property of the Canadian pig producers and this information is commercially sensitive.
Supplementary material
To view supplementary material for this article, please visit https://doi.org/10.1017/S175173111800085X