Introduction
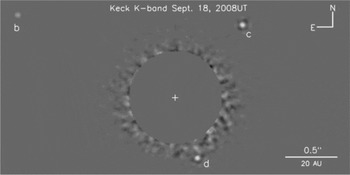
The first confirmed discoveries of directly imaged exoplanets were announced in late 2008 (Kalas et al. Reference Kalas, Graham, Chiang, Fitzgerald, Clampin, Kite, Stapelfeldt, Marois and Krist2008; Marois et al. Reference Marois, Macintosh, Barman, Zuckerman, Song, Patience, Lafreniėre and Doyon2008). Of the two directly imaged systems announced at that time, the planets of HR8799 evoked the most excitement. Near-infrared imaging of the system revealed a family of three giant planets, each believed to be significantly more massive than Jupiter (see Fig. 1 from Marois et al. Reference Marois, Macintosh, Barman, Zuckerman, Song, Patience, Lafreniėre and Doyon2008, hereafter M08). Since their discovery, there have been extensive discussions of both the observed properties of the planets (Goździewski & Migaszewski Reference Goździewski and Migaszewski2009; Fabrycky & Murray-Clay Reference Fabrycky and Murray-Clay2010) and the accompanying dust disc (Reidemeister et al. Reference Reidemeister, Krivov, Schmidt, Fiedler, Müller, Löhne and Neuhaüser2009; Su et al. Reference Su, Rieke, Stapelfeldt, Malhotra, Bryden, Smith, Misselt, Moro-Martin and Williams2009), which was first discovered by the Infrared Astronomical Satellite (IRAS) in 1983 (Rhee et al. Reference Rhee, Song, Zuckerman and McElwain2007).
Image of the three planets orbiting HR8799 (position marked by white cross) produced from Keck Ks band near infrared images (taken from M08).

A number of factors can influence planetary habitability, as discussed in the review by Horner & Jones (Reference Horner and Jones2010), elsewhere in these proceedings. One important prerequisite for the development of life is the long-term stability of the planetary system within which a habitable exoplanet resides. There are currently over 40 known multiple exoplanet systemsFootnote 1 (such as the five planets around the multiple star 55 Cancri, the three around Upsilon Andromedae and the three around Gliese 876), and the fine details of the dynamical evolution of such systems will undoubtedly play a pivotal role in determining the habitability of any as yet undetected telluric worlds within the classical ‘habitable zone’ of those systems (Jones et al. Reference Jones, Sleep and Underwood2006). A stable climate and relatively quiescent impact regime are thought to be important prerequisites for the development of life, and both these factors depend upon the stability of the planetary system in question. To illustrate this, let us provide an example from the history of our own Solar System, which highlights the effect instabilities can have on the impact flux through the habitable zone.
Despite the current stability of the Solar System, evidence of much higher impact rates from the cratering record of planetary (and lunar) surfaces imply a more turbulent past. In particular, there is a significant weight of evidence that the impact flux around 700 Myr after the formation of the Solar System was particularly high. This marks the time at which the lunar mare were formed, and seems to have been a period of exceptionally high impact rates throughout the inner Solar System. There is still some debate as to whether this event was simply the tail of the ongoing accretion process that formed the planets, a discrete pulse of late impacts. The latter scenario is currently favoured, and the event itself is therefore called the ‘Late Heavy Bombardment’ (hereafter LHB). A variety of scenarios have been proposed to explain the bombardment, but the most promising involve the destabilization of the asteroid belt, Jovian and Neptunian Trojans and the trans-Neptunian region as a result of a catastrophic rearrangement of the orbits of the outer planets. The details of this model are elaborated in a number of papers (e.g. Gomes et al. Reference Gomes, Levison, Tsiganis and Morbidelli2005; Morbidelli & Levison Reference Morbidelli and Levison2006), but the basic scenario is that the four outer planets formed in a significantly more compact configuration than they are currently found. Indeed, some of the model solutions proposed invoke a system in which the initial planetary order was Jupiter, Neptune, Uranus and Saturn (from innermost to outermost). As the final stages of planetary formation came to an end, these planets were on fairly stable near-circular orbits, so constrained that Jupiter and Saturn orbited closer to one-another than the location of their mutual 2:1 mean motion resonance (MMR). Over time, as the planets continued to remove smaller objects from the outer Solar System, they migrated, with Jupiter shifting slightly inward, and Saturn evolving outward. Eventually, the two approached their mutual 2:1 MMR, which destabilized both their orbits and those of Uranus and Neptune. The two smaller planets were ejected to the massive trans-Saturnian disk, the population of which was hugely disrupted, leading to a greatly enhanced flux of material inward to the inner Solar System. The disk of material to which the planets were flung was massive enough that their orbits were re-circularized by the damping effects of dynamical friction, leaving the widely spaced outer Solar System we see today. At the same time, the effect of the chaotic evolution of the planetary orbits would have led to significant destabilization of the asteroid belt and the planetary Trojans, adding further to the flux of debris passing into the inner Solar System. The destabilized material was removed from the system on astronomically short timescales, as it was either ejected from the Solar System, or collided with the planets or the Sun, and collision rates fell to levels similar to those observed today.
It is clear, then, that the stability of the giant planets in a system that houses an Earth-like planet can play a pivotal role in determining the habitability of that world. It is therefore of particular interest to examine the stability of confirmed multiple-planet systems as they are discovered, particularly if that system should be found to host significant debris disks in addition to its planetary members. Following on from the discovery of HR8799's debris disk by the IRAS, more recent observations carried out by Spitzer (Su et al. Reference Su, Rieke, Stapelfeldt, Malhotra, Bryden, Smith, Misselt, Moro-Martin and Williams2009) identified three discrete components of the system's debris disc – a broad region of warm dust (T~150 K) orbiting closer to the parent star than the innermost planet; a broad disk of cold dust (T~45 K) with a sharp inner edge beyond the orbit of the outermost planet; and a marked halo of small dust grains thought to originate within the cold dust belt. Superficially, then, it seems that the system might resemble our early Solar System, with the inner debris disk resembling the asteroid belt, and the outer the trans-Neptunian disk. The quantity of short-lived dust in the system has been presented as evidence that it could currently be experiencing significant dynamical instability, similar to that proposed to explain the LHB. Such instability would result in significant and rapid dynamical stirring of the circumstellar disc (particularly by the outermost planet), and the resultant collisional grinding and destabilization of the disc would seem to provide a reasonable explanation of the observed dust grain distributions. This scenario resembles models put forward to explain the putative LHB of the terrestrial planets in our own Solar System.
Previous work on the HR8799 system has concentrated on investigating the impact of the planetary masses and their orbital separations on the dynamical stability of the system, studying variations in the individual planetary masses and the inclination of the system. Here, we take an alternative approach, assuming that the HR8799 system is presented face-on, and taking the planetary masses to be those derived photometrically in M08. We then investigate the stability of the system as a function of the eccentricity and semi-major axes of the planetary orbits.
Modelling
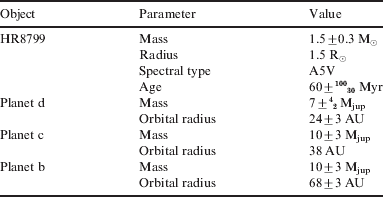
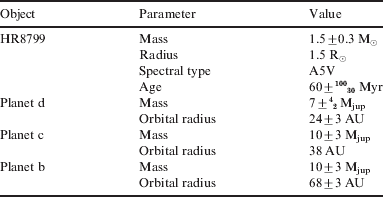
Dynamical simulations of the HR8799 system were run using the MERCURY numerical integrator (Chambers Reference Chambers1999). Using the observed orbital radii and photometric masses from M08 as a starting point for our calculations (as detailed in Table 1), we created 119 070 independent dynamical integrations (10 repetitions of 11 907 architectures), each following the evolution of one particular planetary architecture for a period of one million years. The orbital radius of the middle planet (HR8799c, 38 AU) was held constant throughout, while the radii of the inner (HR8799d, 24 AU) and outer (HR8799b, 68 AU) planets were systematically and independently varied in 0.15 AU steps over a range spanning ±1.5 AU on either side of the nominal orbit, giving a total of 21 possible initial radial locations for each of the inner and outer planets. All combinations of these parameters were tested, giving a total of 212=441 initial semi-major axis architectures. On top of this, the eccentricity of each planet was varied to simulate initial orbits of low (0.01), moderate (0.08) and high (0.2) eccentricity. For each architecture, 10 independent integrations were performed in which the initial location of each planet upon its orbit (as determined by their mean anomaly, M) was independently randomly determined in the range 0–360°. In each integration, the fate of each planet was followed: whether it survived until completion of the run; collided with another planet; or was ejected from the system. Regardless of collisions/ejections, each integration ran for 1 Myr.
Summary of the stellar and planetary properties used in our simulations. In our simulations the planetary masses were fixed at the observed values, and the initial orbital radius of the middle planet was similarly held constant
The planetary lifetimes in each simulation were extracted from the events log of each simulation, recording the fate (survival; collision with star/planet; or ejection) and when that fate occurred. An exponential decay curve fitted to the 10 iterations of each set of initial conditions was used to calculate a ‘stability lifetime’ for that set of conditions. Some of the eccentricity combinations produced architectures where all 10 iterations were stable for the full period of integration. In these cases, the simulations were tested for stability by comparing the initial and final orbital radii and eccentricities.
Results
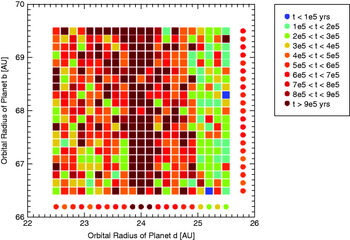
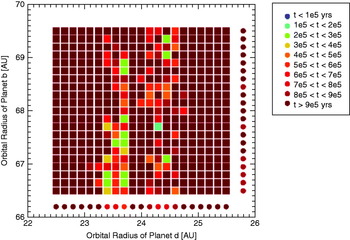
Figures 2 and 3 illustrate the mean lifetime for each combination of initial a and e averaged over all 10 iterations. From these figures, it is clear that our dynamical simulations show several clear trends. We find the stability of the system to be dominated by the inner pair of planets, as evidenced by the strong vertical structure in the stability plots (see Fig. 2). This would be expected, since the timescale for dynamical evolution is shorter for these planets, as their smaller orbital periods cause them to undergo more encounters than the outer pair.
Plots show the stability of the three-planet HR8799 system as a function of the semi-major axis of the innermost planet (x-axis) and outermost planet (y-axis). Bluer colours denote weaker system stability. The ‘dots’ at the end of each row/column show the mean stability for all objects along that row/column, in order to ease the identification of the band of (in)stability that results purely from the location of one of the planets. In this case, the inner planet has high initial e (0.2) whilst the other two have low initial e (0.01) values. The initial semi-major axis of the centre planet was fixed at 38 AU. The semi-major axis of the innermost planet was varied in 0.15 AU steps between 22.5 and 25.5 AU, and the outermost was varied between 66.5 and 69.5 AU, again in 0.15 AU steps. Each possible combination of locations was the subject of 10 independent integrations, each with the initial mean anomalies of the planets randomly assigned between 0 and 360 degrees. The relative stability of each combination is calculated by examining the times at which one or more of the planets are either ejected from the system or collide with one another or the central body. The 10 system lifetimes are then combined to determine the overall stability for that combination of initial conditions.

Plot showing the stability of the three-planet HR8799 system as a function of the semi-major axis of the innermost planet (x-axis) and outermost planet (y-axis). Bluer colours denote weaker system stability. The ‘dots’ at the end of each row/column show the mean stability for all objects along that row/column, in order to ease the identification of band of (in)stability that results purely from the location of one of the planets. In this case, the outer planet had a high initial e and the other two have low initial e values. The initial semi-major axis of the centre planet was fixed at 38 AU. The semi-major axis of the innermost planet was varied in 0.15 AU steps between 22.5 and 25.5 AU, and the outermost was varied between 66.5 and 69.5 AU, again in 0.15 AU steps. Each possible combination of locations was the subject of 10 independent integrations, each with the initial mean anomalies of the planets randomly assigned between 0 and 360 degrees. The relative stability of each combination is calculated by examining the times at which one or more of the planets are either ejected from the system or collide with one another or the central body. The 10 system lifetimes are then combined to determine the overall stability for that combination of initial conditions.

The inner pair of planets is more stable for all combinations of eccentricity when the initial orbital radius of the inner planet is located interior to the location of the 1:2 MMR, implying that the 1:2 MMR has a stabilizing effect on the orbit of the innermost planet. The 1:2 MMR between the inner planets is therefore the region of greatest stability for the system.
There is no strong indication that the outer pair of planets has an appreciable effect on the stability of the system. This may be a result of the short (compared to the system lifetime) duration of the integrations we have run here (remember, the outermost planet only completes a quarter the number of orbits of the innermost planet, meaning that everything happens more slowly), or a reflection of the relatively weak influence of the outermost planet on the much closer inner two (orbiting at 24, 38 and 68 AU, respectively).
We find that there is a general trend for the eccentricities to increase over the period of the simulation, showing that even the apparently ‘stable’ scenarios are undergoing gradual dynamical stirring. It seems plausible that, should this trend continue, the orbits of the planets would eventually become mutually encountering, leading to the destabilization of these systems on significantly longer timescales than those considered in this work. However, the distribution of the fractional change in orbital radius for systems where none of the planets has a high initial eccentricity can be seen to remain closely distributed around the initial value. This is consistent with the planets occupying relatively stable orbits, and implies that these architectures are stable over timescales >1 Myr.
Discussion
In our simulations of the HR8799 system, we have assumed that the planets are orientated face-on to us (i sys=0°), in a coplanar system, and that the masses and orbital radii of the planets are those derived from astrometry and photometry by M08. In Fabrycky & Murray-Clay (Reference Fabrycky and Murray-Clay2010), no stable solutions are found over the 160 Myr lifetime of the three-planet system with these same assumptions. By introducing small eccentricities to the orbits of the planets, we have shown that the lifetime of the system can be directly increased by a factor of 10 and could be expected to remain stable over periods of several Gyr (based on extrapolation from the system survival rates).
At low and medium eccentricities, we find large areas of the parameter space that are stable for 1 Myr in all 10 iterations of the system architecture. This is in agreement with the study by Goździewski & Migaszewski (Reference Goździewski and Migaszewski2009). We find agreement between our results and their best-fit model III for a three-planet system with moderately eccentric orbits. In their model III, both the inner and middle and middle and outer planets are in 1:2 resonance, i.e. the planetary system, as a whole, is in a 1:2:4 resonance (b:c:d).
Our simulations show that even planetary systems with very massive giant planets on resonant orbits can prove stable on Myr (and potentially Gyr) timescales. Such stability can lead to suitable quiescent impact regimes for any telluric worlds within those planetary systems. Recent work studying the effect of giant planets on the impact regime on terrestrial worlds (e.g. Jones Reference Jones2008; Horner & Jones Reference Horner and Jones2008, Reference Horner and Jones2009; Horner et al. Reference Horner, Jones and Chambers2010) has shown that even the presence of giant planets on stable orbits can act to increase the impact flux experience by such worlds. However, in their work, once the mass of the giant planet in question increases beyond that of Saturn (far less massive than the planets considered in this work), increasing mass generally leads to a decreasing impact flux, as the planet becomes ever more efficient at ejecting potentially hazardous objects from the planetary system before they get chance to hit the terrestrial planets. Once a planetary system has been stable for a reasonable length of time, any regions of instability (such as the Kirkwood Gaps in the asteroid belt) will be cleared of material, and the flux of material through the inner planetary system should slow to a trickle. Stability, then, is paramount in maintaining such a quiescent regime.
Given these facts, our results reveal the possibility for stable scenarios even in a planetary system such as HR8799. On a more general note, we have demonstrated the potentially surprising result that a system with massive planets in low-order Laplace resonances (where multiple bodies are in mutual resonances with one another) can be stable over Myr timescales, implying that such systems should not be ruled out as potential candidates for the presence of habitable worlds.
Conclusions
We have performed a detailed dynamical study of the impact of orbital eccentricity and planetary semi-major axes in the HR8799 system on the stability of the planetary system. Broadly speaking, our analysis is in agreement with similar studies of the system by other authors. For moderate values of eccentricity (e~0.01–0.08), we have shown statistically that the three-planet system is dynamically stable over the lifetime of the star, assuming the projected orbital radii are face on to us, that the planetary masses are close to those derived from photometry, and that the planets are coplanar. We find the dominant limitation on system stability is interaction between the inner two planets (d and c), causing disruption through collision or ejection on timescales of a few 104–105 yr for systems with moderate or high (e~0.08–0.20) initial eccentricities. This result is in agreement with the previous findings of Goździewski & Migaszewski (Reference Goździewski and Migaszewski2009).
As one of only a handful of systems identified with both exoplanet(s) and a debris disc, the rarity of HR8799 makes it an obvious target for further study. Of particular interest is the interaction between the debris disc's planetesimal belt and the outer exoplanet, and the influence this has on the habitability of postulated terrestrial exoplanets in the inner system, as the scenario presented here may be analogous to the proposed LHB phase in the early Solar System.
Acknowledgements
The authors would collectively like to thank L. Kaltenegger, a conversation with whom prompted this work, and G. Bradshaw, whose technical expertise made it possible. In addition, J. Marshall acknowledges the support of a Science and Technology Facilities Council studentship.