Introduction
Alzheimer's disease (AD) is a neurodegenerative disease associated with the progressive accumulation of neurofibrillary tangles and amyloid plaques around neuronal cells, leading to neuronal loss, cognitive deficits, and finally to clinically overt dementia (Selkoe, Reference Selkoe2002). Despite considerable efforts by the scientific community to unveil the mechanisms behind AD, there is currently no cure available for patients, and costs for the management and care of the patients are bound to rise considerably with increasing life expectancy worldwide (http://www.alz.org/downloads/facts_figures_2013.pdf). Currently, the greatest hope for AD patients relies on early therapeutic interventions aiming at delaying the progression of the disease. Such measures are likely to be more effective when administered during the very early stages of the disease rather than to patients with full blown AD (Emery, Reference Emery2011). Indeed, delaying disease progression by one year in 2015 would reduce the estimated prevalence by about 4 million (8%) in 2050, which in turn would translate into a considerable alleviation of the costs associated to AD (Emery, Reference Emery2011).
Important steps towards early AD detection have been achieved in the past decade through the development of in vivo biomarkers of pathology. Among these, hippocampal atrophy is the most established biomarker of neurodegeneration (Bobinski et al., Reference Bobinski2000) and is closely associated with episodic memory deficits (Frisoni et al., Reference Frisoni, Fox, Jack, Scheltens and Thompson2010). This well-established clinico-pathological correlation motivated the inclusion of hippocampal volume and medial temporal lobe (MTL) atrophy as supportive features for AD diagnosis in the newly published research criteria (Albert et al., Reference Albert2011). Imaging studies in individuals with mild cognitive impairment (MCI), a population at higher risk to develop AD (Petersen et al., Reference Petersen2001), have shown that hippocampal volumes are already reduced in these people (Jack et al., Reference Jack2010). Studies using an alternative definition of MCI (e.g. aging-associated cognitive decline (AACD); Levy, Reference Levy1994) similarly reported significant MTL atrophy associated with cognitive deficits (Pantel et al., Reference Pantel, Kratz, Essig and Schröder2003). More advanced hippocampal analysis tools, such as shape-based methods, help to distinguish between AD-related changes (affecting the anterior dorsal CA1 field) and age-related changes (affecting the ventral hippocampal head) (Apostolova et al., Reference Apostolova2006; Frisoni et al., Reference Frisoni2008; Wang et al., Reference Wang2003). Overall, the discriminant and predictive validity of hippocampal atrophy in clinical populations is good, as demonstrated by studies rooted in a pattern recognition framework (Apostolova et al., Reference Apostolova2006; Devanand et al., Reference Devanand2007; Clark et al., Reference Clark2008; Colliot et al., Reference Colliot2008; Karas et al., Reference Karas2008; Klöppel et al., Reference Klöppel2008; Ferrarini et al., Reference Ferrarini, Frisoni, Pievani, Reiber, Ganzola and Milles2009).
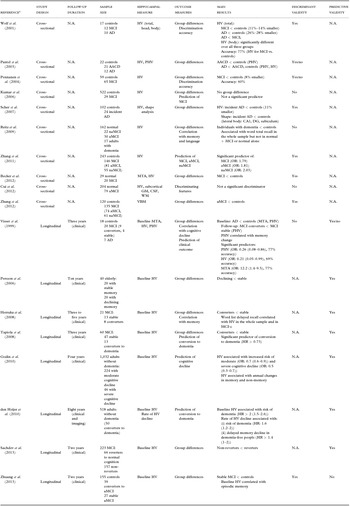
Less known is whether hippocampal atrophy can discriminate between normal cognition and cognitive impairment in the general population. This would be of interest for the possible use of hippocampal atrophy to screen populations for preventive interventions. The above-mentioned studies were indeed based on clinical-based populations, which typically include individuals at a more advanced stage of cognitive impairment. Conversely, population-based studies usually include patients in the earliest stages of the disease and have thus a greater chance to detect subtle changes associated with early cognitive impairment. Population-based studies consistently showed that hippocampal atrophy is associated with an increased risk of dementia (see Table 1 for a summary of population-based findings on hippocampal atrophy, and Table S1, available as supplementary material attached to the electronic version of this paper at www.journals.cambridge.org/jid_IPG, for a complete list of the main population-based studies), supporting the validity of hippocampal atrophy as a biomarker to predict conversion to dementia. Conversely, there is mixed evidence on the discriminant validity of hippocampal atrophy in separating normal aging from people with cognitive impairment (Table 1), thus limiting its potential as a biomarker to screen at-risk populations. Since hippocampal changes are likely to be subtle in the earliest disease stages, finer approaches, such as shape-based analysis methods, which have the potential to detect very small morphological changes, are needed. This study, therefore, aims at assessing hippocampal shape and volume changes in elderly people without dementia, drawn from a population-based study carried out in Italy, namely, the Italian PRoject on the Epidemiology of Alzheimer disease (IPREA; Scafato et al., Reference Scafato2005).
Literature review results: discriminant and predictive validity of hippocampal atrophy as a biomarker of cognitive impairment in population-based studies

Abbreviations: AD = Alzheimer's disease; MCI = mild cognitive impairment; HV = hippocampal volume; MTA = medial temporal atrophy on visual rating scale; PHV = parahippocampal volume; VBM = voxel-based morphometry; aMCI = amnestic MCI; naMCI = non-amnestic MCI; AACD = aging-associated cognitive decline; DG = dentate gyrus; OR = odds ratio; GM = gray matter; WM = white matter; CSF = cerebrospinal fluid.
YES/NO: questionable or trend for significance.
Inclusion criteria: (i) population-based; (ii) including people with cognitive impairment (MCI or AACD; eventually AD or cognitively impaired); (iii) hippocampal atrophy as the primary outcome. Exclusion criteria: (i) reviews; (ii) primarily methodological/descriptive studies; (iii) correlation studies in cognitively healthy.
aFull references are listed in Table S1 (available as supplementary material attached to the electronic version of this paper at www.journals.cambridge.org/jid_IPG).
Methods
Cohort
Total IPREA sample
The participants included in this study were drawn from the epidemiological IPREA study (Scafato et al., Reference Scafato2005). The initial study included 2,985 Italian elderly adults (aged between 65 and 84 years) who underwent a personal and informant interview, a physical and a neurological examination, and comprehensive neuropsychological testing, as described in detail elsewhere (Scafato et al., Reference Scafato2010). A summary of the diagnostic criteria used for participants classification are reported in Appendix 2. Briefly, the AACD criteria were used to classify patients as cognitively normal (HC), patients with cognitive impairment (AACD, AACD-nos, or objective cognitive decline (OCD); see Appendix 2), and patients with dementia (AD, vascular dementia (VaD), Parkinson's disease (PD) and other dementias). Diagnosis of dementia was defined based on internationally accepted criteria for the various forms of dementia. In this population, it has been estimated that the prevalence of cognitive impairment is approximately 45% (9% fulfilling AACD criteria, 19% fulfilling AACD-nos criteria, and 17% fulfilling OCD criteria; Scafato et al., Reference Scafato2010).
MRI substudy
A subsample of the initial cohort underwent an MRI scan (n = 567). The exclusion criterion for MRI was diagnosis of dementia (Scafato et al., Reference Scafato2005). Additionally, for the present study we excluded participants with non-amnestic deficits and included all who had (i) normal cognition (HC) or (ii) memory deficits (either AACD, AACD-nos, or OCD). Memory deficits were assessed with the Italian version of the Buschke Fuld Selective Reminding Test (Spinnler and Tognoni, Reference Spinnler and Tognoni1987), which covers three aspects of episodic memory: short-term recall (STR), long-term recall (LTR), and long-term storage (LTS). Memory scores were defined as abnormal when the score (adjusted for age and education level using normative values for the Italian population; Spinnler and Tognoni, Reference Spinnler and Tognoni1987) was 1 SD below the mean for the population, as suggested by Levy (Reference Levy1994).
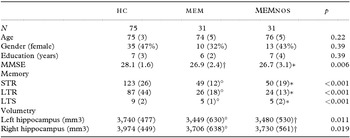
Two hundred and six participants were excluded due to incomplete or missing data (n = 170 due to missing or incomplete clinical/neuropsychological data; and n = 36 due to MRI artifacts precluding hippocampal measurement), and 180 participants were excluded because they did not fulfill the clinical criteria (n = 179 showed cognitive deficits in non-memory domains only; and n = 1 had pseudo-dementia). A total of n = 181 participants were eligible for the study, of whom 119 were HC and 62 showed memory deficits. Of these, 19 participants had OCD, 12 fulfilled the criteria for AACD, and the remaining 31 fulfilled the criteria for AACD-nos (MEMnos). The OCD and AACD groups were pooled together (MEM) since there were no differences between the two groups in terms of memory deficits. The MEM-nos group was analyzed separately to distinguish pure memory deficits (MEM) from deficits which might be related to other not otherwise specified conditions (AACD-nos criteria). Finally, since the initial HC sample (n = 119) was slightly younger (age: 72 ± 4) than the MEM and MEMnos groups (p < 0.001 on analysis of variance (ANOVA)), a subgroup of HC was age-matched to the MEM and MEMnos groups by selecting older controls (age > 70; n = 75). Demographic data of the three groups are shown in Table 2. Comparisons between the total IPREA sample (n = 2,985) and the subsample used for the present study (n = 137) are shown in Table S2 (available as supplementary material attached to the electronic version of this paper at www.journals.cambridge.org/jid_IPG).
Descriptive statistics for demographic data, memory scores, and hippocampal volumes in the study cohort

Values are mean (SD) or number (%); p denotes significance on the Analysis of Variance (ANOVA) for continuous variables or the χ 2 test for dichotomous variables.
°p < 0.05 in MEM versus HC (Bonferroni post hoc); *p < 0.05 in MEMnos versus HC (Bonferroni post hoc); †p < 0.10 (trend) in MEM versus HC or MEMnos versus HC (Bonferroni post hoc).
MEM = participants with memory deficits according to the AACD criteria; MEMnos = participants with memory deficits not otherwise specified; HC = healthy controls; STR = short-term recall; LTR = long-term recall; LTS = long-term storage.
The design and methodology of the IPREA study have been approved by an international group of experts (Scafato et al., Reference Scafato2005). The project has been approved by the Ethics Committee of the Istituto Superiore di Sanità (ISS). Written informed consent was obtained from all the participants.
MRI acquisition and pre-processing
All the MRI scans were collected on the same mobile Siemens Symphony 1 Tesla system between March 2004 and May 2004. Quality control was performed at each stopover using daily routine procedures. High-resolution sagittal T1-weighted gradient echo sequences were acquired using the following parameters: TR = 11.4 ms, TE = 4.4 ms, field of view = 250 mm, acquisition matrix = 256 × 256, slice thickness = 1.3 mm, and flip angle = 80°.
Hippocampal volumetry
The three-dimensional (3D) images were processed using a combination of scripts written in Perl (http://www.perl.com), based on the Minc toolkit developed at the McConnel Brain Imaging Centre (Montreal Neurological Institute, McGill University, Montreal, Canada). Processing included correction for magnetic field non-uniformities, intensity normalization, and brain-to-brain linear registration (9 degrees of freedom (dof)) to a standard template in the stereotaxic space (ICBM152) and re-sampling to an isotropic 1.5 mm voxel size. Each registered image was visually compared to the template using Register (part of Minc toolkit) and, when the automatic registration failed (mainly due to high scalp brightness), a manual registration was performed based on eleven anatomical landmark points distributed over the cerebrum and brainstem (the most anterior point of the temporal poles, the most posterior aspect on the occipital lobe, the most anterior point on the frontal lobe, the central sulcus, the inferior ventral aspect of the pons-midbrain cleft, the genu and splenium of the corpus callosum, the inter-thalamus adhesion, and the eyes). The hippocampi were manually traced by a single expert tracer with Display (part of Minc toolkit) on contiguous coronal slices, simultaneously checking tracing accuracy on the sagittal and axial planes. Tracings included the hippocampus proper, dentate gyrus, subiculum (subiculum proper and presubiculum), alveus, and fimbria (Pruessner et al., Reference Pruessner2000). Test-retest reliability was assessed on 20 participants, intraclass correlation coefficient being 0.93 for the right and 0.94 for the left hippocampus.
To obtain the original hippocampal volumes (i.e. in the native space), the brain with the traced region of interest was back-transformed from the stereotaxic to the native space. The accuracy of the back-transformation was confirmed by visual inspection. Hippocampal volumes were normalized to intracranial volume to control for brain size differences across the participants. Intracranial volume was obtained with SIENAX (part of FMRIB's Software Library – FSL) by computing the scaling factor mapping individual images to the standard MNI152 template (Smith et al., Reference Smith2002). The reciprocal of this value was then computed to obtain the intracranial volume.
Modeling of the hippocampal shape
The modeling of all hippocampal shapes was performed using GAMEs (Ferrarini et al., Reference Ferrarini, Olofsen, Palm, van Buchem, Reiber and Admiraal-Behloul2007; https://darwinnandoe.lumc.nl/drupal6/), a method based on growing and adaptive meshes. GAMEs has been successfully applied in several prior studies, including investigation of shape changes in brain ventricles (Ferrarini et al., Reference Ferrarini, Palm, Olofsen, van Buchem, Reiber and Admiraal-Behloul2006; Reference Ferrarini2008), basal ganglia structures (de Jong et al., Reference de Jong2011), and hippocampi (Ferrarini et al., Reference Ferrarini, Frisoni, Pievani, Reiber, Ganzola and Milles2009). A detailed description of the method can be found in Ferrarini et al. (Reference Ferrarini, Olofsen, Palm, van Buchem, Reiber and Admiraal-Behloul2007): briefly, a mesh is first grown (adding nodes and edges) until convergence to a pre-defined set of surface points (chosen as the average volume of the HC group). Subsequently, the mesh topology is frozen (number of nodes and edges), and only the locations of nodes are allowed to adapt to each individual set of hippocampal surface points. The adaptation is performed applying the Kohonen self-organizing map algorithm (Kohonen, Reference Kohonen1990), thus preserving topology. The set of final meshes represents a point distribution model (PDM), in which each node in a mesh is uniquely associated to the anatomically equivalent nodes in all other meshes. We applied GAMEs to the modeling of both left and right hippocampi in the stereotaxic ICBM152 space (see Figure S1(a), available as supplementary material attached to the electronic version of this paper at www.journals.cambridge.org/jid_IPG). The modeling resulted in a total of 137 meshes, one per participant, for each hippocampus. The optimal number of nodes per mesh was found to be 313, with each node locally representing a surface area of approximately 2 mm2. This was chosen considering the resolution of the data used to create the model (approximately 1.5 × 1.5 × 1.5 mm in standard space). Choosing a higher accuracy for the mesh (i.e. more nodes) would be meaningless, since it would approach the limiting resolution of the original data.
After having modeled each hippocampus, local normal versors (i.e. vectors of length 1) were identified along the surface model (see Figure S1(b), available as supplementary material attached to the electronic version of this paper at www.journals.cambridge.org/jid_IPG). Subsequently, for each given node and normal versor, all participants’ local node positions were projected along the normal directions (see Figure S1(c), available as supplementary material attached to the electronic version of this paper at www.journals.cambridge.org/jid_IPG): this resulted in a reduction of dimensionality for the coding of each node across the participants, from its original 3D coordinates to a one-dimensional (1D) coordinate (i.e. its projection along the local normal versor). Both the 3D and 1D representations of nodes were considered for subsequent analyses: specifically, the 3D representation was used for the statistical analysis of local shape differences between groups, while the 1D representation was used for correlation analysis of focal changes with memory scores and age.
Statistical analysis
Statistical differences between groups in demographic, clinical, and volumetric features were assessed with the ANOVA test (post hoc: Bonferroni correction).
Second, focal morphological differences between groups were analyzed. To this goal, a non-parametric multidimensional test (Hotelling's T2 test) was used. The statistical background has already been provided in detail in previous works (Ferrarini et al., Reference Ferrarini, Palm, Olofsen, van Buchem, Reiber and Admiraal-Behloul2006; Reference Ferrarini, Olofsen, Palm, van Buchem, Reiber and Admiraal-Behloul2007). In brief consider a specific surface location (i.e. to specific node in the mesh model): such a node is uniquely associated to anatomically equivalent locations across all participants and groups. Hence, focusing on a given comparison (e.g. HC vs. MEM), two clouds of 3D space locations can be identified. As a first step, the Hotelling's T2 statistic is evaluated. Next, the association between node locations and groups is permuted randomly for a given number of times (i.e. 10,000). At each permutation, the Hotelling's T2 statistic is evaluated. Due to random permutation, the set of statistics obtained in this second phase follows the null hypothesis of no difference between groups. Eventually, a p-value for the original comparison (e.g. HC vs. MEM) is obtained by considering the proportion of times in which a higher statistics was obtained by chance under the null-hypothesis (for more details about non-parametric permutation tests, the reader is referred to Appendix 3).
A correlation analysis was performed to investigate the relationship between hippocampal features (volumes and shape changes) and socio-demographic and cognitive variables (age and memory deficits) using the Pearson correlation test. Correlations were performed separately for the right and left hippocampi. For the morphological features, the local 3D spatial information (node locations across the participants) was first turned into a 1D representation. The cognitive variables were the STR, LTR, and LTS corrected scores. The correlations were performed both across the entire cohort (HC, MEM, and MEMnos) and separately within each patient group (MEM and MEMnos). The threshold for significance was set at p < 0.05 for all the correlation analyses. Multiple comparisons’ correction was performed for volumetric data with the False Discovery Rate procedure (Benjamini and Yekutieli, Reference Benjamini and Yekutieli2001) at q = 0.10 and q = 0.05 levels. For shape-based analysis, p-values were corrected locally with Hotelling's T2 statistic and permutation test (see previous paragraph).
Finally, the accuracy of hippocampal volumetry in separating MEM and MEMnos groups from HC, and participants with borderline cognition from controls, was estimated using receiver operating characteristic (ROC) curves and computing the corresponding area under the curve (AUC).
Results
Demographic and clinical data
No significant difference was detected across groups for age, gender, and years of education (p > 0.22 on ANOVA; Table 2), which was in line with the matching procedure. Memory scores were significantly lower in MEM (p < 0.001 for STR, LTR, and LTS; Bonferroni post hoc) and MEMnos (p < 0.001) groups compared with HC, in line with the selection criteria. Mini-Mental State Examination (MMSE) was significantly lower in MEMnos (p = 0.02 on Bonferroni) and showed a trend for lower scores in MEM (p = 0.06 on Bonferroni) participants compared with HC. No significant differences were detected between the MEM and the MEMnos groups in any of the demographic and clinical variables (p > 0.05 on Bonferroni post hoc).
Volumetric and morphological group comparisons
Hippocampal volumes normalized to intracranial volume differed significantly between groups (p < 0.02 on ANOVA; Table 2). Post hoc Bonferroni showed that the left and right normalized hippocampi were smaller in MEM compared with HC (8% and 7% smaller for the left and right, respectively; p = 0.03 for the left and p = 0.05 for the right) and were marginally lower in MEMnos compared with HC (p = 0.07 and p = 0.09).
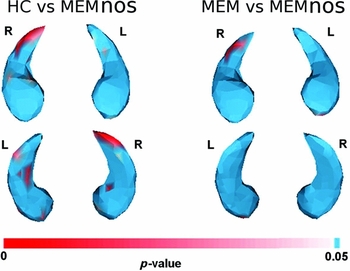
Shape analysis showed no significant difference between MEM and HC (p > 0.05 over the whole hippocampal surface, data not shown). Conversely, hippocampal shape differed significantly between MEMnos and HC, significant differences mapping to the posterior hippocampus (primarily the right CA1 tail and the ventral subiculum bilaterally; Figure 1, left panel). Direct comparisons between MEM and MEMnos detected hippocampal shrinkage in the latter group in the right CA1 tail (Figure 1, right panel).
Significant hippocampal shape differences between groups. The maps show significant p-values (p < 0.05, red to white colors) for the comparisons between HC and MEMnos, and between MEM and MEMnos. No significant difference was detected between the MEM and HC groups (p > 0.05).

Volumetric correlation analysis
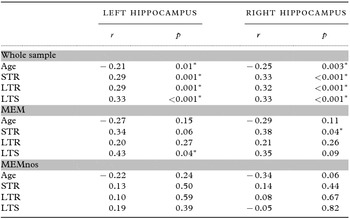
In the whole cohort, normalized hippocampal volumes correlated significantly with age (r = –0.21 and p = 0.01 for the left, and r = –0.25 and p = 0.003 for the right hippocampus; Table 3) and memory scores (p < 0.001 for all memory variables; Table 3) and survived the false discovery rate (FDR) correction (p < 0.033 at q = 0.10 and p < 0.017 at q = 0.05). When the analysis was restricted to patients with memory deficits, a positive correlation was found in the MEM group between the STR scores and the right normalized hippocampal volume (r = 0.38, p = 0.04; Table 3) and the left normalized hippocampus and LTS scores (r = 0.43, p = 0.04; Table 3). These correlations survived FDR-correction at q = 0.10 (p < 0.042) but not at q = 0.05 (p < 0.021). No significant correlation was found in the MEMnos group (p > 0.05; Table 3).
Correlations between hippocampal volumes, age, and memory deficits in the whole study sample, in the MEM sub-group, and in the MEMnos sub-group

r denotes Pearson's correlation coefficient; p denotes Pearson's significance.
*p < 0.05.
MEM = participants with memory deficits according to the AACD criteria; MEMnos = participants with memory deficits not otherwise specified; STR = short-term recall; LTR = long-term recall; LTS = long-term storage.
Morphological correlation analysis
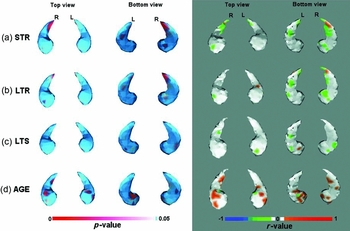
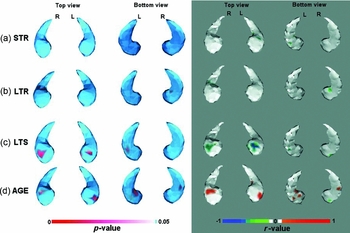
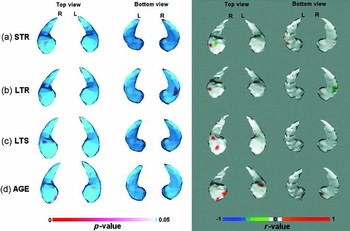
The results of morphological correlation analysis are shown in color-coded hippocampal maps representing the significance of the correlation (p-values) and the corresponding signed R 2 values (Figures 2–4). These findings are described in detail in the following sections.
Correlations between local hippocampal changes and memory scores and age in the entire cohort. Maps show significant p-values (p < 0.05; red to white colors; left panel) and the corresponding R 2 correlation values (positive correlations: orange-to-red, negative correlations: green-to-blue; right panel).

Correlations between local hippocampal changes and memory scores and age in the MEM group. Maps show significant p-values (p < 0.05; red to white colors; left panel) and the corresponding R 2 correlation values (positive correlations: orange to red, negative correlations: green to blue; right panel).

Correlations between local hippocampal changes and memory scores and age in the MEMnos group. Maps show significant p-values (p < 0.05; red to white colors; left panel) and the corresponding R 2 correlation values (positive correlations: orange to red, negative correlations: green to blue; right panel).

Whole cohort
Correlations between hippocampal shape changes and STR and LTR memory deficits were localized in the right CA1 tail and in the ventral subiculum bilaterally (Figure 2(a)–2(b)). Long-term storage memory scores were only weakly associated with shape changes, mainly in the anterior ventral hippocampus (subiculum, Figure 2(c)). Memory scores were negatively correlated with atrophy (i.e. lower memory scores corresponding to greater atrophy). Age was positively correlated with atrophy (i.e. lower ages corresponding to lower atrophy), significant associations mapping to the anterior hippocampus (head of the CA1 field and anterior ventral subiculum) bilaterally, and to the right medial subiculum (Figure 2(d)).
MEM group
When the analysis was restricted to the MEM group, no correlation between atrophy and STR and LTR scores was detected (Figure 3(a)–3(b)). Conversely, LTS scores were significantly correlated with hippocampal changes in the head of the CA1 field (Figure 3(c)). The association between age and shape changes in the anterior hippocampus (head of the CA1 field and anterior ventral subiculum) was still significant in this subgroup (Figure 3(d)).
MEMnos group
Within the MEMnos group, no clear pattern of correlation was observed between hippocampal shape and memory scores and age (Figure 4). Only very small areas were detected which approached non-significance (p = 0.05).
ROC analysis
Hippocampal volumes discriminated MEM from HC with an accuracy of 0.63 and 0.66 for the left and right hippocampi respectively. Similar values were obtained for the comparison between MEMnos and HC (0.64 and 0.61). When considering participants with borderline deficits, hippocampal volumes showed chance-level accuracy (0.54 and 0.60).
Discussion
The aim of this work was to investigate the association between memory deficits and hippocampal changes in a large population-based elderly cohort. Participants were divided in three groups: normal controls, MEM, and MEMnos. We found that: (i) hippocampal volumes were smaller in the MEM group compared with controls; (ii) hippocampal volumes correlated with long-term memory deficits within the MEM group, significant associations mapping to the anterior dorsal CA1 hippocampus.
These findings are consistent with previous studies showing that hippocampal atrophy can discriminate between normal aging and memory impairment in the general population. A number of previous studies failed to detect any difference in hippocampal volumes between patients and controls (see Table 1: Pantel et al., Reference Pantel, Kratz, Essig and Schröder2003; Kumar et al., Reference Kumar2006; Reitz et al., Reference Reitz2009; Cui et al., Reference Cui2012). Others, conversely, reported significant volume reductions, ranging between 7%–14% along the spectrum from MCI to incident AD (see Table 1; Wolf et al., Reference Wolf2001; Pennanen et al., Reference Pennanen2004; Scher et al., Reference Scher2007; Zhang et al., Reference Zhang2011). Our study is in agreement with the latter studies, as we observed hippocampal volume reductions of 7%–8% in participants with memory deficits, and overall, supports the discriminant validity of hippocampal volumetry in the general population. Some caution is, however, warranted when generalizing these results since hippocampal volumetry showed a low accuracy in discriminating participants at the individual level.
The observed correlations between hippocampal atrophy and memory deficits are in line with the known pathophysiology of memory decline in patients with AD pathology. In the whole sample, memory deficits were associated with hippocampal reductions in regions that have been reported to be specific to AD (dorsal head of the CA1 field; Apostolova et al., Reference Apostolova2006; Frisoni et al., Reference Frisoni2008) but also in regions non-uniquely associated to AD (CA1 tail and anterior ventral subiculum; Apostolova et al., Reference Apostolova2006; Frisoni et al., Reference Frisoni2008). When the analysis was restricted to the MEM group, the only significant associations was in the CA1 dorsal head, suggesting that the observed effects are specific to patients with an AD-like profile. Although some degree of overlap exists in the hippocampal head between age- and memory-related patterns (Frisoni et al., Reference Frisoni2008), overall we observed only a marginal overlap, mainly in the right dorsolateral CA1 field. The hypothesis of an AD-like pattern in the MEM group is further supported by the observation that congruent memory-hippocampus associations were observed in MEM but not in MEMnos participants. Moreover, MEMnos showed a hippocampal reduction of about 6%–7% compared with controls, similarly to the MEM participants, however, this reduction fell short of statistical significance.
Shape-based analysis detected no significant difference between MEM and HC, while MEMnos showed shape changes in the posterior hippocampus compared with HC and MEM groups. The lack of significant shape changes in the MEM group is unexpected, since shape-based analysis is expected to detect very subtle and focal changes otherwise not measurable with volumetry. A possible explanation for this negative finding might be that the hippocampus of our participants was affected by small and generalized (rather than focal) reductions. However, this explanation is unlikely since a large amount of literature has previously shown that atrophy affects specific hippocampal regions and does not involve the whole hippocampus even in full-blown AD (Wang et al., Reference Wang2003; Apostolova et al., Reference Apostolova2006; Frisoni et al., Reference Frisoni2008; Ferrarini et al., Reference Ferrarini, Frisoni, Pievani, Reiber, Ganzola and Milles2009). An alternative explanation might be that shape-based biomarkers are influenced to a greater extent than volumetric measures by population variability, a factor that might have reduced sensitivity to detect group-differences in our sample. Since no previous study has assessed shape changes in a population-based sample, except for the study by Sher et al. (2007), which, however, analyzed patients at a more advanced disease stage (i.e. incident AD), future studies are needed to clarify this issue.
The pattern of hippocampal changes in the MEMnos group showed a good correspondence with regions typically (albeit not specifically) involved in AD, such as the tail of the CA1 field and the posterior subiculum. On the one hand, this result might indicate that hippocampal changes in this subgroup are related to a neurodegenerative process as well. On the other hand, the pathophysiological mechanism underlying these changes can hardly be ascribed to AD pathology. Indeed, as we observed above, the lack of an association between memory deficits and morphological/volume changes in this group does not support the view of an AD aetiology. Since these participants represent a clinically heterogeneous group, who did not fulfill the criteria for AACD (due to the lack of evidence of a gradual onset of cognitive deficits from at least six months, or the past or current presence of medical/psychiatric conditions or use of psychoactive substances), other factors are likely responsible for the observed effect in hippocampal morphology. Although we cannot speculate on the possible mechanisms underlying these abnormalities, it is likely that other factors are involved, e.g. environmental or genetic factors, as well as other pathologies. Since this pattern was also observed in the comparison between MEMnos and MEM, an alternative explanation might be that these morphological changes simply represent a specific feature of this heterogeneous sample. Notwithstanding this uncertainty, we observe that volumetric and shape-based analysis was able to detect significant differences between the two study groups in morphology and in cognitive-morphological associations. This is encouraging in the perspective of the use of hippocampal biomarkers for the differential diagnosis and prediction of dementia.
Some limitations of the study ought to be recognized. The relatively small size of the samples might have introduced some bias. However, although smaller than the original IPREA dataset, our cohort was drawn from a representative sample of the general elderly Italian population. Another possible limitation is that we did not collect biological markers of AD pathology, such as amyloid levels on cerebrospinal fluid (CSF) or amyloid positron emission tomography (PET), and hypometabolism on fluorodeoxyglucose (FDG)-PET (Albert et al., Reference Albert2011). These examinations indeed were not part of the original study protocol. The IPREA study, however, is an ongoing project and clinical follow-up will be collected for all the participants. These data will indeed be used in future studies to ascertain stability or conversion of participants with memory deficits. Finally, no phantom data were collected to compare MRI signal across sites. Notwithstanding this limitation, the use of mobile MRI can offer some advantages in the context of epidemiological studies. Mobile MRI systems indeed enable: (i) to collect a large number of MRI scans according to a tight schedule, otherwise challenging for standard neuroradiology units, and (ii) to maximize comparability across sites thanks to the use of fully harmonized machines and protocol parameters.
In conclusion, shape and volume hippocampal analysis showed that cognitive deficits are associated with regionally specific hippocampal changes in a population-based elderly cohort. Direct group comparisons showed smaller hippocampal volumes but failed to detect significant shape differences between patients with pure memory deficits and controls. Overall, these results are consistent with the view that hippocampal changes occur early in patients suspected to be at greater risk for AD.
Conflict of interest
None.
Description of author's role
L. Ferrarini, J. Milles, G.B. Frisoni, and M. Pievani designed the study. L. Ferrarini and M. Pievani wrote the paper. L. Ferrarini and M. Pievani were responsible for the statistical design of the study and for carrying out the statistical analysis. B. van Lew, J.H.C. Reiber, G.B. Frisoni, and J. Milles assisted with the writing of the paper. E. Scafato is the principal investigator of the IPREA. L. Galluzzo, C. Gandin, and E. Scafato collected the data and assisted with the writing of the paper.
Acknowledgments
This project was supported by a grant from the Italian Ministry of Health (“Progetti strategici di ricerca finalizzata sulla malattia di Alzheimer”, Art. 12 D. Lgs. 502/92 and Art. 12bis D. Lgs. 229/99), Italy. The project was further supported by the Gisela Thier Foundation.
Appendix 1 IPREA working group
E. Scafato, G. Farchi, S. Giampaoli, S. Mariotti, C. Gandin, L. Galluzzo, S. Ghirini, S. Martire, and L. Di Pasquale, Istituto Superiore di Sanità (ISS), Rome; S. Maggi, G. Crepaldi, G. Enzi, and P. Gallina, Italian Research Council (CNR), Rome and University of Padova, Padova; D. Inzitari, M. Baldereschi, and A. Di Carlo, University of Florence and CNR, Florence; G.B. Frisoni and S. Galluzzi, Istituto di Ricovero e Cura a Carattere Scientifico (IRCCS) Fatebenefratelli, Brescia; C. Gandolfo and M. Conti, University of Genova, Genoa; D. Postacchini, G. Cruciani and C. Giuli, INRCA, Fermo (AP); A. Capurso, V. Solfrizzi and F. Panza, University of Bari and IRCCS Casa Sollievo della Sofferenza, San Giovanni Rotondo, Foggia; F. Rengo and P. Abete, University of Naples, Naples; M. Motta, University of Catania, Catania; R. Negrini, P. Forti and P. Tabanelli, USL Bologna Nord, Bologna; A. Cocchi and G. Zuccal, University of Rome “Sacro Cuore”, Rome; F. Cacciatore, C. Calabrese, G. Sica, and A. Estraneo, Salvatore Maugeri Foundation, IRCCS, Pavia; D. Consoli, F. Naso, G. Torcasio, ASL 8, Vibo Valentia; P. Mecocci, P. Rinaldi, V. Serafini, U. Senin, University of Perugia, Perugia.
Appendix 2 Diagnostic and AACD criteria
Aging-associated cognitive decline criteria were developed in 1994 to describe the transitional phase between normal aging and dementia by the International Psychogeriatric Association (IPA) in collaboration with the World Health Organization (Levy, Reference Levy1994). According to these criteria, AACD definition is based on the results of a complete clinical and neuropsychological assessment including (i) ADL and IADL assessment (Lawton and Brody, Reference Lawton and Brody1969; Katz et al., Reference Katz, Downs, Cash and Grotz1970), (ii) clinical dementia rating (CDR; Morris, Reference Morris1993), (iii) MMSE battery for global cognition (Measso et al., Reference Measso, Cavarzeran, Zappalà, Lebowitz, Crook and Pirozzolo1993; Grigoletto et al., Reference Grigoletto, Zappalà, Anderson and Lebowitz1999), and (iv) neuropsychological tests for the assessment of the major cognitive domains: (1) memory and learning with the Buschke Fuld Selective Reminding Test (Spinnler and Tognoni, Reference Spinnler and Tognoni1987); (2) attention with the Trail Making Test, A and B (Amodio et al., Reference Amodio2002); (3) verbal ability with the Verbal Fluency Test for semantic categories (Novelli et al., Reference Novelli, Papagno, Capitani, Laiacona, Vallar and Cappa1986); (4) visuoconstructive function with the Constructional Praxis test (Spinnler and Tognoni, Reference Spinnler and Tognoni1987); and (5) problem-solving with the Raven colored progressive matrices (Basso et al., Reference Basso, Capitani and Laiacona1987).
Based on this evaluation, the following diagnostic categories were defined:
-
1. Participants were classified as cognitively normal if they showed:
-
(a) normal cognition on MMSE and neuropsychological tests
-
(b) normal activities of daily living (ADL and IADL)
-
(c) CDR = 0
-
2. Participants were classified as AACD if they showed:
-
(a) objective cognitive deficits in at least one cognitive domain
-
(b) subjective gradual cognitive decline (reported by the participant or an informant) present for at least six months
-
(c) absence of any present or past medical/psychiatric conditions or any psychoactive substances use that could explain the cognitive deficits
-
(d) normal activities of daily living
-
(e) CDR = 0.5
-
3. Participants were classified as those with dementia if they showed:
-
(a) abnormal neuropsychological tests
-
(b) abnormal activities of daily living
-
(c) CDR > 0.5
Additionally, the following three groups who did not fulfill the above criteria were identified (Scafato et al., Reference Scafato2010):
-
4. People with cognitive complaints (CC):
-
(a) normal cognition on MMSE and neuropsychological tests
-
(b) cognitive complains by the subject and/or the informant
-
(c) normal activities of daily living
-
(d) CDR = 0
-
5. People with objective evidence of cognitive decline without cognitive complains (OCD):
-
(a) objective cognitive deficits in at least one cognitive domain
-
(b) absence of cognitive complains (nor by the subject nor by the informant)
-
(c) normal activities of daily living
-
(d) CDR = 0
-
6. People with AACD not otherwise specified (AACD-nos, corresponding to the AACD-3 group in the paper by Scafato et al., Reference Scafato2010). These participants fulfilled three out of five criteria for AACD (category 2). The criteria not met were the second (gradual onset of symptoms) and the third (absence of comorbidities).
For category 3 (people with dementia), a diagnosis of dementia was defined based on international criteria for the various forms of dementia: National Institute of Neurological and Communicative Disorders and Stroke and the Alzheimer's Disease and Related Disorders Association (NINCDS–ADRDA) criteria for AD (McKhann et al., Reference McKhann, Drachman, Folstein, Katzman, Price and Stadlan1984); National Institute of Neurological Disorders and Stroke and Association Internationale pour la Recherché et l'Enseignement en Neurosciences (NINDS–AIREN) criteria for VaD (Roman et al., Reference Roman1993) and Erkinjuntti criteria for subcortical VaD (Erkinjuntti et al., Reference Erkinjuntti2000); the McKhann criteria for frontotemporal dementia (FTD) (McKhann et al., Reference McKhann, Albert, Grossman, Miller, Dickson and Trojanowski2001); the McKeith criteria for dementia with Lewy bodies (DLB) (McKeith et al., Reference McKeith1996); and DSM-IV-TR criteria for depressive pseudo-dementia, dementia associated with Parkinson's disease, medical conditions, and drug abuse (American Psychiatric Association, 1994).
Appendix 3 Permutation test
Permutation tests have been successfully used for the analysis of brain images (Nichols and Holmes, Reference Nichols and Holmes2002; Thompson et al., Reference Thompson2004): they require limited assumptions and are corrected for multiple comparisons.
Given two populations G1 and G2, can we localize statistically significant differences on the average surface? The outcome of the permutation tests is, in the first place, a p-value for the omnibus hypothesis the two groups G1 and G2 are drawn from the same population. Moreover, we obtain the p-values for each node in the model, telling us whether the distribution of that node in space is the same in G1 and G2 or not. Since all meshes are co-registered to a standard space, significant differences in space distribution of a certain location indicates either a significant enlargement or shrinking of one population with respect to the other (hence pointing to atrophy).
Permutation tests can be summarized as follows:
-
1. considering two groups G1 and G2:
-
(a) for each node in the model, build up two clouds of points, C1 and C2, considering the positions the node assumes through all the shapes in G1 and G2;
-
(b) C1 and C2 are compared via a Hotelling's T2 statistic test: outcome of the test is the t-value for the node comparison (is the node distributed in space in significantly different ways?); such a test tests both the average positions in space for the two clouds, and their variances.
-
2. for N perm = 10,000 times, two groups of shapes A and B are built up by randomly mixing G1 and G2, and point 1 is performed on them. Only the highest t-value is stored for each iteration;
-
3. a critical t-value t c is evaluated as the kth highest value of all the N perm t-values previously stored (plus the t Max for the original division in G1–G2), where
(1) \begin{equation}
k = \alpha \times N_{{\rm perm}} \,c + 1,\,\alpha = 0.05
\end{equation}
-
4. the p-value for the omnibus hypothesis “G1 and G2 are the same” is evaluated as
(2)
\begin{equation}
p_{{\rm value}} = N/N_{{\rm tests}} ,\,{\rm where}\vspace*{-6pt}
\end{equation}
(3)
\begin{equation}
N = \# \{ {\rm stored}\,t_{{\rm values}} \left| {t_{{\rm values}} } \right. > t_c \} ,\vspace*{-6pt}
\end{equation}
(4)
\begin{equation}
N_{{\rm tests}} = N_{{\rm perm}} + 1;
\end{equation}
-
5. finally, point 4 is applied to each single node, counting how many t-values are higher than the t-value associated with a particular node in the original G1–G2 grouping of shapes, and dividing the number for N perm + 1; this leads to a p-value (corrected for multi-tests) for each node in the model.