Implications
Ruminal disorders resulting from feeding large quantities of grain can negatively affect ruminal fiber degradation. Although fibrolytic microbes are sensitive to low pH, this study showed that important fibrolytic bacteria can adapt to grain feeding, although ruminal pH was still low. Ruminal fiber degradation of more easily degradable grass silage, but not of fiber-rich hay, can be restored with prolonged time of high-grain feeding. Managing pattern and duration of grain feeding as well as forage quality may alleviate the consequences of high-grain feeding in cattle.
Introduction
Forages are crucial ingredients for ruminants’ diets, not only as digestible nutrient and energy sources but most importantly to sustain proper rumen function and rumen health. As opposed to forages, rapidly fermentable carbohydrates are digested faster in the rumen by amylolytic bacteria causing an accumulation of short-chain fatty acids which can lead to a drastic decline in ruminal pH (Plaizier et al., Reference Plaizier, Krause, Gozho and McBride2008). Sustained depression of ruminal pH below 5.8 for longer than 5 h/day increases the risk of subacute ruminal acidosis (SARA) in cattle (Zebeli et al., Reference Zebeli, Dijkstra, Tafaj, Steingass, Ametaj and Drochner2008). Such disturbances in the ruminal environment have a profound effect on the ruminal microbiota and may severely affect the activity of the fibrolytic bacterial species (Fernando et al., Reference Fernando, Purvis, Najar, Sukharnikov, Krehbiel, Nagaraja, Roe and DeSilva2010), and fiber degradation in the rumen (Krajcarski-Hunt et al., Reference Krajcarski-Hunt, Plaizier, Walton, Spratt and McBride2002).
Ruminal fibrolytic bacterial species like cellulolytic Fibrobacter succinogenes, and cellulolytic and hemicellulolytic Ruminococcus flavefaciens and Ruminococcus albus, were shown to be highly sensitive to ruminal pH below 6.0 (Mickdam et al., Reference Mickdam, Khiaosa-ard, Metzler-Zebeli, Klevenhusen, Chizzola and Zebeli2016). Consistently, grain-rich diets are viewed to be detrimental to fiber degradation in the rumen (Krajcarski-Hunt et al., Reference Krajcarski-Hunt, Plaizier, Walton, Spratt and McBride2002). However, in other studies, the genus Ruminococcus and R. albus and R. flavefaciens were shown to maintain their abundance in the rumen of cows having a low ruminal pH (Khafipour et al., Reference Khafipour, Li, Plaizier and Krause2009; Palmonari et al., Reference Palmonari, Stevenson, Mertens, Cruywagen and Weimer2010). Bacterial adaptation to high-grain feeding appears to shift over time of feeding, too (Tajima et al., Reference Tajima, Aminov, Nagamine, Matsui, Nakamura and Benno2001). The authors showed that the abundances of bacterial species found on day 3 of high-grain feeding did not fully represent those 4 weeks later. To date, the knowledge about SARA is based on experiments that mostly utilized continuous SARA induction models. However, it is thinkable that cattle likely experience SARA transiently because they alter their intake to attenuate the effects of SARA (Gao and Oba, Reference Gao and Oba2014). Thus, the effects of a high-grain diet on rumen microbial changes and fermentation should be discussed in relation to duration and pattern of grain feeding. It seems that cows can cope better when the feeding of a high-grain diet continues for 4 weeks, considering improved ruminal pH profile (Pourazad et al., Reference Pourazad, Khiaosa-ard, Qumar, Wetzels, Klevenhusen, Metzler-Zebeli and Zebeli2016) due to an increased ruminal absorption of fermentation acids (Qumar et al., Reference Qumar, Khiaosa-ard, Pourazad, Wetzels, Klevenhusen, Kandler, Aschenbach and Zebeli2016) compared with a transient feeding of the same diet. Following these findings of our companion studies, we hypothesized that under a long and continuous nutritional challenge using a high-grain diet ruminal fiber degradation capacities can be restored due to adaptation of fibrolytic microbes to the diet.
Forages differ in the content of potentially degradable nutrients due to their physical and chemical characteristics and therefore can be differently affected by SARA (Li et al., Reference Li, Cao, Liu, Yang, Yao and Yan2014). Degradation of forages that are rich in lignified fibers depends on ruminal fungi (Akin et al., Reference Akin, Lyon, Windham and Rigsby1989). Anaerobic fungi have been shown to be more sensitive to low pH than ruminal bacteria (Mickdam et al., Reference Mickdam, Khiaosa-ard, Metzler-Zebeli, Klevenhusen, Chizzola and Zebeli2016). Accordingly degradation of fiber-rich hay may be depressed more severely by SARA in comparison with grass silage. The objective of the present study was therefore to investigate the in situ ruminal nutrient degradation extents of fiber-rich hay and grass silage and abundances of the major ruminal fibrolytic microbes in cows exposed to two different grain-rich feeding challenge models. Both forages tested for in situ trails were the forages fed to the cows. In addition, we determined variation among cows in their ruminal pH profile and fiber degradation in response to the grain challenges.
Material and methods
Cows, experimental design and feeding
This study was a series study of a larger project in which previous investigations on in vivo ruminal fermentation profile (Pourazad et al., Reference Pourazad, Khiaosa-ard, Qumar, Wetzels, Klevenhusen, Metzler-Zebeli and Zebeli2016) and ruminal absorption processes (Qumar et al., Reference Qumar, Khiaosa-ard, Pourazad, Wetzels, Klevenhusen, Kandler, Aschenbach and Zebeli2016) were reported. Animal handling and experimental procedures were approved by the institutional ethics committee of the University of Veterinary Medicine, Vienna and the national authority according to §26 of Law for Animal Experiments, Tierversuchsgesetz 2012 – TVG (GZ 68.205/0093-II/3b/2013).
Eight ruminally cannulated (100 mm i.d.; Bar Diamond, ID, Parma, USA) non-pregnant non-lactating Holstein cows (initial BW: 710±118 kg, age: 68±20 months, mean±SD) were blocked by BW and randomly arranged to two different high-grain feeding models: a transient feeding and a continuous feeding with four cows in each model. Dry cows were used to avoid potential interference of differences in hormonal profile, lactation stages and feed intake level. Feeding plans of the continuous and transient feeding models are illustrated in Supplementary Figure S1. At the start of the experiment, all cows were fed a forage-only diet consisting of grass silage and second-cut meadow hay (1:1 dry matter (DM) basis) for 3 weeks (termed as baseline). After 6 days of diet transition to a 60% concentrate diet, the cows of the continuous model were fed the 60% concentrate diet for 4 weeks, whereas the cows of the transient model were fed the 60% concentrate diet for 1 week, then withdrawn for 1 week from the concentrate (i.e. fed the same as at baseline), and then re-fed with the 60% concentrate diet. The diet was offered at 2.0% of BW, meeting the voluntary feed intake of the cows. During the grain-rich feeding, cows had access first to the forage mix at 0800 h and to the concentrate at 1000 onwards. Data for ingredients and chemical composition of the forage-only diet and the 60% concentrate diet as well as more description for feeding procedures are described in the Supplementary Material S1.
Each cow received a wireless ruminal pH sensor (smaXtec®, Graz, Austria) which was introduced directly through the rumen cannula. All sensors were calibrated before use. Validation of the pH sensors was previously performed to confirm the reliability of the sensors (Klevenhusen et al., Reference Klevenhusen, Pourazad, Wetzels, Qumar, Khol- Parisini and Zebeli2014). The validation showed that the reticular pH measured by sensors satisfactorily reflected the pH of ruminal content (Klevenhusen et al., Reference Klevenhusen, Pourazad, Wetzels, Qumar, Khol- Parisini and Zebeli2014). More details regarding pH sensor measurements are described in Pourazad et al. (Reference Pourazad, Khiaosa-ard, Qumar, Wetzels, Klevenhusen, Metzler-Zebeli and Zebeli2016). Ruminal pH data and temperature presented in the present study cover only the in situ incubation periods.
In situ trials
In situ trials were performed twice for cows undergoing the transient feeding model (Supplementary Figure S1): at baseline and the 1st week of the re-feeding with 60% concentrate (so called re-challenge). It was done three times for cows in the continuous feeding model: at baseline, in the 1st week (week-1), and in the last week (week-4) of grain-rich feeding. For each in situ trial, two types of forage including dried grass silage and hay were tested, both derived from the same batch of forages fed to the cows. The dried grass silage contained 89.8% organic matter (OM), 42.8% NDF and 35.0% ADF (DM basis) and a DM content of 95.7%, whereas the hay contained 93.4% OM, 66.6% NDF, and 41.5% ADF (DM basis) and a DM content of 90.5%. Chopped forages (2 cm in length) were weighed into a nylon bag (20 cm×10 cm, 150 μm pore size, Linker Industrie-Technik GmbH, Kassel, Germany) for the ruminal degradation and into a nylon bag (12 cm×6.5 cm, 150 μm pore size) for the microbiota. Before incubation, the bags were soaked in warm water (39°C) for 15 min. Representative 0 h samples were stored at −80°C. The remaining soaked bags were positioned into the ventral rumen sac of the animal. The incubation lasted 48 h and bags were sampled at 4, 8, 24 and 48 h of incubation. Afterwards, the content of incubated nylon bags used for the microbiota was transferred into cryo-tubes (Sarstedt, Nürnbrecht, Germany) and those bags for the ruminal degradation remained sealed. All samples were stored at −80°C for later analyses.
Proximate analyses and calculations
Diets, in situ feeds, and in situ feed residues were analyzed for their chemical composition following the protocol of Association of German Agricultural Analytic and Research Institutes (VDLUFA) (2007). Frozen nylon bags were thawed, hand-washed, and squeezed off the liquid. All samples were dried at 65°C for 48 h and ground through a 0.5-mm sieve. The DM content was determined by oven-drying of samples at 103°C overnight and ash by overnight combustion at 580°C. Organic matter was calculated from the ash content. Neutral detergent fiber and ADF were analyzed using Fibretherm FT 12 (Gerhardt GmbH & Co. KG, Königswinter, Germany), for NDF with heat-stable α-amylase. The NDF and ADF values are exclusive of residual ash. In situ disappearance extents (termed as degradation, % of supply) of DM, OM, NDF and ADF in forages at each incubation time point were calculated as the difference between the provided amount and the recovered amount at each sampling time multiplied by 100.
Deoxyribonucleic acid extraction and quantitative PCR
In situ feed residues were thawed on ice until they became pliant. Feed residues were cut into small pieces, and a 250-mg homogenized subsample was used for genomic DNA isolation using the PowerSoil DNA isolation kit (MOBIO Laboratories Inc., Carlsbad, CA, USA). Samples were mixed with SDS-containing buffer C1 and heated at 70°C for 10 min to ensure proper lysis of bacteria (Metzler-Zebeli et al., Reference Metzler-Zebeli, Khol-Parisini, Gruber and Zebeli2015). Thereafter, samples were bead-beaten to dissociate microbes from feed particles and to disrupt the bacterial cells. This was followed by chemical removal of cell debris and PCR inhibitors and column-based isolation of total genomic DNA according to the manufacturer’s instructions. The isolated DNA concentration was determined by a Qubit 2.0 Fluorometer (Life Technologies, Carlsbad, CA, USA) using the Qubit dsDNA HS Assay Kit (Life Technologies) and DNA integrity was checked by horizontal gel electrophoresis in a 2%-agarose gel in Tris-Acetate-Ethylenediaminetetraacetic acid (EDTA) (40 mmol/l Tris acetate, 1 mmol/l EDTA; pH 8.5). Sample volumes were adjusted to achieve similar DNA concentrations across samples to avoid an impact of the DNA concentration on the amplification results. Details regarding quantitative PCR protocol (Metzler-Zebeli et al., Reference Metzler-Zebeli, Khol-Parisini, Gruber and Zebeli2015), primer sets used and PCR efficiencies are given in the Supplementary Material S2 and Supplementary Table S1, respectively.
Statistical analyses
Data were analyzed using the PROC MIXED of SAS (version 9.2; SAS Institute Inc., Cary, NC, USA). Before statistical analysis, data of absolute abundance of total bacteria and fungi were log-transformed. We employed two separate ANOVA to determine the effects of transient or continuous grain feeding on the variables measured. For each feeding model, the ANOVA included the fixed effects of feeding phase (base v. re-challenge for the transient model, and base v. week-1 v. week-4 of challenge for the continuous model), incubation time and feeding phase and time interaction, and the cow as random effect. All measurements taken on the same animal but at different weeks were considered as repeated measures in the ANOVA with a compound symmetry variance–covariance matrix (Littell et al., Reference Littell, Pendergast and Natarajan2000). Data at 0 h of incubation were used as co-variable for the analysis of the extent of in situ nutrient degradation. Following Littell et al. (Reference Littell, Pendergast and Natarajan2000), the linear mixed model of repeated measures with a covariate (0 min data) is shown as follows:
 $$Y_{{ijk}}\, {\equals}\,\mu {\plus}A_{i} {\plus}{\rm }B_{ij} {\plus}{\rm }C_{k} {\plus}{\rm }AC_{{ik}} {\plus}{\rm }\beta X_{{ij}} {\plus}{\rm }e_{{ijk}} $$
where Y is the dependent variable, μ the overall mean, A i the fixed effect of the ith feeding phase, B ij the random effect of the jth animal in the ith phase, C k the fixed effect of the kth incubation time, AC ik the interaction between the two fixed effects, β the coefficient on the covariate X ij for the jth animal in the ith phase and e the residual error. Data for pH and temperature were analyzed without the covariate.
In addition, influences of cows’ variation with respect to the grain challenge on the ruminal pH and temperature and in situ degradation were tested using data during the grain-rich feeding (baseline excluded) and only during 24 to 48 h of incubation. Regardless of the feeding model, cows were classified as ‘responder’ when their ruminal profile met the SARA criteria (i.e. pH below 5.8 for at least 330 min, Zebeli et al., Reference Zebeli, Dijkstra, Tafaj, Steingass, Ametaj and Drochner2008), the rest who never experienced SARA were classified as ‚‘non-responder’. The two groups of cows were compared for their differences using the PROC MIXED of SAS. Again, for the analysis of degradation data of the cow groups, 0 h degradation was used as covariate in the model. The graphical results of these data were derived from the PROC BOXPLOT of SAS. All values are reported as least square means. All comparisons indicated by superscripts were based on paired t tests and deemed significant at P⩽0.05, whereas a trend was set at 0.05<P⩽0.10. The pairwise contrasts were interpreted regardless of an interaction of the main effects.
Results
Ruminal nutrient degradation of grass silage
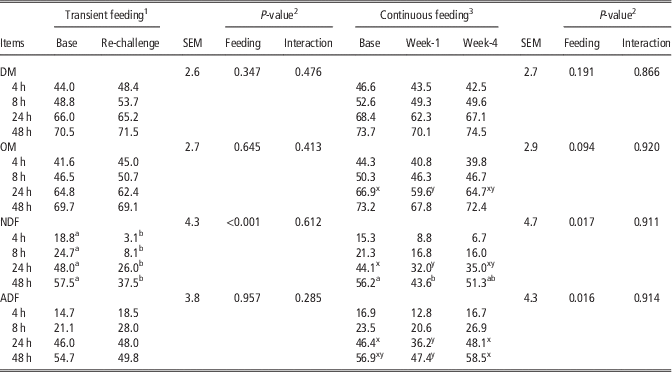
The extent of in situ degradation of nutrients in the grass silage increased with time in both feeding models (Table 1). In the transient model grain feeding only affected NDF degradation of the grass silage (P<0.001). Pairwise contrasts showed that the degradation at all incubation times was lower in the re-challenge compared with the baseline (P<0.05). There was no interaction between feeding and incubation time for all parameters. For the continuous model, there was a feeding effect on NDF (P=0.017) and ADF (P=0.016) degradation of the grass silage. Pairwise contrasts showed lower NDF at 48 h of incubation (P<0.05) and ADF degradation at 24 and 48 h (P⩽0.10) of incubation in week-1, but not in week-4 compared with the baseline. There was no interaction between feeding and incubation time found for all parameters of the continuous model.
In situ nutrient degradation (% of supply) of grass silage relative to incubation time as affected by transient or continuous concentrate-rich feeding and incubation time (n=4 cows/treatment)

DM=dry matter; OM=organic matter.
a,bMeans within each feeding model and incubation time differ at P⩽0.05 based on paired t tests.
x,yMeans within each feeding model and incubation time tend to differ at 0.05<P⩽0.10 based on paired t tests.
1 Forage-only feeding (baseline) followed by including 1-week challenge using a 60% concentrate, 1-week break and then re-challenge for 2 weeks. The in situ measurement was conducted during baseline (base) and during week-1 of the re-challenge (re-challenge).
2 For both feeding models, a time effect (P<0.01) was found for all parameters.
3 Forage-only feeding (baseline) followed by 60% concentrate challenge for a continuous 4 weeks. The in situ measurement was conducted during baseline (base), in the 1st week (week-1) and the last week (week-4) of concentrate challenge.
Ruminal nutrient degradation of hay
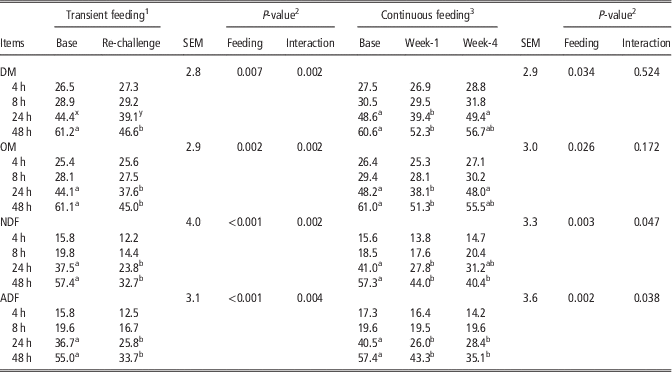
For both feeding models, degradation extents of the nutrients in the hay increased with incubation time (P<0.001, Table 2). For the transient model, in addition to an effect of feeding alone (P<0.01), there was also a feeding and incubation time interaction for degradation of all nutrients in the hay (P<0.01). Pairwise contrasts indicated that the DM degradation at 24 (P<0.10) and 48 h (P<0.05) of incubation in the re-challenge was ~0.8 fold that of the baseline. At both incubation times the extent of ADF and NDF degradation was 0.6 fold that of the baseline (P<0.05). For the continuous model, an effect of feeding was noted for the degradation of all nutrients (P=0.034, 0.026, 0.003 and 0.002 for DM, OM, NDF and ADF degradation, respectively) and there was a feeding×time interaction for the extent of NDF (P=0.047) and ADF (P=0.038) degradation. Pairwise contrasts showed lower degradation of DM and OM at 24 and 48 h of incubation in week-1 (P<0.05), but not in week-4 compared with the baseline. On the contrary, degradation of NDF and ADF during 24 to 48 h of incubation was suppressed in both week-1 and week-4 of the grain feeding compared with the baseline (P<0.05).
In situ nutrient degradation (% of supply) of hay relative to incubation time as affected by transient or continuous concentrate-rich feeding and incubation time (n=4 cows/treatment)

DM=dry matter; OM=organic matter.
a,bMeans within each feeding model and incubation time differ at P⩽0.05 based on paired t tests.
x,yMeans within each feeding model and incubation time tend to differ at 0.05< P⩽0.10 based on paired t-tests.
1 Forage-only feeding (Baseline) followed by including 1-week challenge using a 60% concentrate, 1-week break, and then re-challenge for 2 weeks. The in situ measurement was conducted during baseline (Base) and during week-1 of the re-challenge (re-challenge).
2 For both feeding models, a time effect (P<0.05) was found for all parameters.
3 Forage-only feeding (Baseline) followed by 60% concentrate challenge for a continuous 4 weeks. The in situ measurement was conducted during baseline (Base), in the 1st week (Week-1) and the last week (Week-4) of concentrate challenge.
Microbial abundances on grass silage
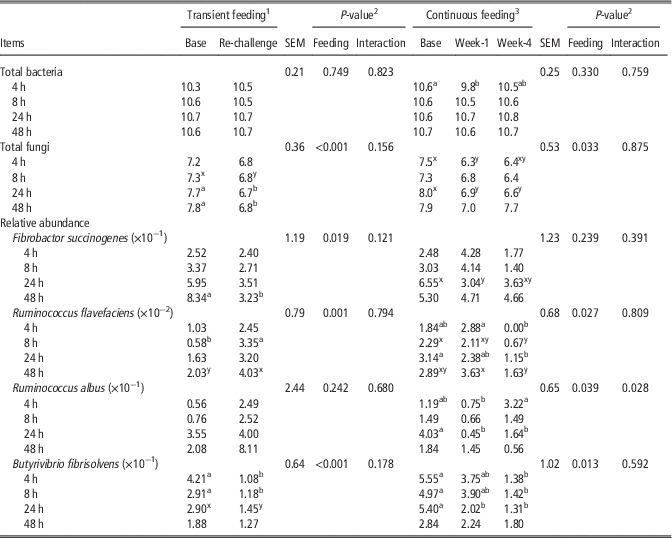
Changes in microbial abundances on incubated samples with time of in situ incubation of grass silage are shown in Table 3. Bacterial and fungal abundances at 0 h of incubation corresponded to the natural microbial colonization of incubated feed samples and were used as a covariate in the statistical analysis. Total bacterial and fungal gene copies on the grass silage at 0 h incubation were on average 8.6 and 5.5 log units, respectively. For the transient model, only total bacterial number (overall time effect P=0.045) and relative abundance (% of total bacteria) of F. succinogenes (time effect P=0.021) gradually increased with time. There was a feeding effect on total fungal number (P<0.001), relative abundances of F. succinogenes (P=0.019), R. flavefaciens (P=0.001) and Butyrivibrio fibrisolvens (P<0.001) but a feeding×time interaction was absent for all microbial variables. Pairwise contrasts indicated that the fungal number at 24 and 48 h of incubation and relative abundance of F. succinogenes at 48 h of incubation in the re-challenge were lower compared with the baseline (P<0.05). The re-challenge decreased relative abundance of B. fibrisolvens during the first 24 h of incubation. On the contrary, relative abundance of R. flavefaciens at 8 (P<0.05) and 48 h (P<0.10) of incubation was increased in the re-challenge compared with the baseline.
Total bacterial and fungal abundances (log10 gene copies/g sample) and relative abundances of target ruminal fibrolytic bacterial species (% of total bacteria) on grass silage in response to in situ incubation time as affected by transient or continuous concentrate-rich feeding (n=4 cows/treatment)

a,bMeans within each feeding model and incubation time differ at P⩽0.05 based on paired t tests.
x,yMeans within each feeding model and incubation time tend to differ at 0.05<P⩽0.10 based on paired t tests.
1 Forage-only feeding (baseline) followed by including 1-week challenge using a 60% concentrate, 1-week break, and then re-challenge for 2 weeks. The in situ measurement was conducted during baseline (base) and during week-1 of the re-challenge (re-challenge).
2 A time effect (P⩽0.05) was found only for the total bacteria and the relative abundance of F. succinogenes in the transient model.
3 Forage-only feeding (baseline) followed by 60% concentrate challenge for a continuous 4 weeks. The in situ measurement was conducted during baseline (base), in the 1st week (week-1) and the last week (week-4) of concentrate challenge.
For the continuous model, no time effect was found. There was a feeding effect on total fungal number (P=0.033). Pairwise contrasts indicated a trend for lower fungal number at 24 h of incubation in both week-1 and week-4 compared with the baseline (P<0.10). There was a feeding effect on relative abundance of R. flavefaciens (P=0.027), R. albus (P=0.039) and B. fibrisolvens (P=0.013). Overall, the abundances of R. flavefaciens and B. fibrisolvens in week-4 and R. albus in week-1 were lower compared with the baseline. An interaction between feeding and incubation time was found only for relative abundance of R. albus (P=0.028). As shown by pairwise contrasts, in contrast to the findings at 4 h of incubation, the abundance of R. albus at 24 h of incubation decreased in both week-1 and week-4 compared with the baseline (P<0.05).
Microbial abundances on hay
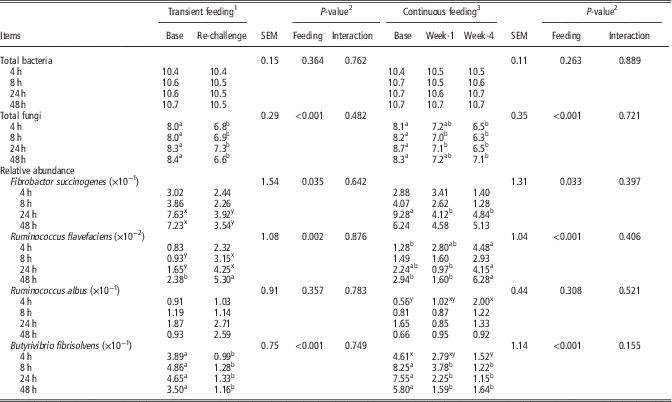
Before incubation (0 h samples) total bacterial and fungal gene copies on hay were on average 9.3 and 5.6 log units, respectively. For the transient model, except for relative abundance of R. flavefaciens (P=0.092), other microbiota studied did not change with time (Table 4). Fungal numbers at all incubation times in the re-challenge were lower than those in the baseline (P<0.05), marking an overall effect of feeding (P<0.001). The same was true for relative abundance of B. fibrisolvens (feeding effect P<0.001) in the transient model. Relative abundances of F. succinogenes (P=0.035) and R. flavefaciens (P=0.002) were affected by feeding. Specifically, according to pairwise contrasts, relative abundance of F. succinogenes in the re-challenge decreased at 24 and 48 h of incubation (P<0.10), but relative abundance of R. flavefaciens during 8 to 48 h of incubation increased compared with the baseline (P<0.10 for 8 to 24 h, and P<0.05 for 48 h of incubation).
Total bacterial and fungal abundances (log10 gene copies/g sample) and relative abundances of target ruminal fibrolytic bacterial species (% of total bacteria) on hay in response to in situ incubation time as affected by transient or continuous concentrate-rich feeding (n=4 cows/treatment)

a,bMeans within each feeding model and incubation time differ at P⩽0.05 based on paired t tests.
x,yMeans within each feeding model and incubation time tend to differ at 0.05<P⩽0.10 based on paired t tests.
1 Forage-only feeding (baseline) followed by including 1-week challenge using a 60% concentrate, 1-week break, and then re-challenge for 2 weeks. The in situ measurement was conducted during baseline (base) and during week-1 of the re-challenge (re-challenge).
2 A time effect (P⩽0.05) was found only for the abundance of total bacteria and the relative abundance of F. succinogenes in the continuous feeding model.
3 Forage-only feeding (baseline) followed by 60% concentrate challenge for a continuous 4 weeks. The in situ measurement was conducted during baseline (base), in the 1st week (week-1) and the last week (week-4) of concentrate challenge.
For the continuous model, total bacterial number (P=0.002) and relative abundances of F. succinogenes (P=0.001) increased with time. As indicated by an overall effect of feeding (P<0.001), fungal number and relative abundance of B. fibrisolvens at all incubation times were decreased in week-1 and week-4 of the continuous model compared with the baseline (P<0.05). In addition, there was an effect of feeding on relative abundances of F. succinogenes (P=0.033) and R. flavefaciens (P<0.001). Pairwise contrasts showed in both week-1 and week-4 the abundance of F. succinogenes at 24 h of incubation was lowered, but relative abundance of R. flavefaciens at 24 and 48 h of incubation was increased in week-4 compared the baseline (P<0.05).
Responders and non-responders of ruminal pH and fiber degradation
Results of mean, minimum and maximum ruminal pH, time (min per incubation stage) at pH below 5.8 or 5.5, mean ruminal temperature (°C) and time at temperature exceeding 39.5°C (min per incubation stage) in response to incubation time and feeding model are shown in the Supplementary Table S2.
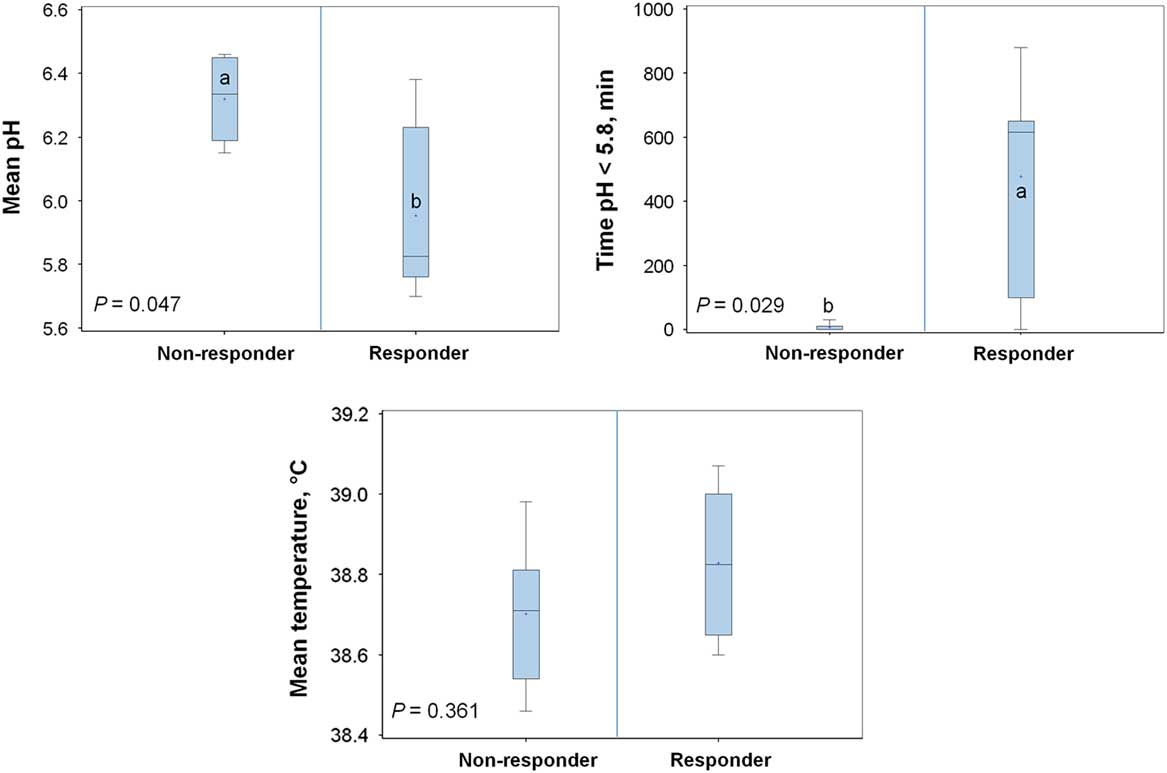
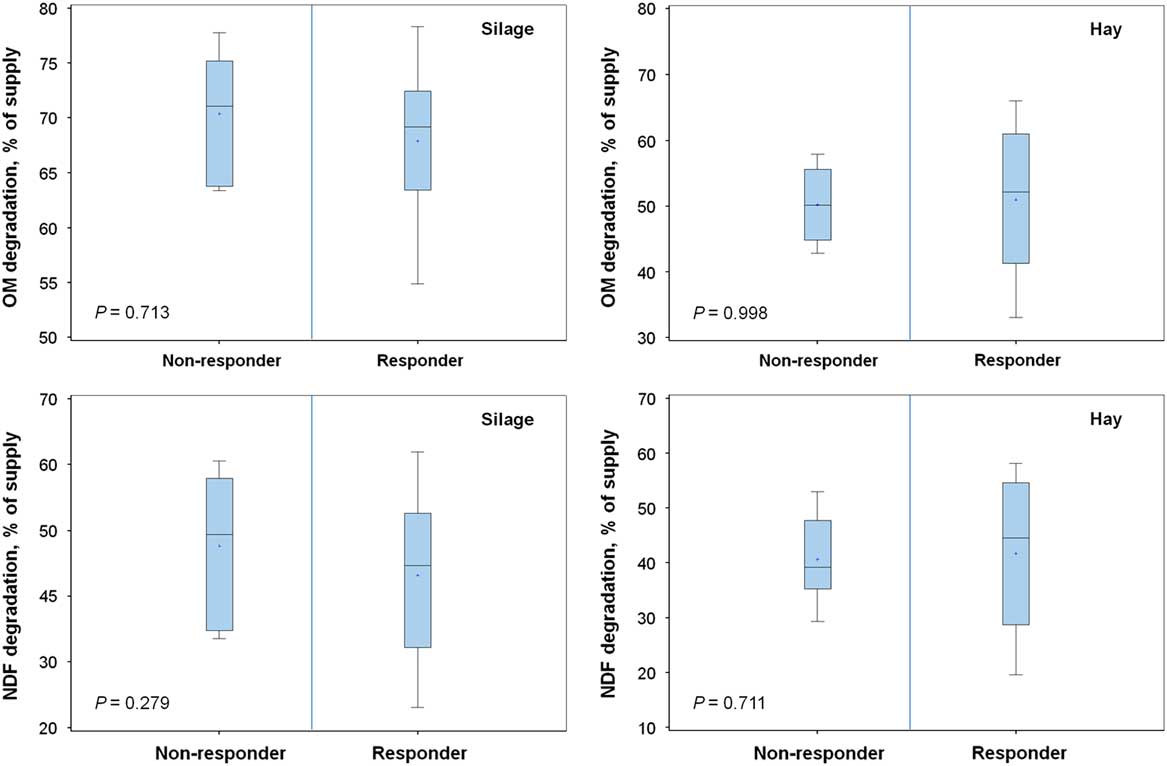
According to the pH profile, two cow groups were categorized as responder and non-responder. Comparisons of the two animal groups based on their responses to the grain challenge for ruminal pH and temperature are shown in Figure 1. Independent of feeding model, we found that four cows were non-responders, meaning they never showed SARA (time pH 5.8>330 min); whereas the other four cows were responders (two of them were from the continuous model and the other two from the transient model). However, one cow in the continuous model showed SARA only in week-1, whereas another cow showed SARA only in week-4. Both responders in the transient model displayed similar severity of SARA in the re-challenge. As such, greater deviations of mean pH and time at pH<5.8 were found for cows in the responder group compared with those in the non-responder group. Mean pH during 24 to 48 h of incubation of the responder group was 5.9 which was 0.37 pH units lower than the non-responder group (P=0.047). The responder group spent on average 477 min at pH<5.8, whereas the non-responder spent only about 7 min (P=0.029). Both groups showed comparable variations within group in mean ruminal temperature and average values of both groups were not different (non-responder=38.7, responder=38.8°C). Despite the great difference in pH profile, both cow groups showed no differences in the extent of nutrient degradation at 48 h of incubation for both forages (Figure 2). Nevertheless, larger variations in the extent of OM and NDF degradation were found for the responder group. For both forages the abundances of the microbial groups studied were similar between both cow groups (P>0.05), except for the relative abundance of F. succinogenes (P=0.04) in the hay samples which was higher in the non-responder group (data not shown).
Box plots of ruminal pH and mean ruminal temperature during 24 to 48 h of in situ incubation of non-lactating cows grouped according to ruminal pH responses to the high-concentrate challenge. Responders are cows showing pH below 5.8 for at least 330 min/day in 1 or more weeks of concentrate feeding, cows did not meet the criteria were non-responders. The box plots illustrate maximum (top line), minimum (bottom line), mean (+), median (line inside the box), 75% (top of the box) and 25% (bottom of the box) percentiles of data within group. Means marked with letters (a,b) differ at P⩽0.05.

Box plots of in situ ruminal organic matter (OM) and NDF degradation during 24 to 48 h of in situ incubation of cows grouped according to ruminal pH responses to the high-concentrate challenge. Responders are cows showing pH below 5.8 for at least 330 min/day in 1 or more weeks of concentrate feeding, cows did not meet the criteria were non-responders. The box plots illustrate maximum (top line), minimum (bottom line), mean (+), median (line inside the box), 75% (top of the box) and 25% (bottom of the box) percentiles of data within group.

Discussion
High-grain feeding can lead to decrease in ruminal pH (<5.8) rendering ruminal conditions unfavorable for fibrolytic microbes (Mickdam et al., Reference Mickdam, Khiaosa-ard, Metzler-Zebeli, Klevenhusen, Chizzola and Zebeli2016). Such disturbances in the ruminal environment can negatively affect ruminal fiber degradation (Krajcarski-Hunt et al., Reference Krajcarski-Hunt, Plaizier, Walton, Spratt and McBride2002). There is little evidence for long-lasting grain challenges (>1 week) on ruminal microbial adaptation (Tajima et al., Reference Tajima, Aminov, Nagamine, Matsui, Nakamura and Benno2001; Hook et al., Reference Hook, Steele, Northwood, Dijkstra, France, Wright and McBride2011). The authors showed that adaptation of dairy cattle to a 65% grain diet for 3 weeks led to changes in the diversity and community structure of ruminal bacteria (Hook et al., Reference Hook, Steele, Northwood, Dijkstra, France, Wright and McBride2011). The abundances of bacterial species found in the rumen of dairy cows shortly adapted (3 days) to a high-grain diet did not reflect well the abundances found after the prolonged diet adaptation (4 weeks) (Tajima et al., Reference Tajima, Aminov, Nagamine, Matsui, Nakamura and Benno2001). As such, the duration of grain challenge may influence ruminal nutrient degradation. Our results of the grass silage gave evidence that although the suppression occurred in the 1st week of the 60% concentrate feeding, the ruminal fiber degradation capacity for grass silage can be restored after 4 weeks of the continuous feeding, indicating an adaptation of fibrolytic activity in the rumen with time. When the grain feeding was interrupted (i.e. transient model), the diet change to a forage-only ration probably impeded these adaptive processes. In line with that, as reported in our companion studies, increased severity of ruminal pH suppression (Pourazad et al., Reference Pourazad, Khiaosa-ard, Qumar, Wetzels, Klevenhusen, Metzler-Zebeli and Zebeli2016) without an increase in the absorption of short-chain fatty acids (Qumar et al., Reference Qumar, Khiaosa-ard, Pourazad, Wetzels, Klevenhusen, Kandler, Aschenbach and Zebeli2016) were observed in both weeks of grain re-challenge, presumably linked to an interruption of functional adaptive responses of the rumen epithelium and decreased salivary buffering capacity (Dijkstra et al., Reference Dijkstra, Ellis, Kebreab, Strathe, López, France and Bannink2012). However, our presumption on the impeded adaptation of fibrolytic activity in the rumen must be interpreted with caution because data on the previous and later weeks of the re-challenge were not studied. Furthermore, it might still be possible that fiber degradation of the transient model would recover with extended time of re-challenge.
Roughage characteristics can interfere with an effect of high-grain feeding on fibrolytic activities (Martin et al., Reference Martin, Millet, Fonty and Michalet-Doreau2001) and nutrient degradation in the rumen (Li et al., Reference Li, Cao, Liu, Yang, Yao and Yan2014), and in our case the forage source also affected the restoration of ruminal fiber degradation capacity. Grass silage as the more easily degradable substrate indicated restored ruminal nutrient degradation in week-4, whereas with the less microbial degradable hay no restored fiber degradation could be found. By being differently degradable for rumen microbes, ruminal degradation of the forages would require different arsenal of microbial hemicellulolytic, cellulolytic and lignin-degrading capacities. Microbial degradation of lignin and cellulose was more affected than of hemicellulose by pH suppression (Colombatto et al., Reference Colombatto, Hervas, Yang and Beauchemin2003). Fungi are important for degradation of fibrous materials (Ho and Abdullah, Reference Ho and Abdullah1999), especially of more fibrous and lignified feed like hay (Akin et al., Reference Akin, Lyon, Windham and Rigsby1989). Fungi are more sensitive to low pH than ruminal bacteria (Mickdam et al., Reference Mickdam, Khiaosa-ard, Metzler-Zebeli, Klevenhusen, Chizzola and Zebeli2016). Accordingly, decreased degradation of NDF and ADF in the hay was accompanied by decreased fungal abundance occurred persistently in both feeding models.
In the present study, we investigated the microbial abundance attached on in situ bag samples. The attachment of bacteria to feed particles through a glycocalyx is pH sensitive (McAllister et al., Reference McAllister, Bae, Yanke, Cheng and Ha1994), thus we expected a negative effect of depressed ruminal pH as a result of the grain challenges on the colonization of forage particles. However, we found no change in total bacterial number on in situ bag samples, but the relative abundances of some bacterial species were affected by both feeding models. Specifically, fungi, B. fibrisolvens and, to a lesser extent, F. succinogenes group were more sensitive to the challenge. Opposite to F. succinogenes, the findings in the transient model showed that R. albus and R. flavefaciens could benefit from mild conditions of pH depression. Their growth and metabolic activity might be differently affected by the ruminal environment because gram-positive ruminococci and gram-negative Fibrobactor spp express contrasting fibrolytic enzyme systems (Flint et al., Reference Flint, Scott, Duncan, Louis and Forano2012). For instance, both ruminococci produce prominent GH48 enzymes and have been found to have multi-domain organization and cell-anchoring modules (dockerins and/or cohesions), whereas F. succinogenes lacks a GH48 exo-cellulase and dockerin sequences (Flint et al., Reference Flint, Scott, Duncan, Louis and Forano2012). Also, decreased abundances of these ruminococci occurred with severe grain-induced SARA (Tajima et al., Reference Tajima, Aminov, Nagamine, Matsui, Nakamura and Benno2001; Khafipour et al., Reference Khafipour, Li, Plaizier and Krause2009), but not with mild grain-induced and alfalfa pellet-induced SARA (Khafipour et al., Reference Khafipour, Li, Plaizier and Krause2009). Our microbial results observed on in situ bag samples and previous observations in ruminal fluid (Khafipour et al., Reference Khafipour, Li, Plaizier and Krause2009; Palmonari et al., Reference Palmonari, Stevenson, Mertens, Cruywagen and Weimer2010) suggest an ability of ruminal fibrolytic microorganisms to adapt to a certain level of challenging environments.
The present results did not indicate a strong negative effect of pH depression on in situ ruminal degradation because both cow groups differing in their pH in response to the feeding had similar in situ degradabilities. Moreover, alterations in the abundances of the fibrolytic microbes found did not fully explain the fiber degradation results. These might be attributed to several reasons. First, it might be that the pH drops were not severe enough to greatly perturb the fibrolytic microbes and therefore the fiber degradation. Not all bacterial species participating in fiber degradation in the rumen may adapt to prolonged grain challenges (Khafipour et al., Reference Khafipour, Li, Plaizier and Krause2009; Hook et al., Reference Hook, Steele, Northwood, Dijkstra, France, Wright and McBride2011) and that there might be other bacterial species responsible for fiber degradation which might have been affected but were not investigated in the present study. Furthermore, an effect of our grain challenge may be, to some extent, related to non-cellulolytic bacteria because under lower pH they can fill in the niche and compete among themselves for hydrolytic products that are released by cell-bound cellulolysis enzymes which can take place at low pH (5.4 - 6.0) (Mouriño et al., Reference Mouriño, Akkarawongsa and Weimer2001).
Conclusions
Effects of the high-grain diet (60% of diet DM) on in situ ruminal fiber degradation depended on duration and condition of the feeding as well as type of incubated forage. Initial suppression of fiber degradation was seen at 1 week of the grain feeding, but the degradation capacity to degrade fiber components of grass silage recovered after 4 weeks of this continuously high-grain feeding. This restoration was, however, not evident with fiber-rich hay. The associations between the magnitude of ruminal pH suppression and ruminal fiber degradation were not obvious. Cows that were sensitive to the grain challenge did not differ in their extent of ruminal fiber degradation from the tolerant ones. Ruminal fungi were more sensitive to the challenge than ruminal bacteria. Of bacterial species investigated, the abundances of B. fibrisolvens group and F. succinogenes were more affected by the high-grain diet, regardless of the feeding model.
Acknowledgments
The authors like to acknowledge the assistance of M. Qumar, S. Wetzels, M. Salzmann and S. Repanelis (Vetmeduni Vienna) during the experiment and of L.-M. Meyer, A. Dockner, M. Wild, and S. Leiner (Vetmeduni Vienna) for laboratory analysis. The authors are grateful to Dr W. Pohl, E. Draxler and the staff of the dairy research station ‘Kremesberg’ at Vetmeduni Vienna for their excellent collaboration. Funding for this research was provided through project ‘D-I.INFLACOW, LS12-010’ funded by Vienna Science and Technology Fund (WWTF) which is highly appreciated.
Supplementary Material
To view supplementary material for this article, please visit https://doi.org/10.1017/S1751731117001112