INTRODUCTION
Fresh water scarcity is becoming an increasing problem, primarily in arid and semi-arid regions of the world. The Mediterranean countries are characterized by a severe water imbalance. In these areas, demands on fresh water resources are increasing due to population growth, increased per capita consumption, and industrial and agricultural activities (Schulze et al. Reference Schulze, Beck and Müller-Hohenstein2005; Gregory Reference Gregory, Fotyma and Kaminska2006). Under such conditions, fresh water is an increasingly limited resource (European Union 2000), becoming more and more a limiting factor thus leading to the worsening of competition for water between agriculture, urban and industrial uses. A direct consequence of water scarcity is represented by soil secondary salinization caused by the use of saline water for irrigation, especially in coastal areas of Mediterranean countries; the over-exploitation of phreatic wells by farmers during the summer for irrigation purposes causes a decrease in the groundwater table level and subsequent intrusion of seawater. Drought and increased salinization of arable land may result in 50% land loss by the year 2050 (Bray et al. Reference Bray, Bailey-Serres, Weretilnyk, Gruissem, Buchanan and Jones2000; Wang et al. Reference Wang, Vinocur and Altman2003; Gregory Reference Gregory, Fotyma and Kaminska2006). The introduction of crops and varieties tolerating saline water and drought, with acceptable yields, is a promising solution for efficiently integrated water management in the agricultural sector and brings a new perspective for Mediterranean agriculture to limit its water consumption.
Grain amaranth (Amaranthus spp.) is considered adaptable to different soil and climatic conditions and can be cultivated in semi-arid environments; it adapts to a great number of environments, is tolerant to a range of abiotic factors and as a C4 species, it tolerates high temperatures and light intensities (Jacobsen & Mujica Reference Jacobsen and Mujica2003; Jacobsen et al. Reference Jacobsen, Mujica and Ortiz2003, Pulvento et al. Reference Pulvento, Lavini, Riccardi, d'Andria and Ragab2015a , Reference Pulvento, Riccardi, Lavini, d'Andria and Ragab b ).
Amaranth used for seed production is native to the New World and was grown as the main grain crop by the Aztecs from 5000 BC (Kauffman & Weber Reference Kauffman, Weber, Janick and Simon1990; Stallknecht & Schulz-Schaeffer Reference Stallknecht, Schulz-Schaeffer, Janick and Simon1993). The amaranth genus consists of 60–70 species, over 400 varieties within species and it is found all over the world in both temperate and tropical climates. Species fall roughly into one of four categories: grain, vegetable, ornamental and wild plant. The interest in the cultivation of amaranth is mainly related to the absence of gluten, high protein content (greater than that of common cereals), balanced composition of essential amino acids and high fat and dietary fibre content (Písaříková et al. Reference Písaříková, Kráčmar and Herzig2005; Barba de la Rosa et al. Reference Barba de la Rosa, Fomsgaard, Laursen, Mortensen, Olvera-Martínez, Silva-Sánchez, Mendoza-Herrera, González-Castañeda and De León-Rodríguez2009). Some studies have described amaranth as a drought-tolerant species that can grow under low soil moisture conditions (Whitehead & Singh Reference Whitehead and Singh1992; Liu & Stützel Reference Liu and Stützel2002, Reference Liu and Stützel2004); Myers (Reference Myers and Janick1996) compared physiological traits of amaranth with other species and observed that it is able to reduce stomatal conductance and transpiration under increasing drought conditions and then recover when soil moisture increases. Mlakar et al. (Reference Mlakar, Bavec, Jakop and Bavec2012), studying the drought stress at different phenological stages in Amaranthus cruentus, observed that water deficit during inflorescence formation influenced grain yield negatively, while drought conditions during the vegetative growth stages improved assimilate allocation to above-ground biomass and seed yield.
Few studies regarding amaranth's resistance to salinity stress have been conducted. Shimose et al. (Reference Shimose, Sekiya, Kimura and Suzuki1991) classified Amaranthus tricolor as relatively tolerant to salinity when treated with nutrient solutions with electrical conductivity (EC) from 0 to 60 dS/m. Wang et al. (Reference Wang, Meng, Ishikawa, Hibino, Tanaka, Nii and Takabe1999) and Wang & Nii (Reference Wang and Nii2000) also observed salt tolerance of Amaranthus tricolor within roughly the same range of conductivity.
El Youssfi et al. (Reference El Youssfi, Choukr-Allah, Zaafrani, Mediouni, Sarr and Hirich2012), under field conditions, irrigated three varieties of amaranth with treated wastewater with EC from 0·92 to 6 dS/m; they observed that increasing salinity reduced vegetative growth (plant height, leaf area and dry weight (DW)) of the three varieties but the seed yield of one genotype (a211) indicated that it was less sensitive to salinity stress.
There seem to be differences in salinity tolerance among amaranth species. Amaranth hypochondriacus and A. cruentus survived a salinity level of 200 mm of sodium chloride (NaCl), which was not the case for Amaranthus tricolor, probably due to thinner leaves, more stomata per unit leaf area and larger stomatal aperture (Omami et al. Reference Omami, Hammes and Robbertse2006).
All these studies have dealt separately with salt and drought stress, but, under field conditions, salt stress is also accompanied by drought. Omami & Hammes (Reference Omami and Hammes2006) considered the combined effect of water and salt stress on vegetative and physiological parameters at leaf level on Amaranthus tricolor and A. cruentus genotypes in a greenhouse experiment; they showed that the combined effect of salt and drought stress is less detrimental to plant growth than the sum of the individual factors.
Given the increased frequency of salinity and drought stress in the Mediterranean area and the scarcity of information on amaranth response to combined salt and drought stress, the present work aims to evaluate the quantitative and qualitative response of the new climate-proof crop (Amaranthus spp.) with improved stress tolerance, by studying environmental effects related to irrigation water quality and accelerating adoption of agricultural practices and technologies to meet future constraints imposed by climate change.
MATERIALS AND METHODS
Experimental site
The field trial was performed in a 2-year period 2009/10 at the experimental station of the National Research Council (CNR) – Institute for Agricultural and Forest Mediterranean Systems (ISAFoM) at Vitulazio (CE) in the lower part of the Volturno river plain (14°50′E and 40°07′N; 25 m a.s.l.). The experimental site is characterized by a sub-humid Mediterranean climate, with average annual rainfall of 800 mm and average annual reference evapotranspiration of 3·8 mm.
Experimental design
The study considered one accession (A12) of grain Amaranth (A. hypochondriacus) provided by Universities of Århus (I. Fomsgaard) in Copenhagen (S. E. Jacobsen). Comparisons were made between a control, with restitution of all the water necessary to replenish the soil layer explored by roots (0·00–0·36 m) to field capacity (FC) and two deficit irrigation treatments with restitution of 0·25 and 0·50 of the water volume used for the fully irrigated treatment (control). For each irrigation level a non-saline treatment irrigated with fresh water (100N, 50N and 25N) and a treatment irrigated with saline water at a known salt concentration (100S, 50S and 25S) were performed. The experiment was a randomized complete block design with three replicates; each main plot was 6 × 6 m2 and contained 12 rows spaced 0·50 m apart. There was a sampling area of 10 m2 for the final harvest (H) at the centre of each plot. On the lateral rows of each plot, plant samples were collected for growth analysis and phenological observations every 2 weeks.
On 15 May 2009 and 22 April 2010, the crop was sown by hand with 8 kg/ha of seed. Germination occurred after 2 days, and plant establishment was uniform and very good. Although amaranth self-regulates its density through competition (Covas Reference Covas1987), plot stands were sown with twice the normal seed rate and hand-thinned at the eight-leaf stage to the desired plant populations (200 000 plants/ha). Maximum sowing depth was 1·5 cm.
Preliminary operations
The trial was carried out on a land area of 70 × 50 m2, not cultivated for the previous 7 years. Before sowing, in October 2008, soil treatment with glyphosate (3 l/ha) was used to control weeds. After 20 days sub-soiling was carried out in order to break up the soil and allow drainage and aeration even in the deeper layers. In both trial years, before spring sowing, soil was tilled twice and fertilizers applied with 40 kg nitrogen/ha and 60 kg phosphorus/ha. The nitrogen (N) was divided into two applications: half was applied at pre-sowing and half at the four leaf stage. Nitrogen was supplied as ammonium nitrate (NH4NO3) at 34·5% of N, while phosphorus (P) was applied, as single superphosphate (P2O5) at 19% of P. It was not necessary to supply potassium (K) because for the experimental soil it was not limiting.
Irrigation system and scheduling
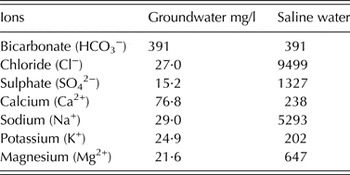
Before sowing but after soil preparation, a drip irrigation system was installed. This was fed by two 80 000-litre collection tanks, next to the experimental plots, which were filled with water at the beginning of each irrigation and emptied and cleaned out at the end of the irrigation. The water was pumped out of the tanks by four submerged pumps passing two sand filters, one for each tank, and then distributed through a system of pipes. This consisted of two main supply pipes connected to a network of pipes. These were placed along the plots, with drip lines at intervals of 0·5 m and self-compensating drip emitters every 0·3 m with a nominal flow rate of 4 l/h. The two tanks were used to keep the saline and non-saline treatments separate. Salt was dissolved in the tank used for saline water before every irrigation session. Irrigation was carried out at fixed weekly intervals. Saline water was groundwater with dissolved sodium chloride (NaCl) together with calcium chloride (CaCl2), potassium chloride (KCl), magnesium chloride (MgCl2) and magnesium sulphate (MgSO4) (Table 1). These salts were added in sufficient quantities to obtain the same stoichiometric balance as seawater. The conductivity achieved in the solution 1/1 (seawater/groundwater) was about 22 dS/m.
Ionic concentration of groundwater at the beginning of irrigation cycle and of saline irrigation water after addition of salts

Soil data collection
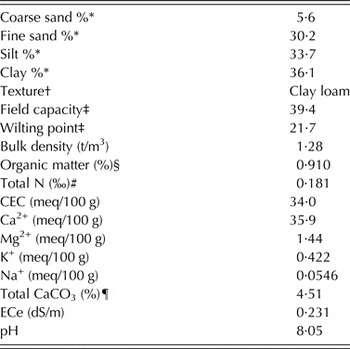
In 2009, soil chemical and physical properties of the experimental site were recorded (United States Department of Agriculture 2004). Field capacity and wilting point were measured by extraction of water from the sample of undisturbed soil previously saturated and subjected to constant pressures (0·03 and 1·5 MPa) until equilibrium was achieved with the pressure applied (Richards’ pressure plate apparatus), i.e. soil matrix potential. The principal chemical and physical characteristics of the soil are illustrated in Table 2.
Chemical and physical traits of soil layer 0–120 cm, at the beginning of first irrigation cycle

N, Nitrogen; CEC, cation exchange capacity; Ca2+, calcium; Mg2+, magnesium; K+, potassium; Na+ sodium; CaCO3, calcium carbonate; ECe, electrical conductivity of soil saturated paste extract.
* Wet sieving and sedimentation method.
† USDA soil texture classification.
‡ Percentage of volume
§ Walkley–Black method.
# Kjeldhal method.
¶ Dietrich Fruhling gaz volumetric method.
Soil moisture was measured using the thermo-gravimetric method, via soil sampling by a probe (0·08 m in diameter and 0·12 m long) in each plot, at the following depths 0–0·12, 0·12–0·36, 0·36–0·60 and 0·60–0·96 m. Volumetric moisture measurements were carried out before and 24 h after each watering and after rainfall of at least 5 mm. Rainfall lower than 5 mm within 24 h was not considered of importance when estimating watering volume. Events during the irrigation session or before watering were considered effective for a maximum value equal to the capacity of the soil layer explored by the roots to retain water at the time of the event. Rain in the 24 h following watering was not considered useful for the fully irrigated treatments, since the soil layer explored by the roots was already at field capacity.
In both years the EC of the soil was measured before the crop was transplanted, during and at the end of the crop cycle. The soil samples were taken between the rows at the centre of the plots and at the same depth of soil used to measure moisture, in order to evaluate the variations of this parameter in relation to the soil water content. The EC of the soil was measured on an aqueous soil extract (ratio of water/soil = 2·5/1) and the values were then related to those of the concentration in EC of soil saturated paste extract (ECe) using the equation [y = 3·693 x] obtained by the correlation between the values of conductivity of the aqueous extract and those of the saturated paste (R 2 = 0·98).
Measurements during the crop cycle and at harvest
Measurements of air temperature and humidity, wind speed and direction, global solar radiation and rainfall were collected every 5 min and averaged every 60 min. Moreover the reference evapotranspiration (ET0) was automatically calculated by the Penman Monteith equation using ‘iMETOS® software’ (Pessl Instruments GmbH Werksweg 107, 8160 Weiz Austria).
During the crop cycle the phenological stages of the accession were measured. The criteria to determine definitive physiological maturity have not yet been established, but the change in colour of the panicle is the trait used most commonly. The seeds are hard and it is not possible to scratch them using the fingernails. At this stage, the seeds tend to fall if the panicle is shaken. Harvest happens when the seeds are at physiological maturity (seed moisture is about 10 %). The plant in senescence has a dry-brown colour and the leaves fall.
At H, all the plants in a central 10 m2 sampling area of each plot were cut at the base and laid out on tarpaulins. The panicles, separated from the rest of the plant, were dried in the sun and then the seeds were removed in order to evaluate yield relative to each treatment applied. The seed samples were analysed chemically to evaluate the principal qualitative components. Analysis was carried out on the ground product which had been sieved to 2 mm to obtain the approximate composition: moisture (method AACC 44-01; AACC 2001), protein (N6·25, AACC method 44·01. 08·01. 44·16; AACC 2001), ash (AACC method 76·13; AACC 2001), total starch (AACC method 76–13; AACC 2001), total fats (AOAC method 920·39; AOAC 2005). The dietary fibre was obtained by the difference between the weight of the sample analysed and the sum of the previous components.
Statistical analysis
Analyses were performed using Statistical Analysis System (SAS Institute Inc., Cary, NC, USA). Data were averaged on a plot basis and subjected to analysis of variance (ANOVA). Variances were not homogeneous within years, thus the effect due to the experimental year was considered separately. Saline × irrigation treatment interactions were analysed. Means were compared with Least Significant Difference (LSD) test and considered significant at P ⩽ 0·05.
RESULTS
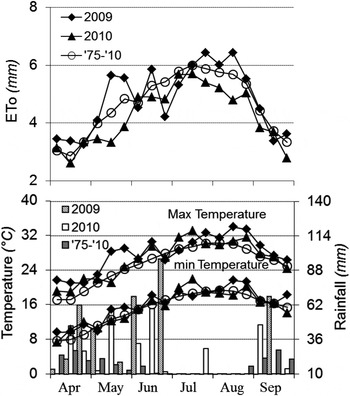
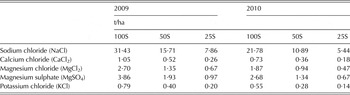
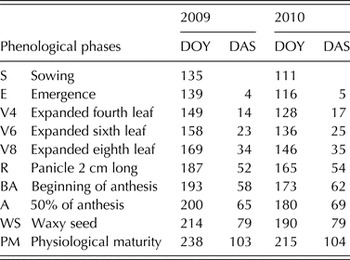
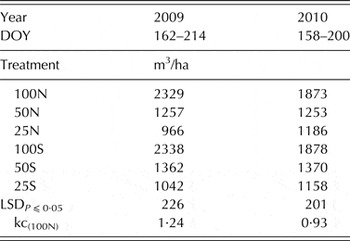
In both experimental years temperatures higher than the mean value in July and August were recorded (Fig. 1). In 2009 monthly precipitation was above average in the last part of spring from late April. Spring in 2010 was wetter than long-term average values from mid-April. In both years precipitation in May–June was above average, with no precipitation in July-August. Heavy rains in the first months of 2009 until the second week of June kept soil moisture level high, delaying soil preparation and sowing. Sowing took place on 20 May in 2009. Due to the specific pedo-climatic conditions the amaranth growth cycle was shorter, by about 30 days, than that reported in the literature (Putman Reference Putman1990; Kigel Reference Kigel and Paredes-López1994). In 2009 the abundant rainfall after sowing delayed differentiation of the irrigation treatments until a few days before panicle formation. During the crop cycle of 2010 the ET0 was always below average. In 2010, during the last part of March and April, the absence of rain and maximum temperatures higher than average facilitated soil preparation and sowing, which took place on 25 April. Four and six irrigations were supplied in the first (2009) and second year (2010), respectively (Table 3). Differences in seasonal irrigation volume between the two years were due to differences in evapotranspiration and to different rainfall occurring during the two irrigation periods. In 2010, each weekly irrigation volume was half of each irrigation volume in 2009. The amounts of salt supplied by irrigation water to the soil were higher in the first year than in 2010 (Table 4). There were 25 days between sowing dates in the two experimental years due to the heavy rains (about 322 mm) between the end of February and the beginning of May in 2009 (Table 5).
Seasonal climatic characteristics (evapotranspiration (ET0), 10-day total precipitation and 10-day mean temperature) of the years 2009 and 2010. 35-years (1975–2010) 10-day mean values are also reported.

Seasonal irrigation volumes for each treatment in the two experimental years

N, Non-saline treatment irrigated with fresh water; S, treatment irrigated with saline water at known salt concentrations.
Salt quantity distributed with irrigation water for each treatment during the two experimental years

S, treatment irrigated with saline water at known salt concentrations.
Amaranth (A12) phenology observed during the growing season of each experimental year

DOY, day of the year; DAS, days after sowing.
Soil moisture and water balance
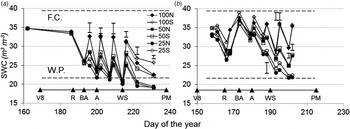
In 2009 during the vegetative stage, the natural water supply and the abundant rainfall after sowing (195 mm) was sufficient to satisfy crop requirements until the beginning of anthesis (day of the year (DOY) 195), when irrigation started (Fig. 2a). In the second year it rained 122 mm between sowing and the first irrigation (DOY 158), before the reproductive stage (Fig. 2b). In 2009, all treatments always showed a soil water content (SWC) below 35%. In 2010, this occurred from DOY 186 until H and only for the stressed treatments. The decrease in SWC of the deficit irrigation treatments in the layer below 0·36 m (data not reported) indicates that the reduced irrigation treatments partially recovered water from the deeper soil layer. Water consumption was higher than ET0 (Fig. 1) at peak demand for the 100N and 100S treatments in both years, while all the other treatments consumed less than ET0 during the whole crop cycle (Table 6). The crop coefficient (kc) calculated in the irrigation period of 2009 was higher than that in the second year because of higher evaporative demand (Fig. 1) during the 2009 irrigation period.
Seasonal evolution of volumetric soil water content during the irrigation period of 2009 (a) and 2010 (b) at 0–0·36 m soil depth. Dotted horizontal lines represent: FC, field capacity and WP, wilting point. The vertical arrows indicate the start of irrigation in the 2 years. Data are means of three replicates. Vertical bars indicate least significant difference for P ⩽ 0·05.

Soil water balance, in the layer 0–0·36 m, of the 2009 and 2010 irrigation periods. Relative crop coefficient (kc) is reported for treatment 100N. Least significant difference (LSD) value for P ⩽ 0·05 referred to the mean of three replications for each treatment by year is also reported

N, Non-saline treatment irrigated with fresh water; S, treatment irrigated with saline water at known salt concentrations; DOY, day of the year.
Soil electrical conductivity
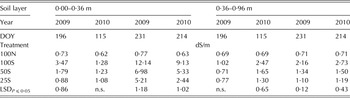
The ANOVA for ECe was made by DOY and by year. Throughout the irrigation period of the first trial (2009) the ECe was always significantly (P ⩽ 0·05) different within the saline treatments. However, ECe at the beginning of the second crop cycle (DOY 115), in the top 0·36 m soil layer, was not significantly different (Table 7). This was due to the winter rainfall of about 800 mm that prevented salt accumulation in the first layer of soil. The ECe of the saline treatments, measured at H in 2010 (DOY 214) in the top soil layer, was lower than that of 2009 (DOY 231). On the contrary, at the same date, the ECe of the saline treatments in the underlying soil layer was higher in 2010 than in 2009. At the end of the crop cycle ECe values reached 12 and 10 dS/m in 2009 and 2010, respectively, for the full irrigated saline treatment (100S) in the 0–0·36 m soil layer. During the period between H in the first year and sowing in the second year, the salts were displaced to the deeper layer (0·36–0·96) due to the rains.
Electrical conductivity of the soil saturated paste (ECe) at the beginning and at the end of the growing season in the two experimental years for top (0–0·36 m) and underlying soil layer (0·36–0·96 m). Least significant difference (LSD) value for P ⩽ 0·05 referred at the mean of three replications for each treatment by year and by day of the year (DOY) is indicated

N, Non-saline treatment irrigated with fresh water; S, treatment irrigated with saline water at known salt concentrations; n.s., not significant.
Yield, water productivity and salt tolerance
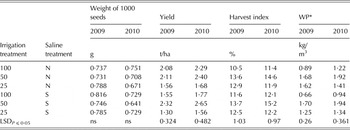
The statistical analysis of the main yield parameters, yield, 1000 seed weight, harvest index (HI) and water productivity (WP) showed significant differences (P ⩽ 0·05) for all the variables considered. The interaction of the irrigation level × saline treatment was significant (P ⩽ 0·05) for all variables (Table 8).
Yield components and water productivity (WP) as affected by irrigation and salinity levels in the two experimental years. Least significant difference (LSD) value for P ⩽ 0·05 referred at the mean of three replications for each treatment by year is indicated

N, Non-saline treatment irrigated with fresh water; S, treatment irrigated with saline water at known salt concentrations; ns, not significant.
* WP, Water productivity = ratio between total seed yield and cumulative consumption during irrigation period.
The highest yields were recorded for the 100N, 50N and 50S treatments with 2·08–2·32 t/ha in 2009 and 2·29–2·65 t/ha in 2010. Harvest index and WP were significantly (P ⩽ 0·05) higher for the 100N, 50N and 50S treatments in both years. Significantly (P ⩽ 0·05) lower yields were recorded for 25 (N and S) and 100S treatments. So, amaranth yield was negatively affected by lower irrigation volumes (25N and 25S) and by higher ECe in soil solution (100S). The seed weight was not influenced by the irrigation treatments applied, with average values of 0·75 g in 2009 and 0·71 g in 2010, in agreement with the values found by Rivelli et al. (Reference Rivelli, Gherbin, De Maria and Pizza2008) for two accessions of A. cruentus.
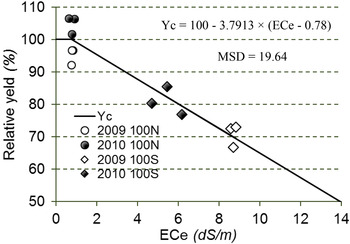
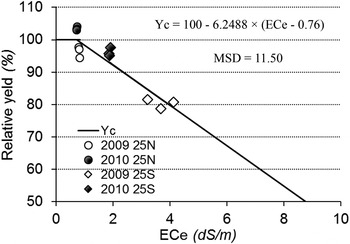
The salinity tolerance of amaranth A12 was evaluated by applying the Maas & Hoffman (Reference Maas and Hoffman1977) model. The ECe of 100S reached a mean weighted value during the growth cycle that is generally considered deleterious for moderately sensitive crops (about 8·7 dS/m; Fig. 3). At 50% yield reduction the ECe was 13·97 dS/m, so amaranth A12 can be considered as an accession tolerant to salinity (Tanji & Kielen Reference Tanji and Kielen2002 ). On the other hand, if the irrigation level of 0·25 of FC was considered, the Maas & Hoffman model changed (Fig. 4). In fact the slope was 6·25 dS/m and ECe became equal to 8·76 dS/m at 50% yield reduction. So amaranth A12 must be considered moderately tolerant (Tanji & Kielen Reference Tanji and Kielen2002 ) to salinity when drought increases.
Maas and Hoffman model applied to treatments 100N and 100S. The electrical conductivity of soil saturated paste extract (ECe) values, reported on horizontal axis, represent mean weighted value, during the two growth cycles, of one replication of each treatment. The mean square deviation (MSD) between observed relative yield and calculated yield (Yc) is indicated.

Maas and Hoffman model applied to treatments 25N and 25S. The electrical conductivity of soil saturated paste extract (ECe) values, reported on horizontal axis, represent mean weighted value, during the two growth cycles, of one replication of each treatment. The mean square deviation (MSD) between observed relative yield and calculated yield (Yc) is indicated.

In both years, treatments 50N and 50S presented a HI higher than the control treatment 100N; this is due to greater vegetative growth of the full irrigation treatment in comandson with the two stressed treatments (Table 8). In the current study, WP increased with drought stress until irrigation volumes of 0·50 of FC were reached in both years (Table 8). Generally there was a reduction of WP values for treatments 25N and 25S with respect to 50N and 50S. No differences were observed between homologous irrigation treatments for saline and not saline.
Chemical composition of seeds
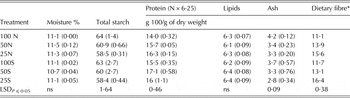
The chemical analysis of amaranth seeds showed that starch is the main component (c. 60%) of amaranth seeds, as in common cereals. Starch content decreased significantly (P ⩽ 0·05) with drought but did not change with saline stress (Table 9): in fact there were no differences between the homologous saline treatments.
Chemical composition of amaranth seed. The numbers in brackets represents the s.e. of three samples analyzed for each treatment. Least significant difference value for P ⩽ 0·05, referred at the mean of three replications for each treatment, is also reported

N, Non-saline treatment irrigated with fresh water; S, treatment irrigated with saline water at known salt concentrations; ns, not significant.
* Calculated by difference.
The protein content increased significantly (P ⩽ 0·05) with saline stress and drought. No difference was observed between 25N and 25S.
A12 seeds contain high lipid levels (6·3% on average), according to Borneo & Aguirre (Reference Borneo and Aguirre2008). This high fat content makes amaranth an interesting source of bioactive compounds. Borneo & Aguirre (Reference Borneo and Aguirre2008) observed that c. 8% of the entire fat content was squalene, a compound which has been credited with important nutraceutical properties. The ash content ranged from 2·84 to 4·24%. In general it was noted that ash content decreased significantly (P ⩽ 0·05) with the decrease of irrigation volumes from 1·00 to 0·25 of FC and was significantly (P ⩽ 0·05) higher in non-saline treatments than in the homologous saline ones.
It is interesting to observe the high dietary fibre content in all of the samples examined, with average levels of 13·6%. The fibre content increases with drought stress, from 11·1 and 11·7%, respectively, for 100N and 100S, to 15·6 and 16·4% for 25N and 25S, respectively.
DISCUSSION
Soil moisture and water balance
Since high salt concentrations decrease the osmotic potential of soil solution (Lefèvre et al. Reference Lefèvre, Gratia and Lutts2001; Munns Reference Munns2002), no difference in soil water balance and no reduction in water adsorption by amaranth was observed whether fresh or saline water was used. If excessive amounts of salt are taken up by the plant they will eventually rise to toxic levels in the older transpiring leaves, causing premature senescence. The total water consumption computed from the soil water balance for the 100N treatment in the irrigation seasons of the 2 years was lower than the 450–650 mm per season calculated for cereals such as oats, barley and wheat (Brouwer & Heibloem Reference Brouwer and Heibloem1986). The different climatic conditions of the 2 years led to different evaporative demands and calculated kc during the irrigation period (Qi et al. Reference Qi, Li and Gong2002). In consequence, it is important to take temporal crop coefficient into account for irrigation planning on different pedo-climatic conditions especially, to achieve optimum water use efficiency.
Soil electrical conductivity
The surface layer was more subject to percolation of salts caused by the autumn and spring rains, whereas the underlying layer presented more constant behaviour over time, with a tendency towards a gradual increase in ECe values which was not sufficient to explain the fate of all the salts washed out of the upper layer.
Yield, water productivity and salt tolerance
The statistical responses, observed for yield, 1000 seed weight, HI and WP under the combination of stresses, showed that plant response to the individual stress cannot be extrapolated and evaluated separately. Plant responses to drought and salinity occur via a series of physiological, cellular and molecular events developing in parallel and very rapidly, because these events mobilize the whole metabolic machinery towards plant acclimation and survival (Chaves et al. Reference Chaves, Flexas and Pinheiro2009).
Irrigation with saline water did not cause different water consumption compared with non-saline treatments. Because the adaption of plants to saline soils involves regulation of salt uptake, it separates species and genotypes that differ in the ability to tolerate soil salinity. Tolerance mechanisms include the compartmentalization of salts in different plant tissues to delay, as long as possible, the time when it accumulates to toxic levels in leaves that are actively photosynthesizing (Munns Reference Munns2002; Jacobsen et al. Reference Jacobsen, Jensen and Liu2012).
The tolerance of amaranth to salinity was confirmed by Quispe & Jacobsen (Reference Quispe, Jacobsen, Jacobsen and Valdez1999) who found that amaranth cvar Oscar Blanco, cultivated under different saline conditions, gave the highest yield if irrigated with water with an ECe of 5 dS/m, and the degree of tolerance to salinity can increase when drought decreases. Appling the Maas & Hoffman model both to the well-irrigated treatments and to those with maximum drought indicates that interaction between drought and salinity reduces tolerance to ECe.
The higher yield of treatment 100N and of the two 50N and 50S treatments was related to greater development of the inflorescences and therefore to the larger number of seeds per panicle (data not reported), but not to the average weight of the seeds. In general, less irrigation water and more salt reduced growth, perhaps as an acclimation response to control the dissipation of energy, so that the plant may have enough water available for survival.
Chemical composition of seeds
The protein content ranged from 14 to 17% of DW (Table 9) in line with data reported by Džunková et al. (Reference Džunková, Janovská, Čepková, Prohasková and Kolář2011) who analysed seeds from 59 genotypes of grain amaranth and found an average protein content of 16·43% of DW. The protein content of amaranth seeds was thus higher than maize (10·2%), rice (7·6%) and wheat (14·2%) (Galwey Reference Galwey1992; Ogungbenle Reference Ogungbenle2003; Comai et al. Reference Comai, Bertazzo, Bailoni, Zancato, Costa and Allegri2007) compared with quinoa (15·9%) (Repo-Carrasco et al. Reference Repo-Carrasco, Espinoza and Jacobsen2003; Pulvento et al. Reference Pulvento, Riccardi, Lavini, d'Andria, Iafelice and Marconi2010, Reference Pulvento, Riccardi, Lavini, Iafelice, Marconi and d'Andria2012; Gómez-Caravaca et al. Reference Gómez-Caravaca, Iafelice, Lavini, Pulvento, Caboni and Marconi2012; Stikic et al. Reference Stikic, Glamoclija, Demin, Vucelic-Radovic, Jovanovic, Milojkovic-Opsenica, Jacobsen and Milovanovic2012, Lavini et al. Reference Lavini, Pulvento, d'Andria, Riccardi, Choukr-Allah, Belhabib, Yazar, İncekaya, Metin Sezen, Qadir and Jacobsen2014, Riccardi et al. Reference Riccardi, Pulvento, Lavini, d'Andria and Jacobsen2014). The dietary fibre is strictly correlated to the presence of the peripheral layers of the seeds, where the fibres are normally concentrated, so drought stress determines a high thickness of pericarp for a given seed DW and greater fibre content.
CONCLUSIONS
The yield data recorded for the amaranth accession A12 under different irrigation strategies under South Italian pedo-climatic conditions were similar to those reported in the literature for South American cropping systems.
The results showed good tolerance of amaranth A12 to drought. Yields tended to be higher when the crop was irrigated with only 0·50 of the demand (ET0) than with full irrigation and this was even more pronounced when the water was highly saline (22 dS/m). The WP decreased when drought was more severe than 50% reduction of the volume given to the control. This behaviour indicates that A12 is an amaranth accession with a great capacity to maintain seed yield at low water quality and moderate drought.
The agronomic characteristics mentioned above, the absence of gluten together with a balanced composition of essential amino acids and 8% of the total fat content being squalene, highlight the great potential of this species for sustainable agriculture and food security even in view of future constraints imposed by climate change.
The authors are grateful to Angela Balsamo, Giovanni Romano and Davide Calandrelli for technical support to field trial. This research was part of the EU Sustainable Water Use Securing Food Production in Dry Areas of the Mediterranean Region (SWUP-MED) project.