


I. INTRODUCTION
The principle of using dielectric resonators for material characterization is well known since 1939 [Reference Richtmyer1]. In 1991, a ring-resonator-based multilayer material characterization setup was presented [Reference Bernard and Gautray2], which requires an additional dielectric and ground layer on top of the material under test (MUT), manufactured within a certain ε r -dependent thickness. Using empirical approximations, e.g. [Reference Yamashita and Mittra3], the ε r of the MUT could be calculated.
Nowadays, not only substrate materials have to be characterized within the microwave frequency range, but also other dielectric materials, used as covers and lenses for radar applications, or thin-film polymers, which are not designed for the attachment of conductive structures.
In this paper, a measurement method for
 ${\epsilon} ^{\prime}_r $
and
 ${\epsilon} ^{\prime \prime}_r $
is presented, which enables material characterization of dielectric MUTs of any thicknesses larger than several µm, starting from a few GHz up to 110 GHz, using a combined electromagnetic (EM) measurement and field simulation method of the transmitted power |S
21| and the resonance frequencies f
i
,
res
.
A variety of material characterization methods exists in literature, which can in general be subdivided into resonant narrowband and non-resonant broadband methods. A ring-resonator on a printed circuit board (PCB) represents an example for an accurate single-frequency characterization method with an approximate achievable accuracy for the relative permittivity of Δε r ± 0.01 using the fundamental. An extension to its harmonics allows material characterization for several discrete frequency points in the spectra, enabling a quasi-broadband characterization at comparatively simple frequency measurements and low calibration requirements. Broadband measurement systems such as antenna-based transmission–reflection methods [Reference Ghodgaonkar, Varadan and Varadan4] or coaxial time-domain transmission measurements [Reference Will, Gerding, Schulz, Baer, Musch and Rolfes5] provide frequency continuous material characterization of bulk substrates with the disadvantage of a lower accuracy Δε r ≫ 0.01 and higher requirements at the calibration and measurement setup for accurate phase measurements.
The proposed measurement system combines features of both measurement methods, allowing a cheap and fast quasi-broadband characterization of bulk substrates.
According to [Reference Niwat6, Reference Hopkins and Free7], a ring-resonator both transmits and radiates power at its resonance frequencies f i , res
 $$f_{i{\rm\comma }res}=\displaystyle{{i \cdot c_ 0 } \over {2\pi \cdot r \cdot \sqrt {{\epsilon }_{r{\rm\comma }eff} } }}\comma \; $$
depending on the ring radius r, the vacuum speed of light c 0, an integer multiple of the fundamental wave i ε [1, 2, 3, …] and the effective permittivity ε r , eff . In case of a quasi-transversal electromagnetic wave, ε r , eff depends on the geometry of the conductors and the material properties of the surrounding dielectrics, wherein EM waves propagate. The local ε r -values are weighted with the local electric fields E loc within the total electric flux Φ E [Reference Grant and Phillips8, Reference Sihvola and Kong9], through the closed surface S
 $$\Phi _E=\mathop{{\oint\!\int}}\limits_{\!\!S} {\lpar {\epsilon }_ 0 {\epsilon }_{r{\rm\comma }eff} {\bf E}\rpar d{\bf S}} .$$
II. EM SIMULATION
Since the proposed measurement setup is based on a comparision between simulated and measured resonance shifts, the simulative backgrounds and methods for the S-parameter determination are presented. All EM simulations were performed by computer simulation technology (CST) Microwave Studio [10]. Due to the high-quality factors Q of ring-resonators, the Frequency Domain Solver is a suitable choice in order to obtain resource-efficient convergence of the simulation.
According to [10], the S-parameter error ΔS is determined as the maximal deviation of the absolute value of the complex difference of the S-parameters between two subsequent passes. The convergence criteria has to be fulfilled for each frequency point of the simulation, which is achieved by an adaptive mesh refinement until ΔS drops below the set value.
The model of the ring-resonator and the MUT is meshed by tetrahedral cells, depicted in Fig. 1(a). The mesh refinement is field energy based and therefore located near the conductor region. An example for the refinement process for one frequency point at 77 GHz is shown in Fig. 1(b). The number of tetrahedral meshcells is increased for each refinement pass, correlating to simulation time and memory requirements. Sufficiently accurate simulations up to 110 GHz by this technique require a main memory of approximately 96 GB. The adaptive refinement is aborted, when ΔS is below the predefined value at two consecutive iterations, which is ΔS = 0.005 at this case. Since the number of simulated frequency points by the F-Solver scales with simulation time, the total bandwidth of an accurate simulation should be narrow. A less accurate broadband simulation can be performed before the accurate simulation in order to get the approximate region of the respective resonance frequency.
S-parameter convergence by field energy-based mesh refinement. (a) Tetrahedral refined mesh, (b) convergence over mesh refinement.

Since f i , res of the resonator strongly depends on its geometrical dimensions, accurate geometry measurements have to be performed. This is achieved by a digital microscope, providing a three-dimensional (3D) measurement accuracy of 1 µm. Especially the trapezoidal shape of photochemically etched conductors has a considerable influence on the resonance frequency, which is investigated by Talai et al. [Reference Talai, Steinhäußer, Bittner, Schmid, Weigel and Koelpin11].
When the resonator as well as the MUT is modeled according to the measured dimensions, parameter-sweeps of ε
r
and tan δ of the MUT are carried out within suitable ranges for the present material. Hereby, a separate parameter-sweep has to be performed for each resonance frequency. A comparision between measured and simulated resonances allow assignments of
 $\underline {\epsilon } $
.
III. MEASUREMENT PRINCIPLE
When placing a MUT on top of a ring-resonator, ε r , eff rises by a factor of Δε r , eff and all resonances are shifted by Δf res to lower frequencies f i , res ,MUT, explained by
 $$f_{{i}\comma res{\rm\comma MUT}}=f_{i{\rm\comma }res} - \Delta f_{res}=\displaystyle{{i \cdot c_ 0 } \over {2\pi \cdot r \cdot \sqrt {{\epsilon }_{r{\rm\comma }eff}+\Delta {\epsilon }_{r{\rm\comma }eff} } }}.$$
ε r of the MUT can be determined by a combined analysis of measurement and simulation, which is exemplary depicted in Fig. 2(a). The ε r of the MUT is swept within the simulation, which allows the assignment of the actual ε r to the MUT. The dielectric loss of the MUT is not considered in this simulated ε r -sweep. The calibration plane of the measured curve is at the coaxial cable ends before the 1 mm connectors. Subsequently, the amplitudes of the measurements are about 9 dB lower than simulated, mainly depending on the impedance mismatch of the transitions from coaxial to grounded coplanar and to microstrip. In addition, dielectric loss, metallization loss, and connector loss decrease the measured amplitudes. The MUT is modeled according to Fig. 2(b) on top of the conductors.
Measurement principle by combined analysis of f i , res . (a) Assignment of f i , res − ε r , (b) simulation model with MUT.

The metallization thickness of the ring introduces an additional air gap between the reference substrate and the MUT. This gap comprises high-electric field strengths and therefore increases the resonance frequencies, which results in both too low determined Δfres and permittivity of the MUT. For this reason, the resonator was measured in three dimensions with an accuracy of ±1 µm by a digital microscope.
Figure 3(a) shows a photograph of the reference ring with the outer radius r = 3007 µm. The magnified view in Fig. 3(b) shows that the photochemically etched conductors are trapezoidal, which is considered in the computer-aided design (CAD) model for the subsequent EM-field simulation, illustrated in Fig. 3(c). The whole reference resonator structure is depicted in Fig. 3(d), including the used 1 mm coaxial PCB launchers [12] and the |S 21| broadband-optimized transitions from grounded coplanar waveguide (GCPW) to microstrip line (MSL).
Reference resonator PCB on 127 µm Rogers3003. (a) Resonator, (b) conductor shape, (c) conductor model, (d) picture of resonator with 1 mm connectors and broadband tapers.

A second air gap occurs between the top surface of the MSL and the bottom surface of the MUT. Mostly this micrometer-sized air gap can occur due to different cases, which are:
-
(1) The reference resonator board can be arched.
-
(2) The MSL on the reference resonator can have different heights due to uneven photochemical etching.
-
(3) The MUT bottom surface can be curved or irregularly high due to a non-smooth surface.
-
(4) The edges of the MSL can be lowered with respect to the center of the MSL, leading to a curved MSL surface.
A general countermeasure to these causes is provided by the clamping system, which reduces these gaps due to vertical pressure. There are additional measures that can be taken to reduce the effects of the different points. Cases 1 and 2 can be investigated by comparing measurement results with different reference resonator boards, whereas case 1 can be improved either by using a vacuum intake device on the underside of the PCB or by applying suitably distributed pressure on its top. Since case 3 is based by the MUT, the bottom surface of the MUT can be polished or ground to increase its smoothness and different MUT samples of the same material and dimensions can be compared, leading to an averaged result with respect to the MUT surfaces. Case 4 strongly depends on the hardness of the MUT, since a soft MUT would adjust its bottom surface to the conductor as a result of the vertical pressure, while a rigid material leaves this gap. Therefore, comparative materials of similar hardness can be used for a subsequent offset compensation, which is described in Section VII. Further investigations regarding air gap issues on material characterization are shown in [Reference Weil, Jones, Kantor and Grosvenor13–Reference Fehlen15].
The minimum area of a MUT, comprising plane bottom and top surfaces, has to be approximately 1 cm2, to cover the resonator plus the adjacent fringing fields. Figure 4 shows the simulated saturation effect with different MUT thicknesses and permittivities on a ring-resonator with f 0 = 10.6 GHz and a reference substrate with ε r = 3. The resonance frequency f i , res ,MUT saturates between 1 mm < d < 2 mm, depending on ε r of the MUT. Therefore, the thickness of the MUT has to be homogeneous and must be measured, if it is thinner than about d = 2 mm.
Simulated saturation effect of f i , res ,MUT over MUT thickness d and ε r .

IV. MEASUREMENT SETUP
Figure 5(a) shows a cross-sectional sketch of the used test setup on a PCB. The ring-resonator is on top of 127 µm thick Rogers RO3003, which is mechanically stabilized by FR-4 layers. The angled 1 mm connectors correspond to the calibration plane. The MUT is pressed with a reproducible contact pressure on top of the completely covered ring-resonator by a dry wooden clip, depicted in Fig. 5(b), providing neglectable influence on the measured MUTs in terms of high-frequency material properties of the clip itself.
Measurement setup and reproducible mounting of MUTs. (a) Cross-sectional sketch of measurement setup, (b) mounting MUTs on the resonator.

S-parameter measurements from 1 to 110 GHz are performed by a 67 GHz vector network analyzer (VNA) of type Agilent PNA-X N5227A in combination with frequency extenders from 67 to 110 GHz. In order to obtain reliable measurement results, a calibration has been performed with a manual 1 mm Cal Kit at the 1 mm coaxial cable ends after the extenders, using a 13 standard Short-Open-Load-Thru calibration. The calibrated S-parameters of a 1 mm Thru between the cables are depicted in Fig. 6(a), showing a measured |S 21| > − 0.5 dB and a reflection |S 11| < − 18 dB.
Used MUT samples for measurements and calibrated S-parameters. (a) S-parameters of a Thru from 1 to 110 GHz, (b) used high-frequency MUT samples.

The used high-frequency MUTs are displayed in Fig. 6(b), covering an ε r -range from approximately 3–10. Their thicknesses are measured with an accuracy of ±1 µm and considered in the EM-field simulations. The created 3D CAD model is discretized by several 100 k tetrahedral meshcells, optimized by field energy controlled adaptive mesh refinement.
In general, it is also possible, to measure Δf res of thin foils of, e.g. 10 µm. However, the geometrical error of this applied thin-film MUT would be large since the foil cannot be approximated as a flat MUT. A solution to this drawback is provided by stacking a significant number of these foils until the total height reaches an appropriate value, which is illustrated in Fig. 5(b).
V. MEASUREMENT RESULTS
The reference substrate RO3003 was characterized by combined measurement and simulation of f i , res without a MUT. The |S 21| measurement results and determined ε r -values for RO3003 are depicted in Fig. 7, with an estimated absolute accuracy of Δε r = 0.05, starting with the fundamental wave at 10.71 GHz up to the ninth harmonic at 105.13 GHz.
|S 21| and ε r measurement results of the reference resonator.

Taking into account the measured ε r of the reference substrate, simulated ε r -sweeps with each MUT were performed for every measured f i , res ,MUT. Since the ε r (f) of RO3003 is now known, this substrate is additionally used as MUT to validate the functionality of the proposed measurement principle and to estimate the accuracy of the ε r -determination.
The measured resonance frequencies f i , res ,MUT are plotted in Fig. 8 over the absolute frequency shifts Δf res . Figure 8(a) shows an example for the measured Δf res for the first harmonic, sorted by increasing ε r . The transmission amplitude is increased by the MUT, due to stronger capacitive coupling between the MSL and the ring.
Measurement results of resonance frequency shifts Δf res by MUTs. (a) Example of Δf res , (b) Δf res due to Rogers and LTCC MUTs.

Both d and ε r of the MUT influence the measured frequency shift Δf res , which is plotted in Fig. 8(b). In the case of the RO3003 MUT, it is in a lower range between Δf res = 960 MHz for the fundamental wave at f 0, res = 9.75 GHz and Δf res = 8.51 GHz for the ninth harmonic at f 9, res = 96.62 GHz. The relationship between Δf res and the number of the harmonic i can be described by a nonlinear function f NL , because the vertical air gap of the electrical length h gap , introduced by the conductors, is increasingly influential with rising frequency. The underlying ε r -mixing rule for each material k on ε r , eff is nonlinear as well [Reference Kärkkäinen, Sihvola and Nikoskinen16], which must therefore be simulated for every point j in space, expressed in general by
 $${\epsilon }_{r{\rm\comma }eff}=f_{NL} \left({\sum\limits_{k=1}^m \sum\limits_{j=1}^n {\epsilon }_{r{\rm\comma }k{\rm\comma }j} \lpar f\rpar \displaystyle{{{\bf E}_{loc{\rm\comma }j} } \over {{\bf E}_{tot} }}\comma \; h_{gap} \lpar f\rpar } \right).$$
The measured frequency shift by the low-temperature cofired ceramic (LTCC) MUT is larger, because of their higher ε r , compared with RO3003. The LTCC DP951 evokes for example a frequency shift of Δf res = 1.49 GHz for the fundamental wave at f 0, res = 9.22 GHz and a shift of Δfres = 10.55 GHz for the seventh harmonic at f 7, res = 74 GHz.
It can be seen that the upper frequency limits for these measurements are confined to certain ε r values of the MUT. The measurement with the RO3010 MUT delivered only three evaluable |S 21| resonance frequencies, because of the large permittivity difference between the reference substrate and the MUT. Consequently, EM-fields are stronger attracted by MUTs with a comparatively higher ε r , leading to a radiation into free space. To overcome this drawback, a second reference substrate with an appropriate higher ε r can be used.
The measured results of ε r in Fig. 9(a) show the functionality of the presented measurement system by comparing the reference measurement results of RO3003 with the indirect measurement method when using RO3003 as a MUT. The evaluated ε r difference exhibits a deviation of ±Δε r ≤ 0.14 and displays a lower ε r value for all resonance frequencies. The reason for this is that the simulation assumes a flat transition plane between the conductor and the MUT, which is not the case due to the rounded metal surface.
Evaluated ε
r
for RO3003 MUT and normalized
 $\overline \sigma $
.

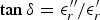
In contrast to the measurement of
 ${\epsilon} ^{\prime}_r $
, the loss tangent determination
 $\tan\,\! \delta={\epsilon }_r ^{\prime \prime} /{\epsilon} ^{\prime}_r $
by ring-resonators is challenging. This is due to the fact that various loss mechanisms affect the quality factor Q of the resonator by additional partial quality factors [Reference Kapoor, Daya and Tyagi17] related to conductor loss Q
c
, dielectric loss Q
d
, and radiation loss Q
r
. Q describes the stored energy divided by the sum of all losses for each resonant cycle, leading to
 $$\displaystyle{1 \over Q}=\displaystyle{1 \over {Q_ 0 }}+\displaystyle{1 \over {Q_d }}+\displaystyle{1 \over {Q_c }}+\displaystyle{1 \over {Q_r }}.$$
Q 0 is the quality factor of the unloaded resonator. Subsequently, a direct tan δ measurement by ring-resonators is difficult because the loss mechanisms cannot be separated easily. However, the proposed measurement setup permits an assignment of tan δ to lossy MUTs since the transmission amplitude |S 21| of the reference resonator can be compared with the transmission amplitude with the MUT.
The determined ε r values of the LTCC MUTs are displayed in Figs 10(a) and 10(b) for RO3010, respectively. They are in good agreement with the datasheet values, which are specified at lower frequencies about 2.5 GHz. The determined ε r -accuracy is expected to increase, when the ε r difference between the MUT and the reference substrate is small due to higher sensitivity regarding Δf. A second reference substrate with higher ε r provides a solution for the characterization of MUTs with comparable permittivities.
Simulated ε r results of LTCC MUTs and RO3010. (a) LTCC, (b) RO3010.

The used high-frequency MUTs comprise low dielectric loss within the measured microwave frequency range. Since the proposed measurement setup can only characterize tan δ for materials from moderate to high dielectric losses, no measured
 ${\epsilon} ^{\prime \prime}_r $
results are available for them, because the changes of the quality factors are more influenced by the repeatability of the MUT mounting than by dielectric loss. Furthermore, alle presented ε
r
results are magnitude values according to
 $${\epsilon }_r=\sqrt {\lpar {\epsilon }_r ^{\prime} \rpar ^2+\lpar {\epsilon }_r ^{\prime \prime} \rpar ^2} .$$
Since the used high-frequency MUTs have tanδ ≤ 0.05, the influences of the imaginary parts
 ${\epsilon} ^{\prime \prime}_r $
on the magnitudes are at the third digit of ε
r
and below.
In order to see the influence of lossy materials on |S 21|, measurement results of two injection-molded plastic materials of the types EP3164 and EP3151 with thicknesses d ≫ 2 mm are depicted in Fig. 11(a).
Measured and simulated influence of lossy MUTs on |S 21|. (a) Measurement of injection-molded materials, (b) influence of MUT tanδ on |S 21|.

It can be seen that at the first resonance close to 9 GHz both materials have low dielectric loss because of increased amplitudes compared with the reference and comparable ε r due to similar Δf. At subsequent resonances their tanδ increases significantly since the resonance amplitudes drop below |S 21| of the unloaded reference resonator. While |S 21| of EP3164 at the first harmonic near 18 GHz is approximately 3 dB lower than at its fundamental, the dielectric loss is in a region of tan δ EP3164;18 GHz ≥ 0.02. At the third harmonic near 34 GHz, |S 21| is additionally decreased by 12 dB, leading to tan δ EP3164;34 GHz ≥ 0.15, which reveals that this material is e.g. not suitable as a dielectric cover for K-band radar systems. Although a direct measurement of tan δ cannot be performed by this technique, an approximate quick assignment for lossy dielectrics can be made with an approximate accuracy of ±20%, dealing as a general overview on material loss at discrete frequency points. Since consecutive measurements can be performed within a few minutes, both different unknown material probes can be compared in a time efficient manner and mounting based deviations can be averaged out by repeated measurements with a newly mounted MUT.
Figure 11(b) shows the simulated influence of tanδ by a MUT of infinite thickness d and
 ${\epsilon} ^{\prime}_r=3$
at the seventh harmonic at 77.6 GHz on a 30 µm high-conductor. It can be seen that a very low tanδ in the range of 0.001 to 0.01 cannot be assigned accurately, since |S
21| is only shifted within a few dB which is below the repeatability of the mounting system, but tan δ ≥ 0.01 can be assigned due to larger amplitude shifts. Consequently, this measurement setup can provide a very quick insight up to which frequency a dielectric material is suitable for radar applications.
VI. INFLUENCE OF METALLIZATION HEIGHT
The metallization height h of the reference resonator PCB is of major influence on the accuracy for the proposed measurement setup and has therefore to be considered in the EM simulations. In order to get an idea about the introduced frequency shift Δf i , gap by the vertical air gap, simulations of different conductor heights from 0 to 50 µm were performed, using a RO3003 MUT of quasi-infinite thickness. Figure 12(a) shows the resonance frequencies for different h, starting from the fundamental at approximately 10 GHz up to the 10th harmonic at about 110 GHz. It can be seen that the air gap gets more influential with increasing frequency, since the gap becomes comparatively electrically longer.
Influence of metallization height h on resonance frequencies and transmitted power. (a) Resonance frequency, (b) resonance frequency shift, (c) transmitted power.

The simulated frequency shifts Δf i , gap are displayed in Fig. 12(b), which are positive and therefore inverse to the frequency shifts Δf i , res , MUT by the MUTs. A comparison with the measured resonance frequency shift Δf res of the RO3003 MUT in Fig. 8(b) leads to the conclusion that a 50 µm high-conductor induces approximately a 50% inverse frequency shift at the fundamental (10 GHz) rising to an approximately 60% inverse shift at the ninth harmonic (97 GHz), reducing the total frequency shift Δf res . Subsequently, the assigned permittivity to the MUTs would be lower than it actually is when the metallization height is neglected.
Figure 12(c) shows the influence of h on the transmitted power |S 21| of the whole resonator setup, including a RO3003 MUT for the first four resonance frequencies. ΔP increases with increasing h, because the dielectric loss is reduced and the effective wavelength λ eff is increased by the air gap, which also reduces metallization loss due to the electrically shorter conductors. Therefore, the influence of h on ΔP strongly affects the tan δ approximation as well and has to be considered for the evaluation.
VII. ERROR ANALYSIS, COMPENSATION, AND TIME REQUIREMENTS
A) Repeatability and standard deviation
To verify the repeatability of this ε
r
determination method, 40 consecutive measurements with newly mounted MUTs were carried out and plotted in Fig. 9. The standard deviation σ of the measured resonance frequencies with the RO3003 MUT was calculated for each harmonic, and normalized to the average of the measured frequency of each harmonic, resulting in an average value of
 $\bar \sigma \approx 0.00256$
.
The relationship between the relative permittivity of the MUT and the normalized standard deviation
 $\overline \sigma $
of the measured resonance frequencies is depicted in Fig. 13(a). The data were gained by evaluation of n = 100 repeated measurements with the listed MUTs, and calculated by
 $$\overline \sigma=\sqrt {\displaystyle{1 \over n}\sum\limits_{i=1}^n \lpar {f_{i{\rm\comma }res} - \overline {f_{i{\rm\comma }res} } } \rpar ^2 } \cdot \displaystyle{1 \over {\overline {f_{i{\rm\comma }res} } }}.$$
Derived normalized and averaged standard deviations over ε
r
of the MUTs and percentage of maximum frequency deviations Δf
res
,MAX (%) from
 $\overline {f_{i\comma res} } $
. (a) Standard deviations
 $\overline \sigma $
over ε
r
of the MUTs, (b) maximum deviations from
 $\overline {f_{i{\rm\comma }res} } $
, (c) maximum deviations from
 $\overline {f_{i{\rm\comma }res} } $
.

Thereby,
 $\overline {f_{i{\rm\comma }res} } $
is the measured average resonance frequency for each harmonic and each MUT. The ripple at the ε
r
range of the LTCC MUT is both caused by the limited number of repeated measurements and their different thicknesses d, which is below the saturation thickness after Fig. 4. The graphic shows a positive slope with increasing ε
r
of the MUT. This depends on the growing frequency shift with rising ε
r
.
The averaged data of
 $\overline \sigma $
is represented by the polynomial fit function
 $$\overline \sigma=0.00002{\epsilon }_r^3 - 0.0004{\epsilon }_r^2+0.0024{\epsilon }_r - 0.0021\comma \; $$
starting from
 $\overline \sigma=0$
in the case ε
r
,MUT = 1. The effect of
 $\overline \sigma $
on the ε
r
determination is listed in Table 1.
Relationship of
 $\overline \sigma $
to Δε
r
of the MUTs.

The quotient
 $\Delta {\epsilon }_r /\overline \sigma $
describes the simulated error in the ε
r
determination, introduced by a relative frequency shift of 1σ by the corresponding MUT. It can be seen that the absolute error in the ε
r
determination increases on average with the higher values of ε
r
,
MUT, which is
 $\Delta {\epsilon }_r /\overline \sigma=0.076$
in the case of the MUT RO3003 and
 $\Delta {\epsilon }_r /\overline \sigma=0.33$
for RO3010. The measurement time for this proposed measurement method is mainly limited by the VNA sweep and averaging time. Therefore, the recording of several subsequent measurements will lead to an accuracy, which satisfies RF circuit design requirements.
The relative deviations of the measured resonance frequencies are plotted in Figs 13(b) and 13(c), respectively. They show the largest positive and negative measured frequency deviations from
 $\overline {f_{i\comma res} } $
at ten consecutive measurements for each f
res
of the MUTs. The smallest frequency deviations shows the RO3003 MUT, which is in the range of Δf
res
,MAX ≤ ± 0.45%. This is due to the fact that the smaller ε
r
of the RO3003 MUT leads to the lowest total Δf
res
among all used MUTs. All LTCC MUTs inhabit larger deviations at consecutive measurements because of their higher ε
r
and their larger hardness compared with RO3003, leading to more influential airgaps between the metal surfaces and the LTCC MUTs. The largest measured frequency deviation occurs at the CT708 MUT, which is approximately −2.8% ≤ Δf
res
,MAX ≤ + 1.6%. These comparatively large values lead to the conclusion that the CT708 has a production-related directional dependence of ε
r
. Since all MUTs were turned by 90° for each subsequent measurement, the different direction dependent ε
r
values increase the maximum deviations for the measured frequency shifts.
B) Offset compensation techniques
The introduced vertical air gap between the MUT and the reference resonator is caused by the metallization height h and deviations from a flat MUT and resonator surface. Therefore, both Δf res and the corresponding ε r and tan δ measurements result in too low determined values. There are two possible solutions to compensate this offset error:
-
• A comparative measurement with one or more already characterized MUTs can be used to compensate the offset error. Hereby, it has to be considered that the MUT thicknesses have to be comparable in order to achieve a precise compensation.
-
• The values of ε r and tan δ of the MUT are known at the fundamental resonance frequency, for example, according to datasheet values. Hereby, a significant proportion of the offset can also be compensated for the higher order harmonics. An example for this technique can easily be applied to the RO3003 MUT, since datasheet values are available up to 50 GHz.
C) Required effort for material characterization
An important aspect for a material characterization system is the required effort which must be accommodated to characterize a material. Table 2 provides an overview on the approximate characterization time under the assumption of an already existing characterized reference resonator PCB.
Approximate required time for material characterization.

The table indicates that an ε r characterization as well as a tanδ characterization with ten harmonics requires approximately one day each, mainly depending on the simulation time. When a look-up table is prepared for a comparable MUT thickness, EM simulations are not required and the complex permittivity values can directly be assigned by a MATLAB function, when the measured S-parameters are read in, leading to a shorter characterization time of approximately 1 h. Additionally, this measurement technique allows very quick comparative measurements of material samples with similar thicknesses, because the frequency shift differences Δf res between the MUTs can be measured within a few minutes.
VIII. CONCLUSIONS
In this paper, a complex permittivity characterization method for dielectric bulk materials at frequencies from a few GHz up to 110 GHz was presented. The MUT detunes a characterized ring-resonator on a known substrate. This frequency shift is measured by a vector network analyzer and compared with an EM-field simulation, which enables the assignment of an ε r -value to the MUT.
A comparative measurement of an already characterized Rogers RO3003 MUT delivered a measured accuracy of Δε r = ±0.14, which demonstrated the functionality of the proposed measurement setup.
The presented material characterization system provides an approximate accuracy of 5% for the ε r determination, which can be increased by appropriate offset compensation techniques. The design of mm-wave antennas or other narrowband high-frequency circuits often require higher ε r accuracies, which must be determined by more elaborate and more expensive methods of measurement. Although this technique cannot reach the accuracy of a direct ring-resonator measurement, which provides an approximate ε r accuracy of 0.5%, this technique gives a very cheap and fast insight on the permittivity behavior of a bulk dielectric.
It was shown that dielectric loss can be approximated with a tolerance of ±20% in case of medium to high losses. Since the market comprises a large amount of non-characterized dielectrics in the mm-wave region like injection-molded materials, the presented system can deal as a quick and cheap pre-selection for frequency-dependent suitability of dielectrics.
The metallization height of the conductors cause an offset error for the complex permittivity determination, which can be compensated by two presented methods.
A major advantage of the proposed system is the usable diversity of material probe dimensions, since it can characterize materials of different thicknesses, ranging from thin films of a few micrometers up to thicknesses of several centimeters. In addition, it permits accurate comparisons among MUTs of the same thickness within several minutes. The bending radii and positions of the 1 mm coaxial cables and connectors remain unchanged as well as calibrated at consecutive measurements.
Furthermore, look-up tables for certain material thicknesses of the MUT can be customized for the reference resonator PCB, which allow immediate assignments of ε r to MUTs without field simulations.
Supplementary reference substrates of higher ε r will increase the measurement sensitivity for MUTs within similar ε r scales.
However, the introduced vertical air gap by the conductor will most likely vary due to waviness. Further investigations will reduce this drawback using thin film metallizations.
ACKNOWLEDGEMENTS
This work has been funded by the Bavarian Ministry of Economic Affairs, Infrastructure, Transport and Technology (StMWIVT) and by the Austrian Research Promotion Agency (FFG) under project Porofreq.
 Armin Talai was born in 1985 in Fürth, Germany. He received his diploma in Electrical Engineering from the Friedrich-Alexander-University Erlangen-Nuremberg in 2011. Since then he has been working as a research assistant at the Institute for Electronics Engineering in Erlangen. His main research interests are high-frequency material characterization and local modification of permittivity on LTCC substrates.
 Frank Steinhäußer was born in 1987 in Chemnitz, Germany. He studied microtechnology/mechatronics at the Chemnitz University of Technology in October 2006. After a stay of half a year in winter 2009–2010 at XaarJet AB in Stockholm, Sweden, he graduated with a German diploma related to the electro chemical characterization of carbon nanotube membranes for fuel cells in November 2011. Currently, he is working on his Ph.D. thesis at the Vienna University of Technology on the porosification of LTCC substrates.
 Achim Bittner was born in 1980 in Lichtenfels, Germany. He started his studies in Material Science in 2000. He performed his diploma thesis 2005 at Robert Bosch GmbH in Bamberg where he worked on the improvement of thick film technology. After that he started as development engineer at MSE in Berg with the focus on LTCC substrates. In 2006, he started his Ph.D. thesis at Saarland University, Chair of Microsystems Technologies with the topic local reduction of permittivity of LTCC substrates. Since 2010 he is Postdoctoral at Vienna University of Technology, Institute of Sensor and Actuator Systems.
 Ulrich Schmid was born in Munich, Germany, in 1972. He started studying physics and mathematics at the University of Kassel in 1992. He performed his diploma work at the research laboratories of the Daimler-Benz AG on the electrical characterization of silicon carbide (6H-SiC) microelectronic devices for high-temperature applications. In 1999, he joined the research laboratories of DaimlerChrysler AG (now EADS Deutschland GmbH) in Ottobrunn/Munich, Germany. He received his Ph.D. degree in 2003 from the Technische Universität Munich, Germany. From 2003 to 2008, he was postdoctoral at the Chair of Micromechanics, Microfluidics/Microactuators at Saarland University. Since October 2008, he is full professor for Microsystems Technology at the Vienna University of Technology heading since the beginning of 2012 the Institute of Sensor and Actuator Systems. U. Schmid holds 22 patents and has authored or co-authored more than 200 publications in refereed journals and conferences.
 Robert Weigel was born in Ebermannstadt, Germany, in 1956. He received the Dr.-Ing. and Dr.-Ing.habil. degrees in Electrical Engineering and Computer Science from the Munich University of Technology, Munich, Germany, in 1989 and 1992, respectively. From 1982 to 1988, he was a Research Engineer; from 1988 to 1994, a Senior Research Engineer; and from 1994 to 1996, a Professor of RF circuits and systems with the Munich University of Technology. In winter 1994–1995, he was a Guest Professor of SAW technology with the Vienna University of Technology, Vienna, Austria. From 1996 to 2002, he has been Director of the Institute for Communications and Information Engineering at the University of Linz, Austria. In 2000, he was appointed as a Professor for RF Engineering at the Tongji University in Shanghai, China. Since 2002 he has been the Head of the Institute for Electronics Engineering at the University of Erlangen-Nuremberg, Germany.
 Alexander Koelpin received his diploma in Electrical Engineering in 2005 and his doctoral degree in 2010 both with the University of Erlangen-Nuremberg, Germany. Currently he is working toward his venia legendi. Since 2005 he as been with the Institute for Electronics Engineering, Friedrich-Alexander University of Erlangen-Nuremberg, Germany. In 2007 he worked as a team leader, and in 2010 he became the group leader in Circuits, Systems and Hardware Test. His research interests are in the areas of microwave circuits and systems, wireless communication systems, local positioning, and six-port technology. He has authored or co-authored over 100 publications in his areas of interest. Furthermore, he serves as a reviewer for several journals and conferences. He is a member of the IEEE MTT-S technical committee MTT-16, and since 2012 as Co-Chair of the IEEE Topical Conference on Wireless Sensors and Sensor Networks.



