Background
Prevalence of self-rated subjective loneliness in later life
In a recently published article investigating loneliness and the risk of mortality, the authors state that ‘the claim that loneliness is widespread in contemporary America should not come as a surprise’ (Patterson and Veenstra Reference Patterson and Veenstra2010: 181). In the United Kingdom (UK), both the tabloid and broadsheet press have reported ‘a loneliness epidemic’ (Khaleeli Reference Khaleeli2013; Murray Reference Murray2013) on the basis of figures from the Office for National Statistics that 25 per cent of those aged over 52 years report feeling lonely sometimes (Beaumont Reference Beaumont2013). Nevertheless, estimates of the prevalence of loneliness do vary – from 7 per cent in those aged 65 years and over (Victor et al. Reference Victor, Scambler, Bond and Bowling2000) to 43 per cent in those aged 60 years and over (Perissinotto, Cenzer and Covinsky Reference Perissinotto, Cenzer and Covinsky2012). With continued ageing of the population and since most studies find that older adults report higher levels of loneliness (Heylen Reference Heylen2010), it could be argued that the prevalence of loneliness can only increase (Beach and Bamford Reference Beach and Bamford2014).
The oldest old (commonly understood to be those aged 85 years and over) are the fastest growing age group in many countries worldwide (United Nations Department of Economic and Social Affairs 2009). Results from cross-sectional studies suggest that loneliness is a common experience in this age group (de Jong Gierveld Reference de Jong Gierveld1998; Pinquart and Sorensen Reference Pinquart and Sorensen2001) although prevalence at these ages is just as variable as in the younger old – from 16 per cent in those aged 80 years and over (Steptoe et al. Reference Steptoe, Shankar, Demakakos and Wardle2013) to 55 per cent of the oldest old living in institutional care and 45 per cent of the oldest old living in the community (Nyqvist et al. Reference Nyqvist, Forsman, Giuntoli and Cattan2013). Although there is an increased interest in establishing the extent to which older people feel lonely in society today (Routasalo and Pitkälä Reference Routasalo and Pitkälä2003), particularly with a policy focus on alleviating it, defining and measuring loneliness is a methodological challenge for gerontological research and practice (Savikko et al. Reference Savikko, Routasalo, Tilvis, Strandberg and Pitkälä2005) as the variability in prevalence rates highlights.
The concept of loneliness is complex because its experience in later life is shaped by multiple social factors within which our lives are played out, including social relationships, not just family and kinship groups, but wider social networks of friends and neighbours (Bowling Reference Bowling1995). Studies have consistently identified living alone as a risk factor for loneliness in later life, though other living arrangements are less often examined (Greenfield and Russell Reference Greenfield and Russell2011), and more recently lack of social support has been found to play a role (Stephens et al. Reference Stephens, Alpass, Towers and Stevenson2011). However, these findings are not universal and Wenger et al. (Reference Wenger, Davies, Shahtahmasebi and Scott1996) found that, although loneliness was more common amongst those living alone, there did not appear to be a causal connection and close relationships outside of the home could compensate for not having a spouse or resident children. Loneliness has been found to be more prevalent in older people living in institutional settings (Nyqvist et al. Reference Nyqvist, Forsman, Giuntoli and Cattan2013; Savikko et al. Reference Savikko, Routasalo, Tilvis, Strandberg and Pitkälä2005; Tsai and Tsai Reference Tsai and Tsai2011), although changes in residential care status (i.e. moving into residential care) do not appear to be linked to changes in loneliness (Dykstra, Van Tilburg and de Jong Gierveld Reference Dykstra, Van Tilburg and de Jong Gierveld2005).
Loneliness and its impact on health
The increased interest in loneliness is due in part to the detrimental impact it has on a person's health and wellbeing (Cacioppo and Hawkley Reference Cacioppo and Hawkley2009; Luanaigh and Lawlor Reference Luanaigh and Lawlor2008). Feeling lonely has been identified as a risk factor for a range of health problems including depression (Adams, Sanders and Auth Reference Adams, Sanders and Auth2004; Alpass and Neville Reference Alpass and Neville2003; Aylaz et al. Reference Aylaz, Aktürk, Erci, Öztürk and Aslan2012; Cacioppo et al. Reference Cacioppo, Hughes, Waite, Hawkley and Thisted2006; Luo et al. Reference Luo, Hawkley, Waite and Cacioppo2012; Nyqvist et al. Reference Nyqvist, Forsman, Giuntoli and Cattan2013; Stek et al. Reference Stek, Vinkers, Gussekloo, Beekman, van der Mast and Westendorp2005), cognitive decline (Cacioppo and Hawkley Reference Cacioppo and Hawkley2009; Shankar et al. Reference Shankar, Hamer, McMunn and Steptoe2013; Tilvis et al. Reference Tilvis, Kähönen-Väre, Jolkkonen, Valvanne, Pitkala and Strandberg2004; Wilson et al. Reference Wilson, Krueger, Arnold, Schneider, Kelly, Barnes and Bennett2007), Alzheimer's disease (Wilson et al. Reference Wilson, Krueger, Arnold, Schneider, Kelly, Barnes and Bennett2007) and mortality (Brummett et al. Reference Brummett, Barefoot, Siegler, Clapp-Channing, Lytle and Bosworth2001; Luo et al. Reference Luo, Hawkley, Waite and Cacioppo2012; Patterson and Veenstra Reference Patterson and Veenstra2010; Penninx et al. Reference Penninx, Van Tilburg, Kriegsman, Deeg, Boeke and Van Euk1997; Perissinotto; Cenzer and Covinsky Reference Perissinotto, Cenzer and Covinsky2012; Shiovitz-Ezra and Ayalon Reference Shiovitz-Ezra and Ayalon2010; Tilvis et al. Reference Tilvis, Laitala, Routasalo and Pitkälä2011, Reference Tilvis, Routasalo, Karppinen, Strandberg, Kautiainen and Pitkala2012). In addition, the absence of loneliness in older adults is a strong predictor for reporting good self-rated health three years later (Nummela, Seppänen and Uutela Reference Nummela, Seppänen and Uutela2011).
Gender differences in reporting loneliness
Studies have consistently shown that women report feeling lonely more often than men, for example 40 per cent of women aged 75 years and older reported feeling lonely compared with 29 per cent of men (Tilvis et al. Reference Tilvis, Routasalo, Karppinen, Strandberg, Kautiainen and Pitkala2012). This gender difference has in part been attributed to women's poorer health and greater disability in later life; figures for 2009–11 estimated that English women aged 65 spend an additional 2.0 years with disability compared to men (Office for National Statistics 2014). The impact of widowhood and recent bereavement is also a risk factor for loneliness in later life (de Jong-Gierveld and van Tilburg Reference de Jong-Gierveld and van Tilburg1987; Heikkinen and Kauppinen Reference Heikkinen and Kauppinen2011; Pinquart Reference Pinquart2003; Routasalo et al. Reference Routasalo, Savikko, Tilvis, Strandberg and Pitkälä2006; Savikko et al. Reference Savikko, Routasalo, Tilvis, Strandberg and Pitkälä2005), with death of a spouse or significant other reported as the most common cause of feeling lonely (Heikkinen and Kauppinen Reference Heikkinen and Kauppinen2011). Older women (aged 65 years and over) are three times more likely to be widowed (Hobbs and Damon Reference Hobbs and Damon1996) and four times more likely to live alone (Arber and Ginn Reference Arber and Ginn1994) than men of the same age. The combination of widowhood and living alone may account for women's greater prevalence of loneliness in later life (Arber and Ginn Reference Arber and Ginn1994), though living alone has also been found to be associated with greater loneliness among men than women (Greenfield and Russell Reference Greenfield and Russell2011).
Pinquart and Sorensen (Reference Pinquart and Sorensen2001) conclude that gender differences in subjective wellbeing are accounted for by disadvantages of older women in regard to health, everyday competence and socio-economic status. Nevertheless, gender differences in reporting loneliness may partly be due to artefact and the way in which loneliness is measured, thus again highlighting the challenges for gerontological research in capturing levels of loneliness in our society. Support for gender differences being due in part to artefact have been found when comparing direct and indirect questions on loneliness with greater gender differences in loneliness from direct questions, perhaps as a result of societal attitudes where women are more willing to ‘admit to socially unacceptable feelings than men’ (Pinquart and Sorensen Reference Pinquart and Sorensen2001: 258).
Loneliness over time
Cross-sectional studies may suffer from reverse causation and therefore longitudinal studies offer a more robust method of investigating risk factors for loneliness as well as identifying onset of and changes in loneliness. Victor et al. (Reference Victor, Scambler, Bowling and Bond2005) proposed three distinct pathways to loneliness: a continuation of a long-established attribute, late-onset loneliness and decreasing loneliness, and argued that it is important to capture these different experiences in order for interventions to be more tailored and successful in alleviating loneliness. Few longitudinal studies have looked at the experience of loneliness over time and they are unequivocal on whether or how loneliness changes over time. Three studies conclude that for the majority of older adults loneliness in later life is stable (Dykstra, Van Tilburg and de Jong Gierveld Reference Dykstra, Van Tilburg and de Jong Gierveld2005; Iecovich, Jacobs and Stessman Reference Iecovich, Jacobs and Stessman2011; Victor et al. Reference Victor, Scambler, Bowling and Bond2005), whilst one reports increased loneliness over time (Jylhä Reference Jylhä2004) and with only a minority of older people reporting feeling lonely continuously. Certain subgroups have been identified as at higher risk of increased loneliness, specifically those who were married and living only with their spouse (Jylhä Reference Jylhä2004) and those who became bereaved (Dykstra, Van Tilburg and de Jong Gierveld Reference Dykstra, Van Tilburg and de Jong Gierveld2005), although being in a new partnership did not appear to be accompanied by a significant decrease in loneliness (Dykstra, Van Tilburg and de Jong Gierveld Reference Dykstra, Van Tilburg and de Jong Gierveld2005).
Despite their numerical growth, those aged 85 years or more, the oldest old age group, are often under-represented in such studies of loneliness. From previous research we could surmise that this age group potentially would experience the highest levels of loneliness. Nevertheless, there are studies showing that advancing age appears to be protective against loneliness (Victor et al. Reference Victor, Scambler, Bowling and Bond2005), though this may be an artefact since response rates tend to be low in this age group. This paper aims to address these knowledge gaps by investigating loneliness in a single-year birth cohort who were aged 85 years at inception. Specifically, we explore the extent to which people aged 85 years are lonely and how loneliness changes between age 85 and 88, as well as the associated risk factors. Given previous findings of greater loneliness in women compared to men, we also explore gender differences in loneliness, providing more robust findings as, unlike other studies, the men and women of our cohort are the same age.
Methods
The Newcastle 85+ Study is a population-based longitudinal study of ageing and health in the oldest old. All participants were born in 1921 (aged 85 years in 2006 when the study commenced) and were registered with a participating general practice in Newcastle or North Tyneside NHS (National Health Service) Primary Care Trusts in North East England. Full details of the design of the study, recruitment and retention of participants have been reported (Collerton et al. Reference Collerton, Barrass, Bond, Eccles, Jagger, James and Kirkwood2007, Reference Collerton, Davies, Jagger, Kingston, Bond, Eccles and Kirkwood2009; Davies et al. Reference Davies, Collerton, Jagger, Bond, Barker, Edwards and Robinson2010, Reference Davies, Kingston, Robinson, Hughes, Hunt, Barker, Edwards, Collerton, Jagger and Kirkwood2014) but relevant details are given in Figure 1. The 1,040 people who took part in the study could do so at three levels: a multi-dimensional health assessment with review of general practice records (N = 849); review of general practice records only (N = 188); or multi-dimensional health assessment only (N = 3). The basis of the study population for our analysis was the multi-dimensional health assessment (N = 849). Written informed consent was obtained from participants and where people lacked capacity to consent (or during the assessment were found to be cognitively impaired), an opinion was sought from a relative or carer (a ‘consultee’) according to the requirements of the UK Mental Capacity Act. Trained research nurses assessed participants in their usual residence (own home or institution) and proxy informants were used where cognitive impairment was judged to limit the ability of participants to provide reliable answers. Further multi-dimensional health assessments were conducted at 18 months (Wave 2) and 36 months post-baseline (Wave 3). The study was approved by the Newcastle and North Tyneside Research Ethics Committee (reference 06/Q0905/2).
Recruitment and retention flow chart.

Measuring loneliness
As previously stated, the way in which loneliness is measured affects the level of loneliness reported and may explain much of the variation in the prevalence between studies. Generally there have been two approaches: firstly, with the development of scales specifically focusing on feeling lonely (e.g. the UCLA Loneliness Scale (Russell Reference Russell, Peplau and Perlman1982) and, secondly, the use of ‘simple’ self-report Likert scale questions which has mostly been used in British research (Victor et al. Reference Victor, Scambler, Bond and Bowling2002). For comparability with other national studies, we therefore measured loneliness using the ‘single-question self rating’ scale proposed by Victor, Scambler and Bond (Reference Victor, Scambler and Bond2009) which required participants to evaluate their current level of loneliness and to rate it as either being ‘always’, ‘often’, ‘sometimes’ or ‘never’ lonely. Participants were also asked to compare how they felt compared with ten years ago.
Socio-demographic and health data
Information collected included: ethnicity; level of education; living arrangements; marital status (including length of widowhood); self-rated health; cognitive status assessed by the Standardised Mini-Mental State Examination (SMMSE) (Molloy and Standish Reference Molloy and Standish1997) at baseline and Wave 3 only; limiting long-standing illness; self-reported ability to perform 17 Instrumental and Basic Activities of Daily Living ((I)ADLs) (Katz et al. Reference Katz, Ford, Moskowitz, Jackson and Jaffe1963; Lawton and Brody Reference Lawton and Brody1969); and depressive symptomatology by the 15-item Geriatric Depression Scale (GDS) (Sheikh and Yesavage Reference Sheikh, Yesavage and Brink1986). For each of the 17 (I)ADLS a score of one was given where participants reported difficulty or needing help with or being unable to perform the item and zero where no difficulty was reported; summing the scores for the 17 items generated a total disability score that was categorised as ‘no disability’, ‘difficulty with 1–6 items’, ‘difficulty with 7–12 items’ and ‘difficulty with 13–17’ items; this categorisation was supported by our previous work on the hierarchical structure of (I)ADL items (Kingston et al. Reference Kingston, Collerton, Davies, Bond, Robinson and Jagger2012) and trajectories of disability (Kingston et al. Reference Kingston, Davies, Collerton, Robinson, Duncan, Bond, Kirkwood and Jagger2015). To assess the current socio-economic status of participants we used the Index of Multiple Deprivation (Noble et al. Reference Noble, Wright, Dibben, Smith, McLennan, Anttila and Lloyd2007) and categorised this into below the 25th centile, 25th to 75th centile and above the 75th centile. Further details of the interview schedules used in the study are available at http://research.ncl.ac.uk/85plus.
Statistical methods
Ill-health scores (disability, SMMSE, GDS) were categorised using standard cut-points to account for potential non-linear relationships with loneliness. Cross-sectional analysis of the baseline data was carried out using chi-squared tests to assess gender differences in demographic variables and loneliness. Responses to the loneliness question were ordinal and this structure was retained but the ‘always’ and ‘often’ responses were collapsed, as frequencies were small. To test associations between putative risk factors and loneliness at baseline, we used ordinal logistic regression with a Brant Test carried out to ensure the proportionality assumption held. Similar cross-sectional analyses were repeated at Wave 2 and Wave 3. For the longitudinal analysis of patterns of loneliness, we utilised the methods of Victor and Bowling (Reference Victor and Bowling2012) and defined individual trajectories across the three waves into five groups as follows: ‘never lonely’, ‘always lonely’, ‘improving loneliness’, ‘worsening loneliness’ and ‘fluctuating loneliness’. We then explored gender differences in these loneliness pathways by logistic regression with the pathway of loneliness as the dependent variable and sex as the independent variable with odds ratios (OR) reported. The sample size for this analysis was limited to those participants who took part in all three waves and had complete data.
To determine potential predictors of loneliness we used multi-level modelling of repeated ordinal measures in order to exploit the longitudinal data fully and take account of those who contributed information at one, two or three waves. A two-level random intercept model was used (responses-within-participants) with three categories of loneliness (never lonely = 0, sometimes lonely = 1, always/often lonely = 2), the first category response being used as the reference. Initial models were fitted using second-order penalised quasi-likelihood estimation to gain an estimate of the model parameters and then refitted using Bayesian Markov Chain Monte Carlo estimation with 100,000 replications and uniform prior distributions (gamma distribution for variation in intercepts) to reduce bias in the initial estimates. Covariates used in this model were allowed to be time varying (updating according to the response at each wave) with the exception of SMMSE, where the baseline value was carried over to Wave 2 as SMMSE was not assessed at this time-point). A parsimonious model was built including variables based on the change in deviance (which has a chi-squared distribution) using a step-down approach of those variables found significant at baseline. For basic descriptive statistics we used Stata 12 (StataCorp. 2011) and MLwiN for Multilevel Modelling (Browne Reference Browne2009; Rasbash et al. Reference Rasbash, Charlton, Browne, Healy and Cameron2009).
Results
Sample selection and key characteristics
The study sample forming the basis for this analysis were those participants who agreed to the multi-dimensional health assessment at baseline and had complete data (N = 750/852). Of these, complete data was available at Wave 2 for 590 and at Wave 3 for 463 (a detailed breakdown of missing data is shown in Figure 1). We compared participants with (N = 102) and without missing data (N = 750) on key health measures at baseline and found no statistically significant differences. Of the 750 participants with complete data, 460 (61.3%) were women and 290 (38.7%) were men.
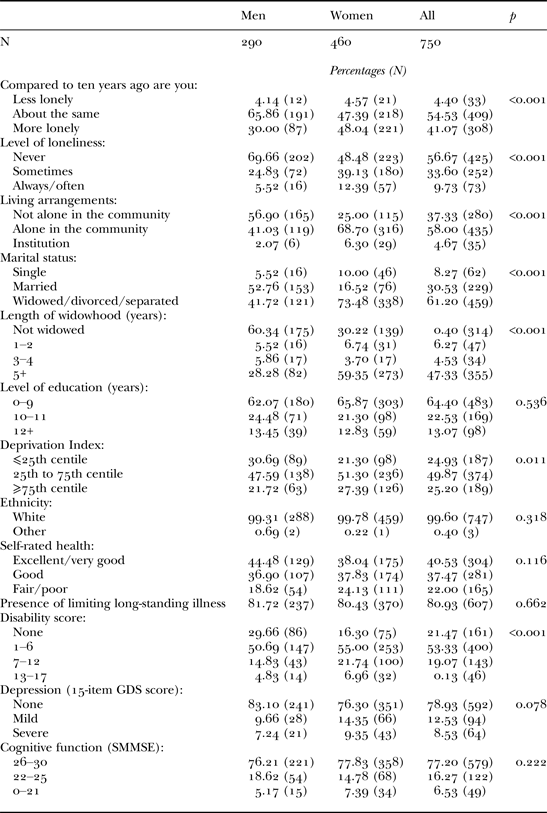
Compared to men, women were more likely to: live alone in the community, be institutionalised, be widowed and have greater disability (all p < 0.001) but were less likely to be in the lower spectrum of deprivation (below 25th percentile, p = 0.011) (Table 1). No significant gender differences were found in regard to ethnicity, level of education or the remaining health measures: presence of limiting long-standing illness, self-rated health, SMMSE and GDS (Table 1).
Sample population by gender

Notes: GDS: Geriatric Depression Scale. SMMSE: Standardised Mini-Mental State Examination.
Prevalence of loneliness at age 85
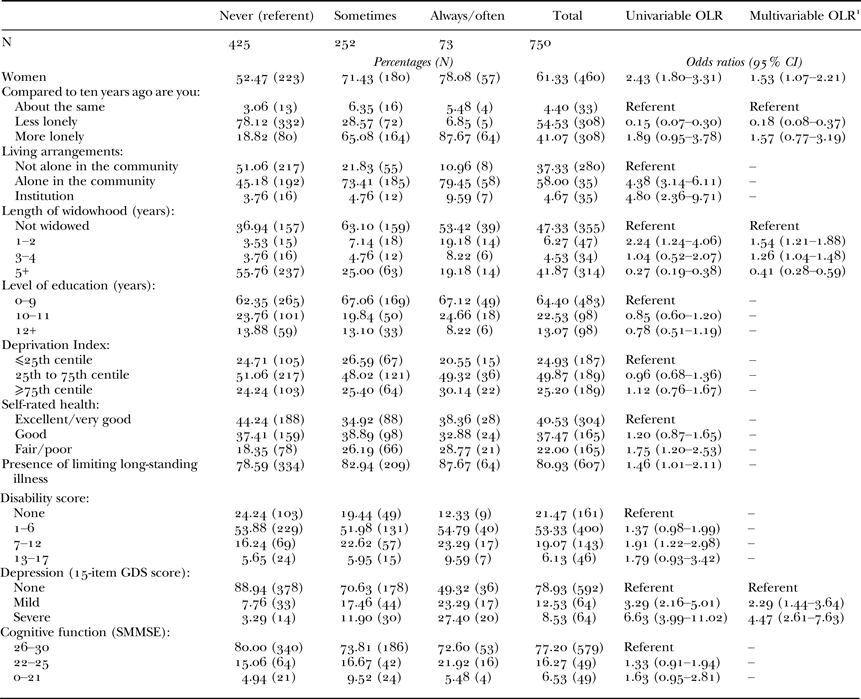
At baseline the majority of participants (57%) reported ‘never’ feeling lonely with only 9.7 per cent reporting being either ‘always’ or ‘often’ lonely (Table 1) and 2 per cent being ‘always’ lonely. Women more often reported feeling ‘always’ or ‘often’ lonely (12% in women compared with 6% in men) whilst more men reported ‘never’ feeling lonely (70% of men compared with 48% of women (Table 1). Thus women were over twice as likely to be lonely compared to men (OR = 2.43, 95% confidence interval (CI) = 1.80–3.31) and although this risk was attenuated when adjusted for all covariates, a 64 per cent increased risk of loneliness for women remained (OR = 1.53, 95% CI = 1.07–2.21) (Table 2).
Reported level of loneliness at baseline

Notes: 1. Statistically significant covariates presented only. OLR: ordinal logistic regression. CI: confidence interval. GDS: Geriatric Depression Scale. SMMSE: Standardised Mini-Mental State Examination.
When asked whether they felt more or less lonely than ten years ago, 41 per cent reported feeling lonelier and only 4 per cent reporting feeling less lonely. Indeed feeling less lonely than ten years ago was associated with a significantly reduced risk of loneliness at baseline (OR = 0.15, 95% CI = 0.07–0.30) (Table 2). There were also significant gender differences in loneliness now compared to the past, with a greater proportion of women than men reporting feeling more lonely than they did ten years earlier (48% of women compared with 30% of men, p < 0.001) (Table 1).
Cross-sectional associations of reported loneliness with socio-demographic and health factors
In univariable analyses, at baseline there was a four-fold higher risk of loneliness in those who lived in the community alone (OR = 4.38, 95% CI = 3.14–6.11) or who were institutionalised (OR = 4.80, 95% CI = 2.36–9.71, respectively) compared to those living in the community but not alone (Table 2). Length of widowhood was inversely associated with loneliness. Compared to those who were not widowed, the recently widowed (one to two years) had over twice the risk of loneliness (OR = 2.24, 95% CI = 1.24–4.06), whilst those who had been widowed for more than five years had a 73 per cent lower risk (OR = 0.27, 95% CI = 0.19–0.38). Neither measure of socio-economic status (education or deprivation) was significantly associated with loneliness.
Loneliness was positively and significantly associated with all health measures apart from cognitive function (Table 2). Compared to having no depressive symptoms, the risk of loneliness was three-fold higher in those with mild depression (OR = 3.29, 95% CI = 2.16–5.01) and over six-fold in those with severe depression (OR = 6.63, 95% CI = 3.99–11.02). Compared to having no disability, moderate disability (difficulty with 7–12 items) was associated with a 91 per cent higher risk of loneliness (OR = 1.91, 95% CI = 1.22–2.98) but, unlike depressive symptomology, a ‘dose–response’ relationship was not evident with only borderline significance for mild disability (difficulty with 1–6 items) and no association for severe disability (difficulty with 13–17 items). Fair or poor self-rated health (compared to excellent or very good) was associated with a 75 per cent greater risk (OR = 1.75, 95% CI = 1.20–2.53). Finally, having a limiting long-standing illness was associated with a 46 per cent higher risk of loneliness (OR = 1.46, 95% CI = 1.01–2.11).
Constructing a parsimonious model with all of the potential variables at baseline resulted in gender, loneliness compared with ten years previously, length of widowhood and depression all having a statistically significant impact on reported loneliness at baseline (Table 2). Loneliness was 53 per cent more likely to be reported by women than men (OR = 1.53, 95% CI = 1.07–2.21) but 82 per cent less likely in those who reported less loneliness than ten years previously (OR = 0.18, 95% CI = 0.08–0.37). The strong inverse association between loneliness and length of widowhood remained in this model with a clear ‘dose–response’ relationship, loneliness being 54 per cent more likely in the recently widowed (one to two years), 26 per cent more likely in those widowed for three to four years but 59 per cent less likely in those widowed for five or more years (OR = 0.41, 95% CI = 0.28–0.59). Those with mild depression were over twice as likely to report higher levels of loneliness (OR = 2.29, 95% CI = 1.44–3.64) and those with severe depression over four times as likely (OR = 4.47, 95% CI = 2.61–7.63). A back-stepped parsimonious model was constructed for identical variables at Waves 2 and 3 and the same variables were consistently found to be significantly associated with loneliness (results not reported).
Changing patterns of loneliness between ages 85 and 88
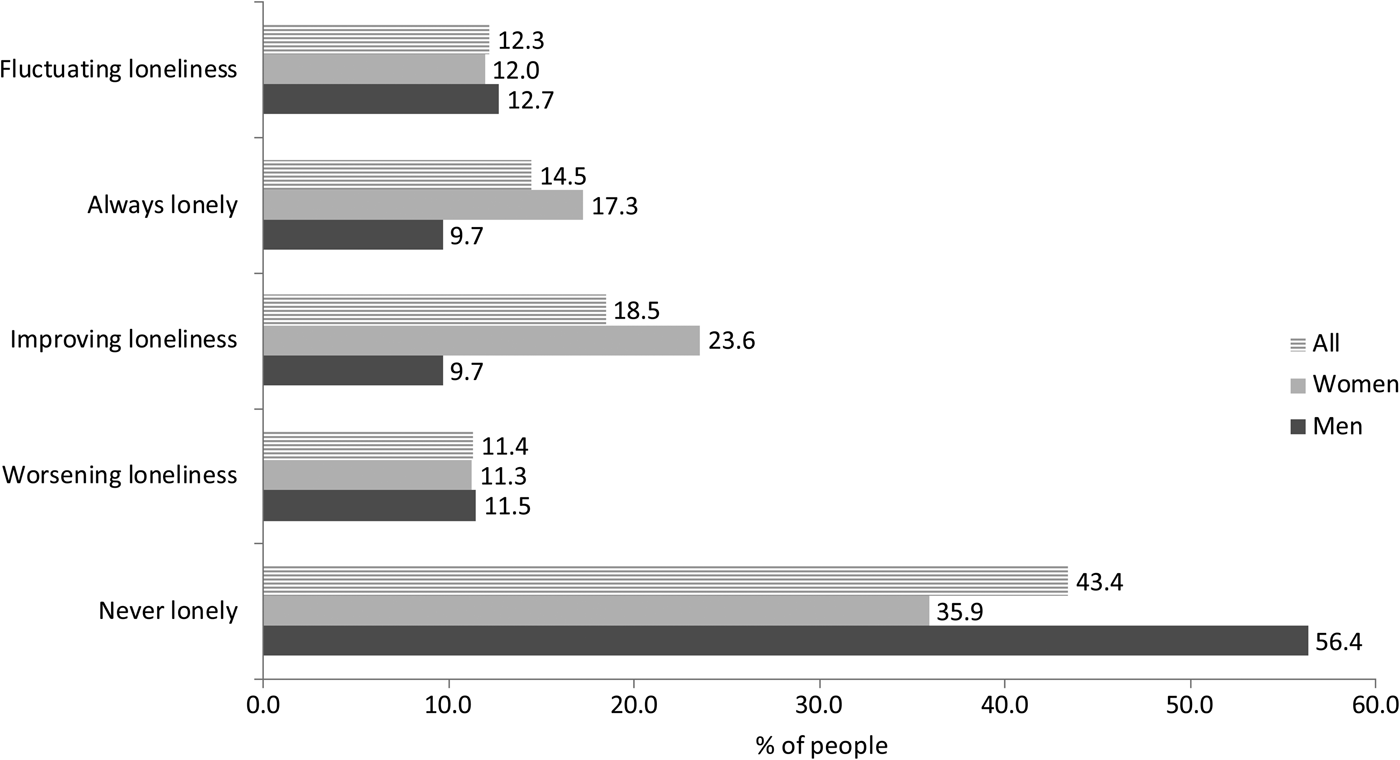
Analysis of the patterns of loneliness between ages 85 and 88 showed that the most common experience of participants was never feeling lonely at any of the three waves (43%) followed by loneliness improving over time (18%) (Figure 2). Persistent loneliness was reported by 14 per cent of participants and worsening loneliness by 11 per cent. There were, however, gender differences in the patterns of loneliness. Compared to men, women were almost three times more likely to report reducing loneliness over time (OR = 2.87, 95% CI = 1.60–5.16) but had almost twice the risk of always being lonely (OR = 1.94, 95% CI = 1.07–3.54) and were 57 per cent less likely to be never lonely over all three waves (OR = 0.43, 95%, CI = 0.29–0.64). No gender differences were found in the groups with worsening or fluctuating loneliness.
Pathways of loneliness over three waves and by gender.

Longitudinal risk factors for reporting loneliness
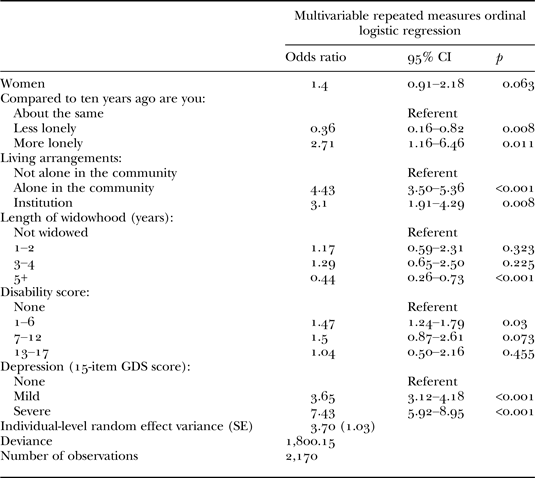
Using the full data-set of 750 participants and their contribution over three waves yielded a parsimonious model with five variables that were predictors of loneliness (Table 3). In general, this model was similar to the cross-sectional one although there was no significant gender difference in the risk of loneliness (OR = 1.40, 95% CI = 0.91–2.18). In addition, no significant effect of time (age) was found suggesting that the risk of loneliness did not significantly increase or decrease over time. A higher risk of loneliness remained for participants who lived alone in the community (OR = 4.43, 95% CI = 3.50–5.36), those institutionalised (OR = 3.10, 95% CI = 1.91–4.29) and those who reported feeling more lonely previously (OR = 2.71, 95% CI = 1.16–6.46). A lower risk of loneliness was seen in participants who reported feeling less lonely at baseline than ten years earlier (OR = 0.39, 95% CI = 0.16–0.82) and participants who had been widowed more than five years previously (compared with participants who were not widowed) (OR = 0.44, 95% CI = 0.26–0.73). With regard to health factors, higher risk of loneliness was found for participants with mild disability (difficulty with one to six items in the disability scale) (OR = 1.47, 95% CI = 1.24–1.79), mild depression (OR = 3.65, 95% CI = 3.12–4.18) and severe depression (OR = 7.43, 95% CI = 5.92–8.95). The random effects variances at the individual level were only just statistically significant, suggesting only a small amount of heterogeneity in the data that was not measured by the covariates in the model. In a sensitivity analysis we ignored baseline loneliness and assessed the effect of other baseline covariates on loneliness at Waves 2 and 3. We found this did not alter our previous conclusions.
Longitudinal predictors of loneliness

Notes: CI: confidence interval. GDS: Geriatric Depression Scale. SE: standard error.
Discussion
One of the main gaps in our knowledge from studies that have investigated loneliness in later life is its prevalence in the oldest old, the fastest growing section of the population but one that has been under-represented in previous studies of loneliness. Our findings from the Newcastle 85+ Study, show that over half (57%) of 85-year-olds reported ‘never’ feeling lonely whilst only 2 per cent reported ‘always feeling lonely’, rising to 10 per cent when including those feeling ‘often’ lonely. Nor was loneliness a static experience between the ages of 85 and 88 years, with fluctuating and improving patterns of loneliness being as or more common than remaining lonely. Nevertheless, there were gender differences in loneliness at age 85 and its trajectory over the subsequent three years. At baseline women were significantly more likely than men to report feeling ‘always’ or ‘often’ lonely, even after adjustment for potential confounding factors. However, longitudinally, risk factors other than gender appeared more important, these being living alone in the community or being in institutional care, feeling more lonely than in the past, having mild or severe depression or mild disability. We found no evidence of an association between cognitive function and loneliness at baseline or longitudinally. A recent systematic review (Boss, Kang and Branson Reference Boss, Kang and Branson2015) found that overall loneliness was associated with lower cognitive function, though this relationship disappeared in some cases once other factors were accounted for. Moreover, for all but one study the median age was below 80 years. Neither did we find any relationship between education and loneliness, in contrast to the association between education and disability in our cohort (Kingston et al. Reference Kingston, Davies, Collerton, Robinson, Duncan, Bond, Kirkwood and Jagger2015) and another study (Steptoe et al. Reference Steptoe, Shankar, Demakakos and Wardle2013), though again the latter was a predominantly young-old population who have had more education. It may be that relationships that hold in the young-old may not in the oldest old, and that other factors, for instance length of widowhood, become more important for loneliness in very late life. Moreover, we found an inverse relationship between length of widowhood and level of loneliness so that loneliness was much less likely the longer the time widowed.
Is loneliness a static experience in later life?
Although studies reporting the prevalence of loneliness and its correlates are common, those describing patterns of loneliness over time are rare. Similarly to Pinquart and Soresen (Reference Pinquart and Sorensen2001), our study challenges the notion that loneliness is a static experience or that it is an inevitable part of normal ageing or a phenomenon of old age. Indeed, the main pattern of loneliness between the ages of 85 and 88 years was never feeling lonely (43%), of a similar magnitude and confirming other studies (Iecovich, Jacobs and Stessman Reference Iecovich, Jacobs and Stessman2011; Jylhä Reference Jylhä2004; Victor and Bowling Reference Victor and Bowling2012). Our results of those who remained lonely over time (14%) are consistent with those published in Victor and Bowling (Reference Victor and Bowling2012), where studies show this to be between 13 and 22 per cent. Furthermore, in our study 11 per cent had worsening loneliness, very similar to the 10 per cent reported by Dykstra, Van Tilburg and de Jong Gierveld (Reference Dykstra, Van Tilburg and de Jong Gierveld2005) but less than the 25 per cent reported by Victor and Bowling (Reference Victor and Bowling2012), though the latter study had only two time-points and therefore could not identify fluctuating levels as we could. Both Victor and Bowling (Reference Victor and Bowling2012) and Jylhä (Reference Jylhä2004) highlight that between 12 and 13 per cent of the oldest old report improving loneliness over time, rather lower than our 18 per cent, whilst 19–25 per cent have worsening loneliness, somewhat higher than our 11 per cent. Despite our findings of gender differences in the patterns of loneliness, few studies report results for men and women separately, though Victor and Bowling (Reference Victor and Bowling2012) also reported that women were more likely to have an improvement in their loneliness.
Risk factors for loneliness in the oldest old
Research has highlighted that living alone is a risk factor for loneliness. However, living alone is not synonymous with being alone (Peace, Kellaher and Holland Reference Peace, Kellaher and Holland2006). We found that 85-year-olds living alone were three times more likely to report feeling lonely at baseline and this risk factor remained significant across all three phases of the study. Living in an institution, widowhood, reporting fair or poor health, having depression or mild disability were also significantly associated with changes in loneliness over time, confirming other studies (Victor and Bowling Reference Victor and Bowling2012). A decline in functional capacity, particularly for those who had high functioning previously, influenced an increase in loneliness (Dykstra, Van Tilburg and de Jong Gierveld Reference Dykstra, Van Tilburg and de Jong Gierveld2005). Dykstra, Van Tilburg and de Jong Gierveld (Reference Dykstra, Van Tilburg and de Jong Gierveld2005) argue that overall the trend over time is an increase in loneliness but their findings highlight a sub-group of older adults who become less lonely over time, primarily those who report an improvement in health. The strong relationship between depression and changing loneliness is perhaps unsurprising but similar effects are reported by only one other longitudinal study (Victor and Bowling Reference Victor and Bowling2012). Improvements in physical health and improved social relationships have been linked to reduced levels of loneliness (Victor and Bowling Reference Victor and Bowling2012), highlighting areas where interventions that target alleviating loneliness would benefit from the treatment of chronic and long-term health conditions in this age group.
One of the most consistently found risk factors for loneliness is widowhood. Research has highlighted that older people who have recently been bereaved of a partner experience a range of fears, including being socially isolated and victimised (Jivorec, Jirovec and Bosse Reference Jirovec, Jirovec and Bosse1984). It is believed that this group of people are particularly vulnerable to high levels of ‘alarm’ and ‘insecurity’ because of a shift in the make-up of their assumptive worlds (Parkes Reference Parkes1972). Research has also highlighted that morale and social engagement are influenced by widowhood (Bennett Reference Bennett1996, Reference Bennett1998) and that it is those who are newly widowed who report the lowest morale and social engagement (Bennett Reference Bennett2005). In a qualitative study exploring the changing nature of landscapes at a time of grief and bereavement, Hockey, Penhale and Sibley (Reference Hockey, Penhale and Sibley2001) found that even with busy lives and frequent contact with family and friends, participants qualified their statements by saying that they were lonely and even for those that felt some gains in their loss it was conceived as a ‘lonely freedom’. Furthermore, both men and women have an increased risk of mortality that lasts approximately six months after spousal bereavement (Jagger and Sutton Reference Jagger and Sutton1991). Therefore, there appears to be a time within this period of a person's life that makes them more ‘vulnerable’ (Victor et al. Reference Victor, Scambler, Bowling and Bond2005). In this context, Wenger and Burholt (Reference Wenger and Burholt2004) distinguish between loneliness and social isolation, suggesting that recent widowhood creates a risk of loneliness and that the risk of isolation increases with increasing length of widowhood. Unlike the other longitudinal studies, we could examine the relationship between loneliness and length of time in widowhood rather than simply the change in marital status. The pivotal time was one to two years from widowhood, and as time since widowhood increased, the likelihood of feeling lonely actually decreased. Thus ‘old age onset’ loneliness, or worsening loneliness as reported here, may be a response to losses, such as bereavement, that are more likely to occur in later life. Indeed this may be more likely to occur in the oldest old, given men's life expectancy is increasing faster than women's.
Strengths and limitations of the study
There are methodological challenges to studying and measuring loneliness in later life, particularly in terms of the way loneliness is elicited and the effect of loneliness on non-response resulting in less representative study populations. In terms of the former, more directive questioning may create gender differences in reporting (Pinquart and Sorensen Reference Pinquart and Sorensen2001). However, though one limitation is that we opted for a single question, this did result in fewer missing data, and therefore less bias. Nevertheless, we cannot be sure that it did not introduce a gender difference in reporting, although in longitudinal analyses gender was no longer significant as a risk factor for loneliness once other, more influential factors were included. There is also the issue of recall bias, particularly when participants are asked to compare loneliness to ten years earlier. However, both recall bias and non-response bias are issues in any study and specifically in the context of our analyses, those who are lonelier may also be those that are less likely to take part in research. The Newcastle 85+ Study overall had a high response rate and those refusing the full health assessment and opting for medical record review only, who could be thought of as partial responders, did not appear to have greater comorbidity (Collerton et al. Reference Collerton, Davies, Jagger, Kingston, Bond, Eccles and Kirkwood2009), a factor associated with higher likelihood of reporting loneliness. Moreover, missing data on the loneliness question was low (2.1%, 19/852). Indeed, a further strength of our study is its size and the high retention, ensuring a sample size large enough for robust cross-sectional and longitudinal analyses (Davies et al. Reference Davies, Kingston, Robinson, Hughes, Hunt, Barker, Edwards, Collerton, Jagger and Kirkwood2014).
A further challenge within this study is that this cohort is a selected age cohort, 85 years of age at time of recruitment and from a specific geographical area, the North East of England. However, this has both advantages and limitations in its study design. The advantages include a homogeneous stable ageing population which has ensured high retention. The North East was heavily industrialised and historically had a large coal-mining sector. We have previously shown that our population is representative of their birth cohort nationally in terms of gender, proportion in residential care and ethnicity (Collerton et al. Reference Collerton, Davies, Jagger, Kingston, Bond, Eccles and Kirkwood2009). For the latter, the oldest old population is still predominantly white, though this will change for future generations. Our study population, as others, is also a survivor cohort and is shaped by the differing life expectancies across socio-economic groups.
Conclusions for policy and practice
Social gerontology has challenged the notion that loneliness is an epidemic in later life, but recent media discussion has tended to focus on the widespread perception of chronic loneliness among older people. However, this is at odds with our (and other) research and only serves to reinforce ageist assumptions implicit in public policy on loneliness. Being lonely is not a static phenomenon: it changes and fluctuates over different time-points. Nonetheless, for those who experience severe loneliness it is a subjective state that has detrimental effects, including ill health and an increased risk of death. Moreover, there appear to be critical events such as bereavement, and critical time periods after this, that infer a higher risk of loneliness and, as men's life expectancy is increasing slightly faster than women's, more oldest old women will experience bereavement. Such older people at higher risk of loneliness need to be identified through health and social care services, or through community groups, to facilitate connections to wider networks, in the hope that this can alleviate their feelings of being lonely. In broader public health terms, policy needs to focus on preventative measures so that older people themselves are ready to self-manage loss whilst government agencies and non-governmental organisations provide those already lonely with support and services.
Acknowledgements
Katie Brittain and Andrew Kingston contributed equally to this work. This work was funded by the Medical Research Council. The study was approved by the Newcastle and North Tyneside Research Ethics Committee (reference 06/Q0905/2).