INTRODUCTION
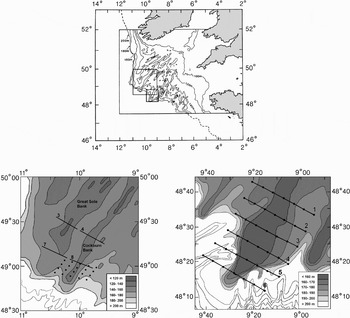
The Celtic Plateau is a broad area of continental shelf extending from the coastal regions of southern Ireland, south-west England and north-west France to the shelf-edge (Figure 1). Much of the outer shelf is characterized by a series of quasi-linear sand banks around 20–50 m in height, 40–200 km in length, spaced 15–20 km apart and aligned from north-east to south-west. It is likely these banks are remnants from circulation patterns during previous glacial conditions of lowered sea-levels (Belderson et al., Reference Belderson, Pingree and Griffiths1986).
Bathymetric chart of the Celtic Plateau (top panel) with inset areas showing the surveys over Great Sole and Cockburn Banks (lower left) and Little Sole Bank (lower right) with Undulator transects (numbered) and station positions (dots).

Satellite imagery has revealed occasional patterns of sea surface temperature corresponding to the layout of the banks, which has been interpreted as being due to the interference of bank topography with circulation and mixing (Pingree et al., Reference Pingree, Holligan, Mardell and Head1976). It is believed that, although generally weak, the current velocities on the Celtic Sea shelf may increase and create asymmetrical gyres around the banks (Bouysse et al., Reference Bouysse, Horn, Lapierre and Le Lann1976). One possible consequence of this altered mixing regime is enhanced primary production due to nutrient replenishment of the upper stratified layers (Pingree et al., Reference Pingree, Mardell, Holligan, Griffiths and Smithers1982). Ultimately, this may account for the more general increased plankton and fisheries productivity of the area (Coombs et al., Reference Coombs, Aiken and Griffin1990; Hortsman & Fives, Reference Hortsman and Fives1994), which is dominated by mackerel (Scomber scombrus) spawning in the early summer.
It was in this context that sampling was carried out over Great Sole, Cockburn and Little Sole Banks to investigate relationships between bank topography, hydrography and plankton distribution. This was primarily a descriptive study, supported by deployment of drifting buoys to track water flow in the vicinity of the banks in relation to retention/dispersion of any localized enhanced production. These field results are presented here and are supplemented by application of a simple model to examine the potential influence of bank conditions on stratification and primary production over an annual cycle.
MATERIALS AND METHODS
Great Sole and Cockburn Banks
Sampling was carried out over Great Sole and Cockburn Banks over the period 2–6 May 1987. Initial sampling was by Undulator (Aiken, Reference Aiken1972) tows along a series of 32 km transects across both banks, for which data are available for four sections (Figure 1). The Undulator is a self-contained sampler with a variable diving plane allowing it to follow a sinusoidal depth profile from near-surface to ~60 m depth over a wavelength of ~1.8 km. It is towed at ~5 m.sec−1 and takes measurements of temperature, conductivity (for calculation of salinity) and chlorophyll-a fluorescence at 5 second intervals.
Subsequent to the Undulator survey, further sampling was carried out on a 20 station 22 × 44 km grid towards the shelf-edge end of Cockburn Bank (Figure 1). This included vertical profiling by CTD (Guildline 8705) and Variosens fluorometer for chlorophyll-a. Plankton sampling was carried out using a 60 cm inlet diameter bongo net system towed at a nominal 1.0 m.sec−1 to 100 m depth. The bongo was fitted with separate nets of 200 µm and 40 µm mesh aperture, enabling concurrent sampling for meso-zooplankton (copepod adult stages and ichthyoplankton) and micro-zooplankton (copepod nauplii); samples were analysed after preservation in 4% buffered formaldehyde solution.
Little Sole Bank
A similar cruise was carried out over Little Sole Bank over the period 8–24 June 1991, with sampling by Undulator tows along six cross-bank transects, each 38 km in length (Figure 1). Sampling at 42 station positions (7 stations spaced along each transect) was then completed by CTD (Neil Brown Mk III, including Chelsea Aquatracka fluorometer for chlorophyll-a) deployments and plankton tows using a 50 cm version of the Gulf sampler (Nash et al., Reference Nash, Dickey-Collas and Milligan1998). This was towed at a nominal 1.75 m.sec−1 on a double oblique profile to 120 m depth and was fitted with separate nets of 280 µm and 53 µm mesh aperture for meso- and micro-zooplankton. Sample treatment was as for the Cockburn Bank bongo samples.
In order to track local currents, four drifting Argos buoys (see www.argosinc.com/documents/sysdesc.pdf), drogued at 10 m depth, were deployed in the vicinity of Little Sole Bank and tracked for 12 days during the cruise. Raw position data from the buoys were available at intervals of around 3 hours.
Data processing
All contour plots of field data were created with Surfer™ using the default data processing and plot options and kriging as the gridding method.
Correlations were tested in Excel™ using the two-way Pearson's correlation coefficient.
Production modelling
A simple one-dimensional primary production model was used (Phyto-1D; Sharples, Reference Sharples2000), which is designed to investigate vertical turbulent structure of a shelf seawater column and primary production. A turbulence closure scheme provides the link between local vertical stability, which is forced by seasonal solar heating, and vertical turbulent mixing, which is driven by tidal currents and surface wind stress. A simple cell quota threshold limitation model provides the biological component. The biological parameters, representing a simplified bloom of neutrally buoyant phytoplankton cells, was left unchanged, while the water depth was varied from 180 m to 150 m, and the peak M2 tidal velocity from 0.36 m.s−1 to 0.45 m.s−1 (based on observations in Pingree, et al., Reference Pingree, Holligan, Mardell and Head1976) to represent off-bank and on-bank conditions, respectively.
RESULTS
Undulator transects
GREAT SOLE BANK AND COCKBURN BANK
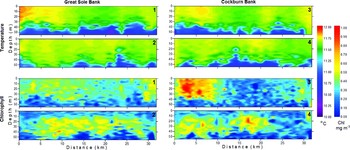
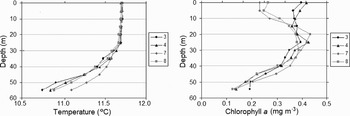
On both of the first two Undulator transects across Great Sole and Cockburn Banks (tows 3 and 4; Figure 1) there were regions of slightly lower stratification in the middle sections of the tows (Figure 2) corresponding to the location of the banks. However, there was no similar pattern on the two other transects (tows 7 and 8), which were situated more towards the outer shelf. Vertical temperature profiles averaged along each tow were similar, with a relatively small temperature difference of ~0.7°C over the 0–50 m depth-range; conditions along tow 7 were marginally less stratified than on the others (Figure 3).
Temperature (upper four panels) and chlorophyll-a (lower four panels) cross-sections along the four Undulator tows (numbered in top right corner of each panel) across Cockburn and Great Sole Banks. North-west to south-east from left to right.

Vertical profiles of mean temperature and chlorophyll-a along the four Undulator tows across Cockburn and Great Sole Banks.

Undulator results for chlorophyll-a also showed a contrast between the more on-shelf tows (tows 3 and 4), where averaged chlorophyll levels were similar through the upper 25 m of the water column, and those further towards the outer shelf (tows 7 and 8), where lower near-surface chlorophyll levels resulted in a sub-surface chlorophyll peak at 20–30 m depth (Figure 3). Relationships between changes in chlorophyll distribution along the tows (Figure 2) and location of the banks in the middle section of the tows were not sufficiently consistent to conclude any general pattern. Chlorophyll values were generally very low, but with a patch of relatively higher values (>0.7 mg.m−3) to the north-west of Cockburn Bank on tow 4 (Figure 2).
LITTLE SOLE BANK
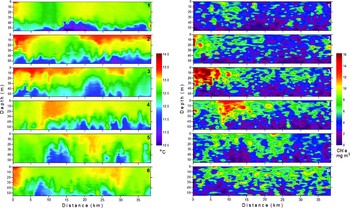
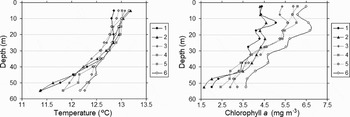
Undulator sampling across Little Sole Bank showed considerable variation in temperature and chlorophyll-a, both within and between tows, but with little consistent relationship with bank topography (Figure 4). Thermal stratification of around 2°C was evident in the upper 60 m of the water column, with considerable variation in isotherm depth and structure along all transects. A trend (r = 0.84, P < 0.05) in reduction of temperature stratification (Figure 5) was seen in progressing from on-shelf (tow 1) towards the shelf-edge (tow 6). Chlorophyll-a was more patchily distributed than temperature, with higher values mostly in the upper 40 m of the water column following the variations in isotherm depth. The clearest feature was a chlorophyll bloom (>12 mg.m−3) to the north-west ends of transects 2, 3 and 4; otherwise background levels of chlorophyll-a generally increased (r = 0.92, P < 0.05; Figure 5) from on-shelf (tow 1) towards the shelf-edge (tow 6).
Temperature (left panels) and chlorophyll-a (right panels) cross-sections along the six Undulator tows (numbered in top right corner of each panel) across Little Sole Bank. North-west to south-east from left to right.

Vertical profiles of mean temperature and chlorophyll-a along the six Undulator tows across Little Sole Bank.

Station grids
COCKBURN BANK
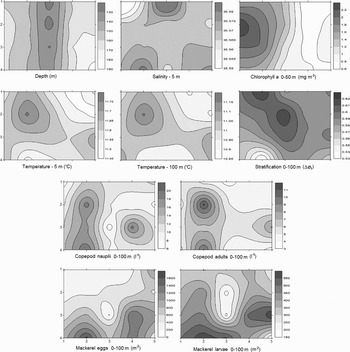
Although there were no significant correlations between water depth and the measured parameters on the grid sampling over Cockburn Bank (Figure 6), there were some patterns in the data which could be related to the bank lineation. Both copepod nauplii and adult stages were more abundant either side of the bank, with the higher concentrations along the north-western flank. A related pattern was seen in the temperature data, where higher values occurred in patches either side of the bank and higher stratification levels tended diagonally from the north onto the ridge of the bank. The area of higher chlorophyll-a values in the north-western half of the grid was also bounded by the crest line of Cockburn Bank. There was a significant trend of increasing abundance in mackerel eggs and larvae towards the shelf-edge (r = 0.56 and 0.46, respectively, P < 0.05), with somewhat lower numbers over the bank.
Contoured plots of station grid data over Cockburn Bank. The figures are re-orientated relative to Figure 1 with the station positions indicated on the x and y axes.

LITTLE SOLE BANK
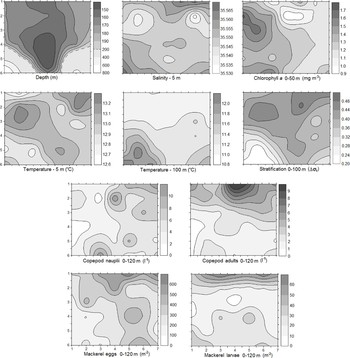
Based on the station data, the contoured pattern of stratification was the parameter most closely related to bank topography, being negatively correlated with water depth (r = –0.64, P < 0.05; Figure 7). However, this relationship was strongly influenced by the overall on-shelf/off-shelf gradient of stratification, also seen in the Undulator results, and emphasized in the plot of temperature at 100 m depth (Figure 7). Conversely, mackerel eggs and larvae, as well as copepod adults and nauplii were somewhat more abundant with distance from the shelf-edge (all significant at P < 0.05). A patch of higher chlorophyll was noted to the north-west of the grid, which corresponded with the Undulator results.
Contoured plots of station grid data over Little Sole Bank. The figures are re-orientated relative to Figure 1 with the consecutively numbered station lines indicated on the y axis and the station positions along the lines on the x axis.

Buoy drift
The buoy drift patterns showed evidence of retention along the flank of Little Sole Bank, at least for the first few days for buoys 2, 3 and 4, and for the entire 12 day deployment of buoy 1 (Figure 8). Subsequently, after 2, 8 and 9 days, respectively, buoys 4, 2 and 3 made directed displacements towards the adjacent bank to the south-east at a mean speed of 0.29 km day−1. The mean displacement and dispersion rates of the buoys over 10 days, based on the position of their centre of gravity, was 1.35 km day−1 and 1.2 km day−1, respectively.
Deployment positions of the four Argos buoys on the south-east flank of Little Sole Bank and their subsequent drift as 12 hour running means plotted at 3 hourly intervals.

The buoy positions in Figure 8 are plotted as 12-hourly running means in order to eliminate the considerable noise in the raw position data of the semi-diurnal tidal oscillations. Isolation of the 12.4 hour tidal harmonic by Fourier analysis of the original tracking data, showed this to represent 40.1% of the observed variance of the buoys' drift positions, with a mean tidal ellipse in a clockwise rotation oriented 27.8°E. Thus, the buoys were oscillating approximately twice daily at least 3.0 km in line with the axis of the bank and laterally at least 1.5 km.
Production modelling
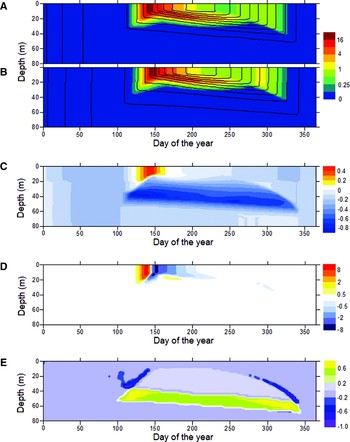
The modelling results showed, as expected, the onset of thermal stratification in the spring, increasing to its most developed state through the summer (0–40 m Δt of 7°C) and then eroding through the autumn (Figure 9). Highest chlorophyll-a values (~20 mg.m−3) occurred through the upper 20 m of the water column during the spring bloom following stabilization of the water column. A sub-surface peak of elevated chlorophyll values continued at the thermocline through the summer, becoming progressively deeper in parallel with development of the isotherms. A weak autumn bloom (~2 mg.m−3) was also evident. Relative to the modelling results, the time of cruise sampling in early May over Great Sole and Cockburn Banks (days 123–127) was at the start of the spring bloom, whereas sampling at Little Sole Bank in June (days 159–175) was past the spring bloom but before the sub-surface peak of chlorophyll was established.
Contour plots of temperature (contour lines 1.0°C intervals) overlaid on chlorophyll-a (coloured shading, mg m−3) plotted against time and depth for on-bank (A) and off-bank (B) conditions, together with differences between the two (positive values indicating higher values in the on-bank situation) for temperature (C), chlorophyll (D) and vertical mixing coefficient (E; Kz in units of m2 s−1).

Variations between the annual development of temperature and chlorophyll for on-bank and off-bank conditions were relatively small, but can be seen in the difference plots of Figure 9. For temperature (Figure 9C), the on-bank conditions gave slightly earlier and stronger stratification, this being most evident in the relative increase (up to 0.5°C) in the 0–20 m temperatures during formation of the spring thermocline. Resulting from this temperature difference was an earlier spring bloom of chlorophyll for on-bank conditions (Figure 9D); essentially, this was due to the reduction in mid-depth (10–40 m) mixing (Figure 9E) at the onset of stratification and preceding the spring bloom.
DISCUSSION
Although there was no striking evidence of a link between bank topography and hydrography or plankton distributions, there were some related patterns. For example, Undulator results showed patches of higher chlorophyll on the north-western slopes of both Cockburn and Little Sole Banks; similarly, in both sets of station grid data higher chlorophyll concentrations, and associated warmer temperatures at 5 m depth, were to the north-west of the banks. On both of the more on-shelf Undulator tows over Great Sole and Cockburn Banks, less stratified conditions occurred over the banks, whereas on the two station grids, which were nearer the shelf-edge, there was somewhat higher stratification over the banks. For the Little Sole Bank sampling grid, which extended further over the shelf-edge than the Cockburn Bank grid, shelf-edge mixing (Pingree & Mardell, Reference Pingree and Mardell1981) tended to dominate the hydrographic patterns. Over the central ridge of Cockburn Bank there were lower concentrations of copepod nauplii and adults, as well as mackerel eggs and larvae.
The potential influence of banks on production was supported by the modelling results, where, in such a simple modelling scheme, relative changes are of more interest than absolute values. The simulations showed the expected pattern of development of the spring bloom following thermal stratification and the ensuing mid-depth peak of chlorophyll at the thermocline (Holligan & Harbour, Reference Holligan and Harbour1977). The increased tidal current in the on-bank situation resulted in a more marked gradient of vertical mixing, allowing earlier stratification and resultant spring bloom than in the off-bank situation. However, there was only a small difference between the modelled situations and therefore it was not surprising that this was not simply reflected in the Undulator results. Additionally, there is the potential for advection and dispersion to counteract persistence of a simple pattern in field data.
The partial retention of the drift buoys indicated some modification of the flow field around Little Sole Bank. Similar behaviour was also observed for a drift buoy retained for 53 days in June/July 1983 in the vicinity of Cockburn Bank (Pingree et al., Reference Pingree, Sinha and Griffiths1999). Residual gyres and modifications to the regional flow pattern have previously been associated with submarine banks, for example, for Georges Bank (Loder et al., Reference Loder, Shen and Ridderinkof1997) and Hecate/Stonewall Banks (Barth et al., Reference Barth, Pierce and Castelao2005). Consequential effects on production are therefore likely, since it is well recognized that changes in mixing and water column stability are significant determinants of primary production (Pingree et al., Reference Pingree, Holligan, Mardell and Head1976). However, any such links may be obscured at higher trophic levels of the plankton by the complexities and delays of the biological links (Holligan, Reference Holligan1981).
In the present study there was a relatively low mean dispersion rate of 1.2 km day−1 coupled with mean advection rates of 0.29 km day−1 in the faster flow. This might be sufficient to retain a pattern in chlorophyll but increasingly leads to dissipation at higher trophic levels as the lag in the food chain is absorbed. Peterson (Reference Peterson1986) showed a 3–4 day delay before an increase in phytoplankton was expressed as an increase in copepod egg production; development from egg to adult then takes from about 1–4 weeks, depending on species and temperature (Henderson & Steele, Reference Henderson and Steele1995). Radach et al. (Reference Radach, Carlotti and Spangenberg1998) found a modelled delay of about four weeks between the spring bloom of phytoplankton and zooplankton. Thus, perhaps only at a larger geographical scale might bank topography be directly related to zooplankton distributions, as seen for certain copepod populations over Georges Bank (Ashjian et al., Reference Ashjian, Davis, Gallagher and Alatalo2001).
The present study has indicated that, while there may be no absolute increase in production due to the banks' influence, both the timing of the spring bloom and the subsequent dispersal of plankton in the altered flow regime are likely to be influenced by the presence of the banks. From a combination of the timing of on-bank and off-bank production, this could result in a generally longer period of spring production at the regional scale. Additionally, a more substantial relationship between topography and hydrography and plankton cannot be discounted in areas further onto the continental shelf, where the bathymetry of the banks is relatively more pronounced, tidal currents are stronger and the shelf-edge influence less.
ACKNOWLEDGEMENTS
Acknowledgements and thanks are due to Ian Joint, Tim Smyth, Jim Aiken and Sandra Chenery of Plymouth Marine Laboratory and to Serge Poulet and Patrick Camus of the Roscoff Station Biologique for various aspects of cruise organization, data provision and assistance. Funding for this retrospective data analysis was provided, in part, by the NERC Oceans 2025 programme.