Research with anxious adults has demonstrated robust processing biases for threatening stimuli, including attentional, encoding and interpretative biases (see Power & Dalgleish, 1997; Richards, 2004; Wells & Matthews, 1994; Williams, Watts, MacLeod, & Mathews, 1997; for reviews of this literature). A growing body of research has also demonstrated processing biases to threat cues in clinically anxious children (Taghavi, Moradi, Neshat-Doost, Yule, & Dalgleish, 2000; Vasey, Daleiden, Williams, & Brown, 1995) and children with high trait anxiety (Dineen & Hadwin, in press; Muris, Merckelbach, & Damsma, 2000). These attentional biases form significant components of cognitive theories of anxiety (Eysenck, 1997; Williams et al., 1997) and are argued to be critical in the etiology (MacLeod, Rutherford, Campbell, Ebsworthy, & Holker, 2002) or maintenance of anxious states (Mogg & Bradley, 1998).
Research exploring the developmental emergence of cognitive biases in anxiety is important for a number of reasons. The presence of cognitive biases early in childhood might encourage further research that aims to establish whether such biases are markers for the development of anxiety (Vasey & MacLeod, 2001; Warren, Emde, & Sroufe, 2000). In addition, research to establish the presence of a threat bias in young children serves to inform developmental models of cognition and emotion. Previous researchers have tried to understand the relationship between cognitive biases and anxiety in development. Jones (1984, 1987), for example, suggested that the cognitive effects of emotion are not inherent consequences of that emotion. An association develops as a result of learning between the emotion and a certain pattern of cognitive processing. Emotional biases develop over time as a result of the creation of a pattern of bidirectional associations between certain external situations and particular emotional states. For example, feelings of depression are often initially the result of loss or failure to achieve important goals, and these feelings come to activate the representations of the negative external event. These feelings therefore become influential in shaping cognitive processing. This hypothesis, referred to as the inferred bias hypothesis, would predict that cognitive biases associated with particular emotions should increase with age. An alternative position is the integral bias hypothesis, where cognitive processes are proposed to be an inherent component of emotion (Martin, Horder, & Jones, 1992; Martin & Jones, 1995). Specific emotions have evolved in order to coordinate specific cognitive goals. The integral bias hypothesis would predict that cognitive biases should remain relatively constant from childhood to adulthood (Martin et al., 1992; Rapee, 2000). A further position argues that a bias for threatening stimuli is a normal characteristic of young children (Kindt, Bierman, & Brosschott, 1997; Kindt & Van den Hout, 2001). Kindt et al. (1997), for example, found that 8- to 12-year-old children, both high and low anxious, showed increased Stroop interference for spider-related words. This “inhibition hypothesis” proposes that from middle to late childhood, typically developing children learn to inhibit the processing of threat, whereas fearful children fail to show this inhibition. Kindt and Van den Hout (2001) suggest that anxiety in childhood leads to a failure to inhibit selective attention to threat, which in turn, enhances the vulnerability to anxiety disorders in adulthood.
The aim of the present study was to investigate further the presence of cognitive processing biases in childhood anxiety. More specifically, it employed a recently developed paradigm using emotional faces to explore sensitivity to threat in adults with a child population (see Richards et al., 2002). A further aim was to assess the validity of this paradigm by comparing performance on the face task to performance on an attentional allocation task using a modified Stroop. It has been argued recently that it is possible to address the validity of tasks used to investigate cognitive biases in children through the use of “converging methodologies” (Vasey, Dalgleish, & Silverman, 2003, p. 85). If tasks used to measure processing biases in childhood anxiety are tapping similar underlying cognitions, then performance across tasks should be interrelated. The inclusion of two tasks allows for a test of the possibility that performance between these two tasks is associated and that the measures are valid.
The Stroop task has been used successfully in childhood populations to demonstrate an association between attention to threat and increased anxiety (e.g., Martin et al., 1992; Martin & Cole, 2000; Moradi, Taghavi, Neshat-Doost, Yule, & Dalgleish, 1999). Martin et al. (1992), for example, used an emotional spider Stroop paradigm where children between the ages of 6 and 13 were asked to name the color of different types of stimuli including spider-related words. They found a cognitive processing bias in spider phobics of 6 or 7 years of age that remained constant across development and was of a comparable size to that observed in adult populations. Similarly, Martin and Cole (2000) found that low-social status, but not high-social status, 8- to 12-year-olds exhibited significantly greater interference for negative social words compared with control words in a Stroop task. Recent literature using an emotional Stroop paradigm has also found an attentional bias to threat in children with posttraumatic stress disorder (Moradi et al., 1999; but see also Dalgleish et al., 2003, for counterevidence). In addition, studies using the Stroop paradigm with adolescent samples have produced some support for a processing bias similar to that of adults (Richards, Richards, & McGeeney, 2000; Schwartz, Snidman, & Kagan, 1996).
With respect to interpretation biases and anxiety, studies with adults have shown that anxious individuals are more likely to choose threatening interpretations of threat-neutral homophones (Byrne & Eysenck, 1995; Eysenck, MacLeod, & Mathews, 1987; Mathews, Richards, & Eysenck, 1989; Richards, French, & Reynolds, 1993), and to show threat-related strategic priming effects following threat-neutral homographs (Richards & French, 1992). Anxious adults are also more likely to interpret ambiguous scenarios (e.g., Butler & Mathews, 1983) and ambiguous sentences (e.g., Calvo & Castillo, 1997, 2001; Calvo, Eysenck, & Castillo, 1997; Calvo, Eysenck, & Estevez, 1994; Eysenck, Mogg, May, Richards, & Mathews, 1991; MacLeod & Cohen, 1993) in line with a threatening interpretation. Comparable findings have been demonstrated with child samples. Anxious children make more threatening interpretations of emotionally ambiguous scenarios than matched controls (Barrett, Rapee, Dadds, & Ryan, 1996; Chorpita, Albano, & Barlow, 1996; Dineen & Hadwin, in press; Muris et al., 2000). Similarly, Taghavi et al. (2000) found that anxious children between the ages of 8 and 17 years asked to generate sentences that included a threat-neutral homograph were more likely to produce threatening than neutral sentences. All of these studies relied on reading ability or sentence generation. Hadwin, Frost, French, and Richards (1997), however, developed a pictorial analogue of the threat/neutral homophone task. Here, ambiguous threat-neutral words were presented auditorily and children were required to choose which of two pictures corresponded to what they had heard. It was found that increased trait anxiety was associated with threatening rather than neutral interpretations of the homographs.
There is a debate over the emergence of a facial processing system, with some research pointing to a specialist facial processing module that has an innate representation of basic face structure (e.g., Farah, Rabinowitz, Quinn, & Lui, 2000; Morton & Johnson, 1991), whereas other research provides support for the view that facial processing is simply a generic expertise effect that takes much longer to develop (e.g., Diamond & Carey, 1986). There are data to support the “expertise” view (e.g., Mondloch, Le Grand, & Maurer, 2002) suggesting that the facial processing system is not mature until approximately 10 to 12 years, but also evidence to suggest a much earlier emergence (6 years at the latest; Gilchrist & McKone, 2003). There is some evidence that differentiation of some emotional expressions emerges during early infancy (Barrera & Maurer, 1981; Young-Browne, Rosenfeld, & Horowitz, 1977), and that 5- to 6-year-olds are able to identify faces expressing particular emotions (Bruce et al., 2000). However, there has been relatively little investigation into individual differences in the emergence of the face processing system, and the current investigation will provide data relating to this issue. Holdnack (1999) tested 10- to 17-year-old children and found that deficits in facial affect recognition may affect observable social behaviors. Children who had difficulty in discriminating fear expressions from other emotional states were perceived by others to be displaying odd behavior and to be socially withdrawn. However, inability to discriminate sadness from other emotions was less likely to be perceived as being associated with odd behavior.
The development of paradigms using picture stimuli with children enables researchers to explore the developmental origins of cognitive biases. Research with adults (e.g., Byrne & Eysenck, 1995) and more recently with children (Hadwin et al., 2003) has utilized angry faces to explore links between attentional allocation in anxiety and processing of threatening information. These studies have found that individual differences in anxiety can influence the detection (Bradley, Mogg, & Millar, 2000; Byrne & Eysenck, 1995; Gilboa-Schechtman, Foa, & Amir, 1999) or search times for angry faces (Hadwin et al., 2003). Recent research has developed a paradigm to look at classification biases in anxiety using facial expression. Richards et al. (2002) presented high- and low-trait anxious adult participants with a series of emotionally ambiguous faces to classify. These emotional expressions were continua of interpolated (“morphed”) facial images of photographic quality. Faces expressing one of the six basic emotions were placed next to each other to create an emotion hexagon so that each emotional expression was adjacent to the emotional expression with which it was most easily confused (see Young et al., 1997). The anger emotion was then joined to the happiness emotion to produce the emotion hexagon. Six continua were then derived by combining each prototypical emotional expression in varying proportions with its adjacent image. For example, images along the anger–happiness continuum comprised faces with the following proportions of emotion: 90% anger–10% happiness, 70% anger–30% happiness, 50% anger–50% happiness, 30% anger–70% happiness, 10% anger–90% happiness, and the same for each of the remaining continua. Thus, each facial expression was always a combination of two emotions (i.e., happiness–surprise, surprise–fear, fear–sadness, sadness–disgust, disgust–anger, and anger–happiness).
The findings of this work showed that high-trait anxious adults classified more of the faces as fearful, compared with the low-trait anxious group when there was a component of fear in the face (i.e., along the surprise–fear, fear–sadness continua). In addition, participants subjected to a mood manipulation to increase their anxiety levels classified more faces that contained some anger as expressing anger, compared with those in a control condition. In a related study, Richards, French, Zanelli, Calder, & Young (2003) used two emotion continua that were created from computer-manipulated (morphed and caricatured) angry and happy facial expressions. However, the emotional expressions were morphed with a neutral rather than a different emotional expression. Each continuum comprised facial expressions of varying levels of emotion: 25% emotion–75% neutral, 50% emotion–50% neutral, 100% emotion–0% neutral (i.e., emotion prototype) and 150% emotion–0% neutral (i.e., emotion caricature). In this study, they found that high-trait anxious individuals showed enhanced sensitivity for anger compared with the low-trait anxious individuals, and that the two groups did not differ in terms of their response bias.
Following Richards et al. (2003), the aim of the present study was to explore sensitivity to negative facial emotions in childhood anxiety using morphed facial expressions. Just two emotions were selected to allow the children to perform the task easily. If the emotion hexagon, as described above, had been employed, children would have had to discriminate several negative emotions from each other (e.g., fear, anger, disgust, etc). Anger and happiness were chosen because these were the two emotions used by Richards et al. (2003) and also because there is some evidence that the amygdala may well be involved in anger as well as fear. For example, Morris, Öhman, and Dolan (1998) showed that activity in the amygdala was modulated by unconscious exposure to conditioned angry expressions.
To assess the validity of this emotion recognition task participants also completed a modified Stroop task. In both tasks children were assigned to anxiety groups on the basis of their scores on a self-report anxiety scale. The emotional face task combined a neutral expression with either an angry or a happy facial expression (with the varying levels of emotion). Two continua were presented; one combined angry and neutral expressions, and the second combined happy and neutral expressions. Participants were required to classify individually presented images as “happy” or “angry.” It was anticipated that the tendency to classify emotional faces as angry would be stronger in the high versus low anxiety participants. Anger expressions function to curtail the behavior of others who are deemed to be violating social expectations or rules (Averill, 1982). A person with a high level of social anxiety might therefore be expected to have enhanced sensitivity for anger given that such individuals would be motivated not to break social conventions and rules.
Following previous work highlighting a processing bias in anxious children (e.g., Muris et al., 2000), this pattern of results would be most significant for more emotionally subtle faces (25% emotion–75% neutral, 50% emotion–50% neutral blends). In the modified Stroop task, a series of Stroop cards displaying anxiety-related, anxiety-matched neutral, positive and positive-matched neutral words was presented, and the children were required to identify the color of the words on each card. Following previous work (e.g., Moradi et al., 1999), it was anticipated that response latencies to color-name anxiety-related words would be greater in children high versus low in trait anxiety.
The integral bias hypothesis (Martin et al., 1992) predicts that the high-anxious group should demonstrate threat-related biases comparable to those obtained in adults. The inferred bias hypothesis would predict that as age increases so do the cognitive biases associated with threat. Therefore, the cognitive biases present in children should be smaller than those found with adults. Finally, the developmental inhibition hypothesis would predict that both groups should show both increased Stroop interference and increases in the detection of anger in facial expressions containing anger in comparison to adults, as the ability to inhibit threat develops during childhood. In addition, the current experiment investigates the possibility that performance across the two tasks will be correlated with each other. Although the two tasks are different in terms of the processing components involved, both tasks involve the processing of emotional material. If it were the case that anxious children have a processing bias for all threat-related stimuli, then it would be predicted that performance across the two tasks would be correlated.
Method
Participants
Children were recruited from a primary school in Greater London. Informed written parental consent was obtained for 50 children (26 girls) aged 10–11 years (mean age = 11 years, SD = 3.71 months, range = 10 years and 5 months to 11 years and 7 months). This age was selected as an appropriate age for the level of difficulty of the task. Fifty parents who were approached agreed to let their children take part in the study, and 6 refused. The parents and children were told that they would perform three tasks involving naming colors, labeling emotional faces, and completing a “How I feel” questionnaire. All children had normal or corrected to normal eyesight, and none were color-blind as assessed by the Ishihara color blindness test. The reading level of all children was assessed by the teacher using the London Reading Test (Biscoe et al., 1985), and all children were average or above in relation to their chronological age. The children came from a range of socioeconomic backgrounds and ethnic groups, but all had English as a first language.
Materials and measures
State-Trait Anxiety Inventory for Children (STAIC)
The STAIC (Spielberger, 1973) is a self-report measure designed to assess state and trait anxiety in children between 9 and 12 years of age. The STAIC A-State consists of 20 statements that ask children how they feel at that particular moment in time. The STAIC A-Trait Scale also consists of 20 statements and participants respond to these by indicating how they generally feel. Each item was read aloud and children were asked to tick boxes next to the statements that best described their feelings. The maximum score for each scale is 60. There is evidence that the STAIC has good internal consistency (Muris, Merckelbach, Ollendick, King, & Bogie, 2002; Spielberger, 1973) and convergent and divergent validity (Muris et al., 2002) in children. Bedell and Roitzsch (1976) reported test–retest reliability coefficients over a 10-day to 3-month period for a child sample. They found correlation coefficients over this period of .94 for trait anxiety and .56 for state anxiety. Trait anxiety appears to be a relatively stable personality characteristic, whereas changes in state anxiety are associated with stress (Bedell & Roitzsch, 1976; Spielberger, 1973).
Cognitive tasks
All children were tested on the cognitive tasks by one experimenter (G.N.) in a room in the school, which was used exclusively by the experimenter for the duration of the experiment.
Modified Stroop task
The card format of the Stroop task was used in this study. Eight anxiety-related words or eight positive words were used, and for both emotional sets, a set of eight neutral words was matched for word frequency and word length (see Appendix A). In total, there were four experimental cards each containing words of the same emotional type (anxiety-related, positive, neutral words matched to the anxiety-related words, and neutral words matched to the positive words). Each word appeared 12 times, 3 times in each of four colors (red, green, blue, and yellow). An additional card was prepared of eight neutral words that was presented as a practice card, with each word presented 12 times, 3 times in each of the four colors. The order of presentation of the four experimental Stroop cards was counterbalanced using a Latin square.
Emotional expression task
Stimuli in this task consisted of static gray-scale images of happy and angry facial expressions, computer manipulated (morphed and caricatured) relative to the neutral expression of the same face (with varying levels of emotion: 25% emotion–75% neutral, 50% emotion–50% neutral, 100% emotion–0% neutral [emotion prototype], and 150% emotion–0% neutral [emotion caricature]). Eight Caucasian models (four females and four males) were selected from Ekman and Friesen's (1976) pictures of facial affect. For each emotion category, and for each of the eight faces, a range of four intensities was taken from the commercially available Facial expressions of emotion: Stimuli and tests (Young, Perrett, Calder, Sprengelmeyer, & Ekman, 2002).
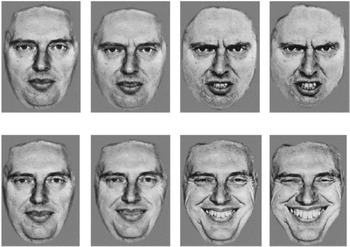
The 25 and 50% intensities were produced by using a morphing technique that involved computerized blending of the prototype (e.g., anger expression) with its neutral expression to produce a 25% anger–75% neutral image and a 50% anger–50% neutral image. The third intensity level (100% emotion) was the prototype image from the Ekman and Friesen (1976) series. The fourth intensity was a caricature and comprised 150% emotion. As Figure 1 shows, the combination of morphing and caricaturing creates a continuum varying in the intensity of the expressed emotion for one of the models. Each of the eight faces was presented for both emotions at each of the four intensities, making a total of 64 trials. A short practice block of eight neutral faces was presented at the beginning of the session.

Examples of expressions along the angry-neutral and happy-neutral continua 25% emotion–75% neutral, 50% emotion–50% neutral, 100% emotion–0% emotion, 150% emotion–0% neutral.
Procedure
Participants were tested individually in a quiet room and were presented with the Stroop task and the Emotional Expression task. The order of the two tasks was counterbalanced across participants. After completing the experimental measures, participants completed the STAIC. There were short breaks between the experimental tests. Reading age and color blindness were tested prior to the experiment.
For the Stroop task, participants were required to name the color of each word as quickly and as accurately as possible. They were told, “As already mentioned in class, this study is looking at the speed and accuracy of print-color naming. You will be asked to name the color of the words printed on the four cards, as quickly and accurately as possible. Please pay no attention to the content of the words, simply say out loud the color of the ink in which they are printed. Each task will be timed. Here is a practice card so that you can familiarize yourself with the task.” The time taken to identify each Stroop card was recorded using a stopwatch. This measure combined speed of responding with accuracy (Mathews & MacLeod, 1985).
For the face task, participants were told the following: “You will see some faces on the screen in front of you. Each face appears on its own, and your job is to decide if it's a happy or angry face. If it's happy, then press the key marked ‘happy,’ and if it's angry, then press the key marked ‘angry.’ Please press the key as soon as you can, but try not to make too many mistakes. If you do press a key and wish that you had pressed the other one, it does not matter. Please ask if you are not sure what to do.” In this task each trial began with a fixation cross that was presented in the centre of the screen for 2 s. A face then appeared in the center of the screen and remained there until the child made a response. Both reaction times (RTs) and accuracy were recorded with each response.
Finally, the state and trait anxiety questionnaires were completed following the STAIC instructions. For the state anxiety questionnaire participants were introduced to the scale and were asked to “find the word or phrase which best describes how you feel right now.” For the trait anxiety they were told, “choose the word which seems to describe how you usually feel.”
Results
Participant characteristics
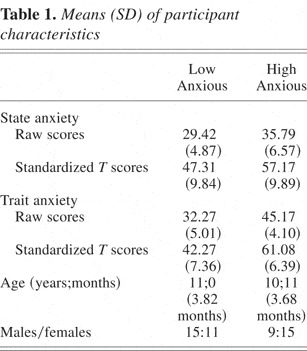
The mean state anxiety score for the group was 32.48 (SD = 6.53) with a range of 20 to 48, and the mean trait anxiety score for the group was 38.46 (SD = 7.94) with a range of 23 to 53. State anxiety was positively correlated with trait anxiety (r = .64, p < .001). These scores were standardized prior to ranking using published age and gender norm tables (Spielberger, 1973). Children were split at the median standardized trait anxiety score (T scores) into high- and low-anxious groups. When the groups were split on the basis of their raw trait anxiety scores, the pattern of results was the same as when they were split on the basis of their standardized scores. For the low anxious group the mean standardized trait anxiety score was 42.27 (N = 26, SD = 7.36). For the high anxiety group, the mean trait anxiety score was 61.08 (N = 24, SD = 6.39).
A series of t tests revealed that the high- and low-anxiety group did not differ in age, t (48) = .43, ns. See Table 1 for details of participant characteristics. No participants were excluded from any of the analyses.
Means (SD) of participant characteristics

Modified Stroop task performance
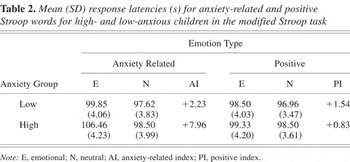
To explore whether the high-anxiety group showed greater interference than the low-anxiety group when color naming anxiety-related words a 2 (Anxiety Group: high- vs. low-anxious) × 2 (Emotion Type: anxiety-related vs. positive) × 2 (Emotionality: emotional vs. matched-neutral control) analysis of variance (ANOVA) was performed on the response latencies on the Stroop task (see Table 2 for means).
Mean (SD) response latencies (s) for anxiety-related and positive Stroop words for high- and low-anxious children in the modified Stroop task

This analysis showed that mean response latencies was significantly longer to emotional words (101.03 s) than to neutral words (97.90 s), F (1, 46) = 22.16, p < .001, ηp2 = .32 . This emotionality effect interacted with emotion type, F (1, 46) = 9.57, p = .003, ηp2 =.17, showing that responses to anxiety-related words and to matched neutral control words (103.15 and 98.92 s, respectively) differed more than positive and matched neutral control words (98.06 and 97.73 s, respectively). However, of greater importance is the Anxiety Group × Emotion Type × Emotionality interaction, F (1, 48) = 6.48, p = .014, ηp2 = .12. Table 2 clearly shows that the high- and low-anxiety groups had similar latencies for the anxiety-matched neutral words (means of 98.50 and 97.62 s, respectively) but differed on the anxiety-related words (means of 106.46 and 99.85 s, respectively)
To investigate this interaction further, two interference indices were calculated. The anxiety interference index was calculated by subtracting the time taken to respond to the anxiety-matched neutral card from the time taken to respond to the anxiety-related card. The positive interference index was calculated in the same way using the positive and matched neutral Stroop card response latencies (see Table 2). Two comparisons were performed, one on each of the two interference indices. (These comparisons and later comparisons were performed using pooled error terms, see Howell, 1997). There was no difference between the high- and low-anxiety groups in positive interference, F (1, 96) = .15, ns, but the high-anxious group showed significantly more anger interference than the low-anxious group, F (1, 96) = 9.71, p < .001, ηp2 = .20.
Correlations between the anxiety interference and positive interference indices and the standardized trait and state anxiety scores were computed. The anxiety interference index was significantly correlated with standardized trait anxiety (r = .40, p = .004) and state anxiety (r = .42, p = .002), showing that as anxiety increased, so did the degree of Stroop interference. Positive interference failed to correlate significantly with standardized trait or state anxiety.
Emotional expression task
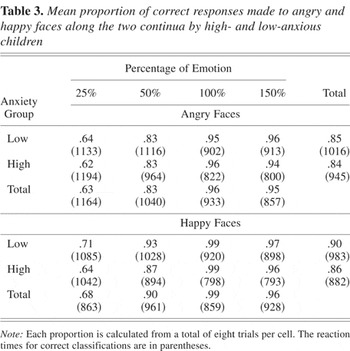
To examine the prediction that the high-anxious individuals would classify more of the faces as expressing anger than the low-anxious group, an analysis of variance was performed on the number of “anger” responses made to anger-neutral faces (i.e., correct classifications) and happy-neutral faces (i.e., incorrect classifications). The analyses were not performed on the number of “happy” responses made because such an analysis would simply reflect the analysis of the “anger” responses. These data were proportions (out of a total of eight trials), and therefore an arcsine transformation was applied. However, means of proportion correct responses will be presented in Table 3 in their raw form for clarity. Table 3 contains mean RTs and proportion of angry classifications made to angry-neutral faces and proportion of happy responses made to the happy-neutral faces.
Mean proportion of correct responses made to angry and happy faces along the two continua by high- and low-anxious children

Data were analyzed using a 2 (Anxiety Group: high- vs. low-anxious) × 2 (Face: angry vs. happy) × 4 (Percentage: 25 vs. 50 vs. 100 vs. 150%) ANOVA. As expected, facial expressions containing anger were classified as “angry” significantly more often than happy faces (mean proportions of .841 and .167, respectively; F (1, 48) = 3187.23, p < .001, ηp2 = .98). This main effect interacted with percentage level, F (3, 144) = 227.16, p < .001, ηp2 = .83. However, of importance in the present investigation is the interaction between face, percentage and anxiety group, F (3, 144) = 3.02, p = .032, ηp2 = .06.
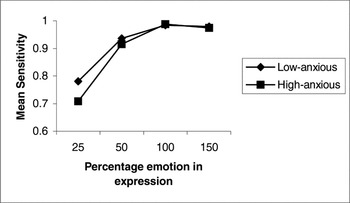
Separate analyses revealed that the high- and low-anxiety groups did not differ in the number of “anger” responses made to faces along the anger continuum, F (3, 144) = .06, but did differ in the number of erroneous “anger” responses made to faces along the happiness continuum, F (3, 144) = 3.59, p = .012. Four comparisons show that the high-anxious group made more incorrect “anger” responses than the low-anxiety group when faces contained 25% happiness, F (1, 95) = 5.53, p < .05, but the two groups did not differ at the 50, 100, or 150% levels (Fs < 2). These data suggest that children with high anxiety have difficulty discriminating emotions in emotionally subtle faces.
The proportion of incorrect “anger” responses made to the less emotionally intense happy expressions (25% happy–75% neutral and 50% happy–50% neutral) was calculated and correlated with standardized trait anxiety. As might be expected on the basis of the preceding analysis of the high- and low-trait anxiety group, this analysis revealed a significant correlation, showing that as trait anxiety increases, so does the number of errors made in the classification of subtle happy expressions (r = .29, p = .048). There is a similar, but nonsignificant, correlation between standardized state anxiety and the number of errors made (r = .24, p = .092).
It is not possible to conclude from the present design that happy faces classified as “angry” were actually perceived to be “angry” as opposed to simply “not happy.” For this comparison to be made, additional responses would need to be allowed (i.e., “not happy” and “not angry”). However, analyses of nonparametric measures of sensitivity and response bias (see Snodgrass & Corwin, 1988), using the proportion of anger responses made to a face containing anger as “hits” and the number of anger responses made to faces not containing anger as “misses,” suggested that the low-anxious group showed significant sensitivity for anger overall, F (1, 48) = 4.07, p = .049, ηp2 = .08. This main effect interacted with percentage of anger in the face, F (3, 144) = 3.08, p = .032, ηp2 = .06; see Figure 2. Further analyses revealed that the low anxious group were significantly more sensitive to anger at the 25% level, F (1, 187) = 12.67, p < .001, but not at the higher levels (Fs < 1), showing that the difference between the two groups was greater at the lower percentage levels than the highest. An analysis of response bias revealed no significant effects.

Mean sensitivity scores for facial expression data for high- and low-anxious groups.
Finally, an analysis of the RTs for correct responses to angry-neutral and happy-neutral faces was performed, using the same factors as outlined above. Responses to angry faces were significantly slower than those to happy faces, means of 1000 and 913 ms, respectively; F (1, 48) = 12.16, p = .001, and RTs to faces with subtle emotions were longer than those when the faces contained strong emotion, F (3, 144) = 54.51, p < .001. There was also an interaction between these two factors, F (3, 144) = 6.01, p = .001, showing a greater decrease in RTs to happy faces as the percentage of emotion increased from 25 to 150% compared to angry faces (means of 1109 and 905 ms for angry faces and 1118 and 797 ms for happy faces). However, of more importance is the fact that there were no main or interaction effects involving anxiety group, suggesting that there was not a speed-accuracy trade-off on this task. Such a finding is more consistent with an effect involving discrimination rather than a response bias.
Comparison of modified Stroop and emotional expression tasks
To explore whether scores on the emotional Stroop task were correlated with scores on the emotional expression task, two correlations were performed. From the ANOVA, it appears that the high- and low-anxiety groups differed in their responses to the less intense happy faces, by failing to detect the correct emotion (i.e., responding “anger” when they should respond “happy”), and so the combined number of “anger” responses made to the two happy faces (25 and 50% happy) was calculated and correlated with the anxiety interference and positive interference indices from the Stroop task. As expected, given the analysis of the high- and low-anxious groups' responses outlined above, there was a significant correlation between the anxiety interference index and the number of “anger” responses made to less intense happy faces (r = .382, p = .006) showing that as anxiety-related Stroop interference increased, there was a corresponding increase in the proportion of incorrect “anger” responses made to the more subtle happy expressions. There was no correlation between the emotional expression index and positive interference index.
Discussion
This study employed a modified Stroop task and a facial expression task to investigate the effect of self-report anxiety on RTs for identifying the color of anxiety-related words and accuracy of interpreting facial expressions. These two tasks have produced some intriguing results. Task 1 demonstrated the predicted emotional Stroop interference effect, with high-anxious 11-year-old children showing greater threat-related interference than the low-anxious individuals on anxiety-related words. Both state and trait anxiety appeared to play a role in this bias. These results are consistent with previous studies that highlight an attentional bias to threat in anxious children (Martin et al., 1992; Martin & Cole, 2000; Moradi et al., 1999). These results are very similar to those obtained in the adolescent and adult literature. For example, using a very similar methodology, Richards et al. (2000) presented 17- and 18-year-old individuals with threat-related and neutral Stroop cards, and observed effects that mirror those obtained in the current study. Richards et al. (2000) found interference effects for high- and low-anxiety groups of +8.30 and +2.21 s, respectively, and overall a significant correlation between anxiety and negative Stroop interference of +.42. In the current study, the comparable interference effects for the high- and low-anxiety groups are +7.96 and +2.23 s, respectively, and the correlation is +.40. These comparisons offer support for the integral bias hypothesis, suggesting that the bias here is of a similar magnitude to that obtained in adults.
In Task 2 high-anxious 11-year-old children had more difficulty than the low-anxious children, discriminating happy from angry expressions when the happy expressions contained low levels of emotion (i.e., 25%).
In line with Richards et al. (2003), trait anxiety was found to correlate significantly with performance on the facial expression task, whereas state anxiety failed to do so. Trait anxiety was significantly correlated with the number of anger responses correctly identified, and although state anxiety produced a correlation in the same direction, its magnitude was less than that of trait anxiety and was nonsignificant. These two coefficients were, however, very similar, and did not differ significantly from each other. It is therefore difficult to come to any firm conclusions over the relative importance of state and trait anxiety in the discrimination of angry from happy faces, and further research is necessary.
The findings from the facial expression task indicating lack of discrimination sensitivity are not consistent with findings from the adult literature. Studies with adults using a similar paradigm have shown that anxious individuals will classify threat-neutral facial expressions as threatening. Richards et al. (2002) demonstrated that high-anxious individuals were more able to discriminate anger from happiness at all percentage levels. The current experiment found, however, that the high-anxious group was less able to discriminate anger from happiness than the low-anxious group. On the face of it, these findings do not support any of the models outlined in the introduction. The inferred bias hypothesis proposes that cognitive effects of emotion are not inherent consequences of that emotion but arise as a result of learning and would therefore predict a small increase in the ability to discriminate anger from happiness in the high-anxious group relative to the low-anxious group. In fact, a null effect would also not be inconsistent with this hypothesis. The integral bias hypothesis would predict enhanced discriminability for anger in the high-anxious group, and the developmental inhibition hypothesis would predict that both groups would display enhanced sensitivity for anger.
There are, however, several differences between the current study and that of Richards et al., making any conclusions tentative. These changes were made in order to make the study feasible with a child sample. First, each face in Richards et al.'s (20003) study was preceded by a word prime, whereas no words were presented in the current study. Second, the face appeared for only 200 ms, whereas in the current study the face remained on the screen until a response was made. Third, there were 168 trials, whereas they were only 64 in the current study. Fourth, there were seven models, whereas there were eight in the current study. Fifth, the classifications of adult faces by adults may differ from classifications of adult faces by children. It might be the case that the Ekman and Friesen (1976) neutral faces are perceived by children, particularly anxious children, as being unfriendly. If this were the case, then the subtle faces that contain more neutral emotion will simply be classified as “angry” rather than “happy.” None of the theoretical accounts can explain this switch from the high-anxious being relatively less discriminating of anger and happiness during childhood at subtle levels of emotion, to becoming relatively more discriminating in adulthood compared to their nonanxious counterparts. This interpretation is suggested by trends in the data, and studies need to be performed to examine performance of children and adults in the same study.
It appears that the high- and low-anxious 11-year-old children correctly identify similar levels of anger along the anger continuum, but that the high-anxious 11-year-olds are erroneously identifying anger, or failing to identify happiness, along the happiness continuum. When there are low levels of happiness in the faces, the high-anxious children appear to misidentify the emotion as being an angry one or perhaps a not-happy one. This could be interpreted as the high-anxious 11-year-old children processing facial expressions less efficiently, particularly in the processing of happy expressions. Alternatively, the high-anxious children may be more likely to classify mildly happy expressions as threatening as they require stronger signals of happiness to perceive a positive image. This failure to discriminate anger from happiness does not appear to be due simply to an increase in task difficulty. We found no evidence that the groups differed in their RTs to the different faces, indicating that it is unlikely that the effect involves a response bias.
Anxious children may experience a more negative social world than nonanxious children because of their tendency to misinterpret lower levels of happiness in a negative manner. The results of the Stroop task suggest that anxiety might also be related to an inability to inhibit negative information, as indexed by the increase in interference with increasing levels of anxiety. The stimuli used in the Stroop task are emotionally unambiguous, whereas the significant effects in the emotion expression task are related to emotionally subtle stimuli that are perhaps more ambiguous. At the higher levels of emotion when the emotion exemplars (100%) and the emotion caricatures (150%) are presented, the high-anxious 11-year-olds have no difficulty discriminating the two emotions. The high-anxious group are not significantly different from the low-anxious 11-year-olds at this top end of the continuum (i.e., means for anger-neutral faces of 909 and 908 ms, respectively).
There is an alternative interpretation of these data. If it were the case that the development of the face processing system was dependent on exposure to exemplars of different emotional expressions, then the failure of the high-anxious children may be a reflection of a delay in the emergence of the face processing system. There is evidence that social phobia in adults is associated with a tendency to avoid facial features (Horley, Williams, Gonsalvez, & Gordon, 2003). If it is the case that socially anxious children, like adults, avoid faces, then this might result in a modest delay in the development of the face processing system in these children. As a consequence of this, the fine-grained discriminations that are required at the lower levels of the emotion continua would be impaired in the anxious children. The faces containing large proportions of emotions are easy to discriminate, and this finding is not inconsistent with the delayed emergence hypothesis. However, such an account might predict that problems might show up more on angry than happy faces. This speculative account of our data needs further investigation. There is some support for this idea from a longitudinal magnetic resonance imaging study by Giedd et al. (1999). They demonstrated that although there are linear increases in the development of white matter during childhood, there were nonlinear changes in the development of cortical gray matter right through adolescence. A preadolescent increase in the development of cortical gray matter was followed by a decrease at postadolescence. Giedd et al. (1999) found that the developmental curves for frontal and parietal lobes peaked at around 12 years, whereas the temporal lobe peaked at around 16 years, and the occipital lobes continued developing through 20 years of age. Given the importance of these areas in face processing, the notion that there are changes in the processing of emotional expressions through childhood is highly plausible.
Conclusion
The current experiment highlights the importance of using converging methodologies in research. Using these two methodologies we have demonstrated differences in the processing of emotional information in anxious and nonanxious 11-year-old children. These findings strongly support the claim that these two divergent tasks utilize common cognitive processes. The high-anxious 11-year-olds find unambiguously negative stimuli more distracting than low-anxious 11-year-old children as shown in the Stroop task, but at the same time they are less able to discriminate emotionally subtle facial expressions. This failure to inhibit strong threat signals may be related to the inability to discriminate emotional expressions when the emotion signals are weak.
Appendix A