I. INTRODUCTION
Graphene has attracted significant worldwide interest since the optimization in 2003 of the mechanical exfoliation approach, in particular, to produce high quality samples. Reference Novoselov, Geim, Morozov, Jiang, Zhang, Dubonos, Grigorieval and Firsov1,2 Graphene possesses a number of remarkable properties, for example: it has extremely high mechanical strength, it conducts electricity via ballistic fermions, displays chiral quantum effects, and is a single layer zero band gap semiconductor. Reference Geim and Novoselov3 Graphene, therefore, has the potential to find use in a number of small and large scale applications. However, a significant challenge in the commercialization of graphene is that the material cannot yet be produced by a scalable process. Mechanical exfoliation, reduction of graphite oxide layers, and epitaxial growth on SiC wafers are all techniques which can produce high quality graphene, but these methods cannot be scaled up for bulk applications of this material. Chemical vapor deposition (CVD) processes can also form graphene, usually using copper or nickel substrates. Reference Geim and Novoselov3 However, CVD methods prohibit economically viable manufacturing of bulk graphene because they must typically use a foil or thin film as a growth substrate. If graphene can be synthesized utilizing commercially available catalyst particles, the cost of graphene could approach that of multiwalled carbon nanotubes. Nickel particles were previously utilized as a catalyst to grow graphene, but the process used micrometer (generally <30 µm)-sized particles. This resulted in large area graphene sheets, but overall yields were low. Reference Chen, Ren, Liu, Gao, Pei, Wu, Zhao and Cheng4 Copper and nickel are typically the catalytic metals of choice to grow graphene, Reference Losurdo, Giangregorio, Capezzuto and Bruno5–Reference Kim, Zhao, Jang, Lee, Kim, Kim, Ahn, Kim, Choi and Hong8 although iron has been widely used as a catalyst for the growth of related carbon nanostructures such as carbon nanotubes, and iron films have been shown to grow graphene. Reference Vinogradov, Zakharov, Kocevskil, Ruszl, Simonov, Eriksson, Mikkelsen, Lundgren, Vinogradov, Mårtensson and Preobrajenski9,Reference An, Lee and Jung10 If iron is used both as a matrix and catalyst to form metal–graphene nanocomposites, a number of structural applications become possible. This is because iron and steel have great intrinsic mechanical strength, especially when they have a particle size in the nanoscale regime. Reference Khan, Suh, Chen, Takacs and Zhang11 Iron also easily connects carbon structures that could form hierarchical architectures and arrays. Reference Goyal, Wiegand, Owens and Iqbal12–Reference Patel, Liu, Roy, Mitra, Dave and Iqbal15 However, since carbon is more soluble in iron than in copper, single layer graphene may be more difficult to grow on iron, but strong iron–carbon bonds would lead to high strength metal–graphene nanocomposites.
The CVD growth of graphene on spherical nanoparticles of transition metals would be unlikely to occur because this would typically result in the formation of amorphous carbon or carbon nanotubes. Reference Goyal, Wiegand, Owens and Iqbal12–Reference Patel, Liu, Eng and Iqbal16 Theoretically, there are two possible pathways for the formation of graphene on spherical nanoparticles. One is a ‘flower’-based model, and the other is a ‘wall’-based model. The flower-based model would involve layers of carbon encircling the iron catalyst particles, and once a critical point in the deposition is reached, they would fold out as in a flower, where the petals are the graphene sheets. A wall-based model would have the graphene layers growing vertically on top of an iron particle to form ‘fins’. The wall-based model would lead to graphene with dimensions limited by the circumference of the nanoparticles, while the flower-based model would provide graphene limited in size by the surface area of the particles. The work to be discussed describes the growth of graphene on commercial nanoscale iron particles. Raman spectroscopy, in combination with scanning and transmission electron microscopy (TEM), is used to characterize the graphene produced and determine the likely model of growth on the spherical particles.
II. EXPERIMENTAL
The details of the experiments conducted are included in the supplemental materials. To summarize, 20 nm and 100 nm iron particles purchased from American Elements (Boston, MA) were exposed to temperatures of 800 °C at atmospheric pressure and a variety of carbon containing and inert gases in different combinations. Experiments varying the heating rate were also conducted. The products of these reactions were examined with Raman spectroscopy using 632.8 nm laser excitation, together with scanning electron microscopy (SEM), and TEM on selected samples. The most promising material from the different batches was purified using dilute nitric acid to remove the iron catalyst. The experimental parameters used for the CVD processes are given in Table I. Additionally, an attempt to synthesize an iron–graphene composite in situ was also performed in the same way as high strength iron–carbon nanotube composites were prepared, Reference Goyal, Wiegand, Owens and Iqbal12–Reference Patel, Liu, Eng and Iqbal16 though no increase in strength was observed.
CVD parameters for different graphene samples synthesized.

III. RESULTS AND DISCUSSION
The Raman spectra of graphene and graphite are well established. Reference Ferrari, Meyer, Scardaci, Casiraghi, Lazzeri, Mauri, Piscanec, Jiang, Novoselov, Roth and Geim17–Reference Matthews, Pimenta, Dresselhaus, Dresselhaus and Endo23 In the case of single layer graphene, the most prominent features with 514.5 nm excitation consist of the fundamental G line at 1582/cm, the G′ line near 2700/cm (it is also referred to as 2D because it is the first overtone of the D line), and the disorder D line near 1350/cm, which arises from the breathing mode of six carbon-atom ring defects. Reference Ferrari, Meyer, Scardaci, Casiraghi, Lazzeri, Mauri, Piscanec, Jiang, Novoselov, Roth and Geim17,Reference Ferrari and Basko18 The 632.8 nm excitation used here causes the G′ line and D line, which are both strongly dispersive, to shift down to 2660/cm from 2700/cm and to 1330/cm from 1350/cm with 514.5 nm excitation, respectively. The dispersive behavior of the D and G′ lines stems from a double-resonance Raman process. The D line is activated by defects, whereas the G′ line does not require defect activation and has high resonant peak intensity exceeding that of the G line in single layer graphene. A plot of the ratio of the integrated intensities of the G and G′ lines versus the number of graphene layers is given by Graf et al. Reference Graf, Molitor, Ensslin, Stampfer, Jungen, Hierold and Wirtz19 Single layer graphene has a single G′ line, and, as the number of layers increases up to 5, interlayer interactions lead to broadening as a result of splittings and upshift in frequency of the G′ line. Beyond 5 layers, the G′ line spectrum of graphene is the same as that of bulk graphite.
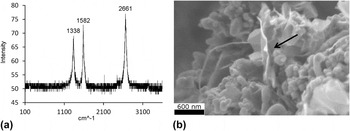
Raman and SEM analyses were performed to initially investigate which growth conditions provided the most promising samples under the different CVD parameters given in Table I. Figure 1(a) shows that sample A, prepared using 20 nm Fe particles, has a relatively high intensity D line at 1338/cm activated by defects, and a sharp single G′ line at 2661/cm, which is of greater intensity than the G line at 1582/cm. The approximate integrated intensity ratio of 0.43 for the G and G′ lines corresponds to about 2–3 layer graphene. The SEM image in Fig. 1(b) shows graphene sheets (arrowed) mixed with carbon covered catalyst particles. A small fraction of carbon nanotubes does form and is evident in the SEM image in Fig. 1(b).
(a) 632.8 nm laser excited Raman spectrum of sample A, the units in the abscissa are in 1/cm and the ordinate axis is the intensity in arbitrary units. (b) Typical SEM image of sample A, showing graphene sheets growing on catalyst particles. The edge of one such sheet is indicated by an arrow.

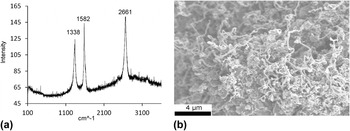
Sample B, prepared using a 100 nm catalyst, has a Raman spectrum similar to that of sample A, indicating that few layer graphene is present in the sample (Fig. 2). A broad scattering feature peaking at the position of a relatively sharp single G′ line is evident. This suggests the presence of a higher degree of disorder associated with graphene in this sample, although the intensity of the defect-activated D line is the same as in sample A. Figure 2(b), which shows a lower spatial resolution SEM image of sample B, indicates that a larger fraction of carbon nanotubes are formed compared with sample A. This is probably due to the larger catalyst size used in its synthesis. This suggests that smaller catalyst particle sizes would be needed for the more efficient growth of single layer graphene.
(a) 632.8 nm laser excited Raman spectrum of sample B, the units in the abscissa are in 1/cm and the ordinate axis is the intensity in arbitrary units. (b) SEM image of sample B, showing a larger fraction of carbon nanotubes compared with sample A.

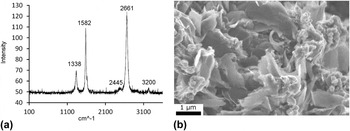
Samples C to F were prepared with the 20 nm catalyst using a faster heating rate of 33 °C/minute relative to the 10 °C/minute rates for samples A and B. Faster heating rates were expected to prevent the growth of the catalyst particles during the CVD process. Sample C was prepared without using argon as a carrier gas; samples D and E were the only ones prepared without acetylene and CO, respectively, in the carrier gas. The Raman spectrum of sample F is displayed in Fig. 3, whereas those for samples C, D, E, and H are in Fig. S2. (All S labeled figures are in the supplementary materials.) The Raman spectra of samples C and F show a D line at 1338/cm of lower intensity than those for samples A and B, indicating fewer defects. However, the Raman spectrum of sample C shows a line of medium strength at 667/cm, which suggests the formation of iron carbide. The Raman spectrum of sample F shows high quality, few layer graphene consistent with the SEM image in Fig. 3(b), which had a high concentration of graphene sheets. This sample was examined by TEM and the results are discussed below. The Raman spectrum of sample E, prepared without CO, still shows the formation of few layer graphene, hinting that the role of CO in graphene formation is not critical. Samples D and H do not show graphene growth based on the Raman data and SEM images. Intense Raman lines near 665/cm are likely to be associated with the formation of iron carbide, which would preclude the growth of graphene layers. This, in turn, would eliminate the G′ line, as observed in both samples. The absence of graphene and growth of iron carbide in samples D and H are likely to be due to the lack of acetylene (which decomposes to carbon at 800 °C) during the growth of sample D and sample H.
(a) Raman spectra from sample F, the units in the abscissa are in 1/cm and the ordinate axis is the intensity in arbitrary units. (b) SEM image of sample F, displaying extensive growth of a large number of graphene sheets on the surface of the particles.

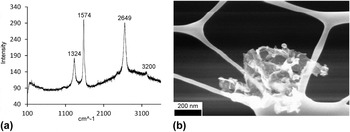
Sample F was purified with nitric acid to demonstrate that the metal can be removed, leaving pure graphene, which is sample G (Figs. 4 and 5). The Raman spectrum, however, shows some broadening of the G′ line and the appearance of a broad background due to disorder in the graphene structure. This indicates the purification process may cause some functionalization of the structure of graphene, while inducing disorder.
(a) 632.8 nm laser excited Raman spectrum of acid purified sample G, the units in the abscissa are in 1/cm and the ordinate axis is the intensity in arbitrary units. (b) SEM image from sample G placed on a TEM grid.

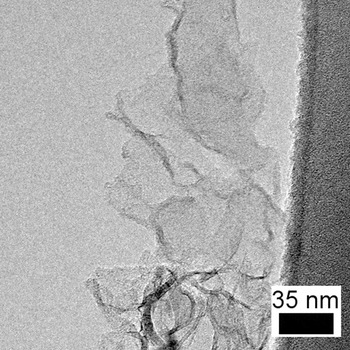
TEM image of graphene with few layers forming a stack.

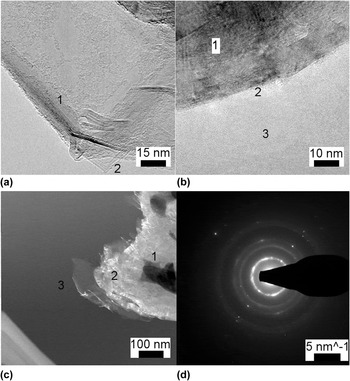
TEM was performed on sample F, which showed clear evidence for extensive growth of graphene. Note the presence of facets and folds in Fig. 6(a). Diffraction analysis shows that it is indeed few layer graphene, because the layer spacing is ≈3.4 Å and six-fold symmetry is evident. In Fig. 6(b), an image of the ‘interface’ between an iron catalyst and the graphene is given. The existence of the interface is critical for the determination of the growth mechanism of the graphene. Whether the graphene is actually bonded to the iron, or is just on top or below it is unclear from the image. A ‘wall’ model graphene sample would have a number of interfaces, while a flower model graphene sample would have very few if any (only forming after the initial growth of the graphene). A high degree of order is evident in the image, so atomic spacings can be resolved. Scanning TEM imaging was performed, combined with electron energy loss spectroscopy and energy dispersive x-ray analysis. This revealed that the darkest spots in the scanning TEM image were clusters of iron catalyst, which had carbon surrounding them. Toward the end of each of the layered carbon clusters, graphene sheets could be found. The catalyst is darkened in the image due to Z contrast. As one moves away from the catalyst, the growth of more single layers is evident. The carbon seems to surround clusters of iron particles, and after a critical point is reached, the layer opens up to form few layer or single layer graphene.
(a) TEM image showing clear facets, which is an indication of the growth of graphene {1folds are evident, 2right angles indicating faceted growth}. (b) TEM image showing the catalyst-iron interface. Whether there is an actual connection, or if the iron particle is simply on top of the graphene or vice versa, is unclear {1iron catalyst, 2iron catalyst to graphene interface, 3graphene}. (c) Scanning TEM image of the sample. Note the contrast can be used to find the iron catalyst and also examine the relative thickness of the graphene {1iron catalyst, 2thick carbon, 3graphene}. (d) Diffraction pattern showing 0.34 nm spacing and possible six-fold symmetry, indicative of layered carbon formation.

One possible mechanism of growth could be that several of the iron catalyst particles are simultaneously surrounded by carbon layers which fold out. This is opposed to VLS (vapor-liquid-solid) models of carbon nanotube growth, where carbon would layer around each individual catalyst particle. Since a large number of particles are surrounded by graphene, the layers are under tension and have a tendency of opening up, forming flat, graphitic plates. This favors the flower based model of growth discussed in the introduction. The wall method of growth seems unlikely, as one would expect the graphene which grew in that method to have dimensions restricted by the size of the catalyst particle. In the wall model, because they would only grow on one particle at a time, at least one dimension of the sheet would be restricted to the circumference of the particle, which is approximately 63 nm on average for the 20 nm catalyst and 314 nm for the 100 nm catalyst, and this does not seem to be the case. Additional evidence for the flower model is the image in Fig. 6(c), which seems to be the material going through the ‘bulb’ phase into the ‘flowering’ phase. The folds found in various images, if real, further reinforce the flower model. The formation of graphene with folds in it would be more believable in a flower model than a wall model. Finally, the graphene infiltration failed to produce high strength composites. This would hint at the flower based model as the correct model. The interface, if real, found in Fig. 6(b) could be explained by the graphene forming initially through the flower model, and then diffusing into the iron later. A schematic depiction of the flower model is given in Fig. S3.
In conclusion, we have shown that few layer graphene can be grown using a relatively low temperature, scalable, and cost-effective CVD process and a commercially available catalyst nanopowder.
Supplementary Material
To view supplementary material for this article, please visit http://dx.doi.org/jmr.2014.165
ACKNOWLEDGMENT
This work was supported by the US Army, ARDEC under contract W15QKN-10-D-0503-0002 and performed in the Iqbal group at the Chemistry and Environmental Science Department of the New Jersey Institute of Technology. Reference Patel24 One of us (CY) was supported by CarboMet LLC.