


Introduction
Ice shelves account for 11% of the area and 2.5% of the ice volume of Antarctica (Reference Drewry and DrewryDrewry, 1983a). Mass-budget studies of the whole ice mass of Antarctica list estimates of calving that account for 80% of total mass output, with an assessed error that is larger than the net mass-budget estimate (e.g. Reference OrheimOrheim, 1985; Reference Jacobs, Hellmer, Doake, Jenkins and FrolichJacobs and others, 1992, Reference Jacobs, Hellmer and Jenkins1996). Estimates of calving normally include ice-shelf discharge across fixed reference peripheries, and the change in location of the ice-shelf front (barrier) of large ice shelves is one of many indicators of global change (e.g. SCAR/IGBP, 1989).
In this paper we summarize mean annual barrier motion estimates obtained from slant-range analysis of radar altimeter data (Reference Martin, Zwally, Brenner and BindschadlerMartin and others, 1983; Reference Thomas, Martin and ZwallyThomas and others, 1983; Reference Zwally, Stephenson, Bindschadler and ThomasZwally and others, 1987; Reference Stephenson and ZwallyStephenson and Zwally, 1989; Reference Zwally, Brenner and FuZwally and Brenner, 2001) selected from the Seasat, Geosat and European Remote-sensing Satellite-1 and -2 (ERS-1 and -2) databases covering diverse periods between 1978 and 1998, supplemented by barrier location maps produced elsewhere for 1977 and 1986. As described in the following section, our estimates are the lower limit either of seaward barrier motion or of barrier break-back (regression) for the observation periods because the method does not account for either calving or surge events smaller than the barrier motion. The ice shelves selected for our study comprise approximately three-quarters of the total ice-shelf area of Antarctica, drain approximately two-thirds of the total grounded ice area, and are representative of the two principal types of ice shelf (e.g. Reference GiovinettoGiovinetto, 1970) (Fig.1). Ice shelves of the first type lie in large embayments and are characterized by long distances between main segments of grounding line and barrier, as well as large areas of subglacial net melting and freezing. We include all three: the Filchner–Ronne,Amery and Ross Ice Shelves (FRIS, AIS and RIS, respectively), each ice shelf split in three lobes, each lobe corresponding to a different drainage system. Ice shelves of the second type lie either in relatively small embayments or in open water, and are characterized by relatively short distances between main segments of the grounding line and barrier, as well as subglacial net melting. We include those that lie in the Dronning MaudLand sector (DMLS), and the West and Shackleton Ice Shelves (WIS and SIS, respectively). For purposes of discussion, we created sectors by selecting prominent capes inland in the DMLS, and a major ice rise in the WIS, and projecting a line along their particular longitude toward the barrier (the capes and ice rise are clearly depicted in Figure 1). Ice-shelf lobes and sectors are designated western, central and eastern (W, C and E, respectively).
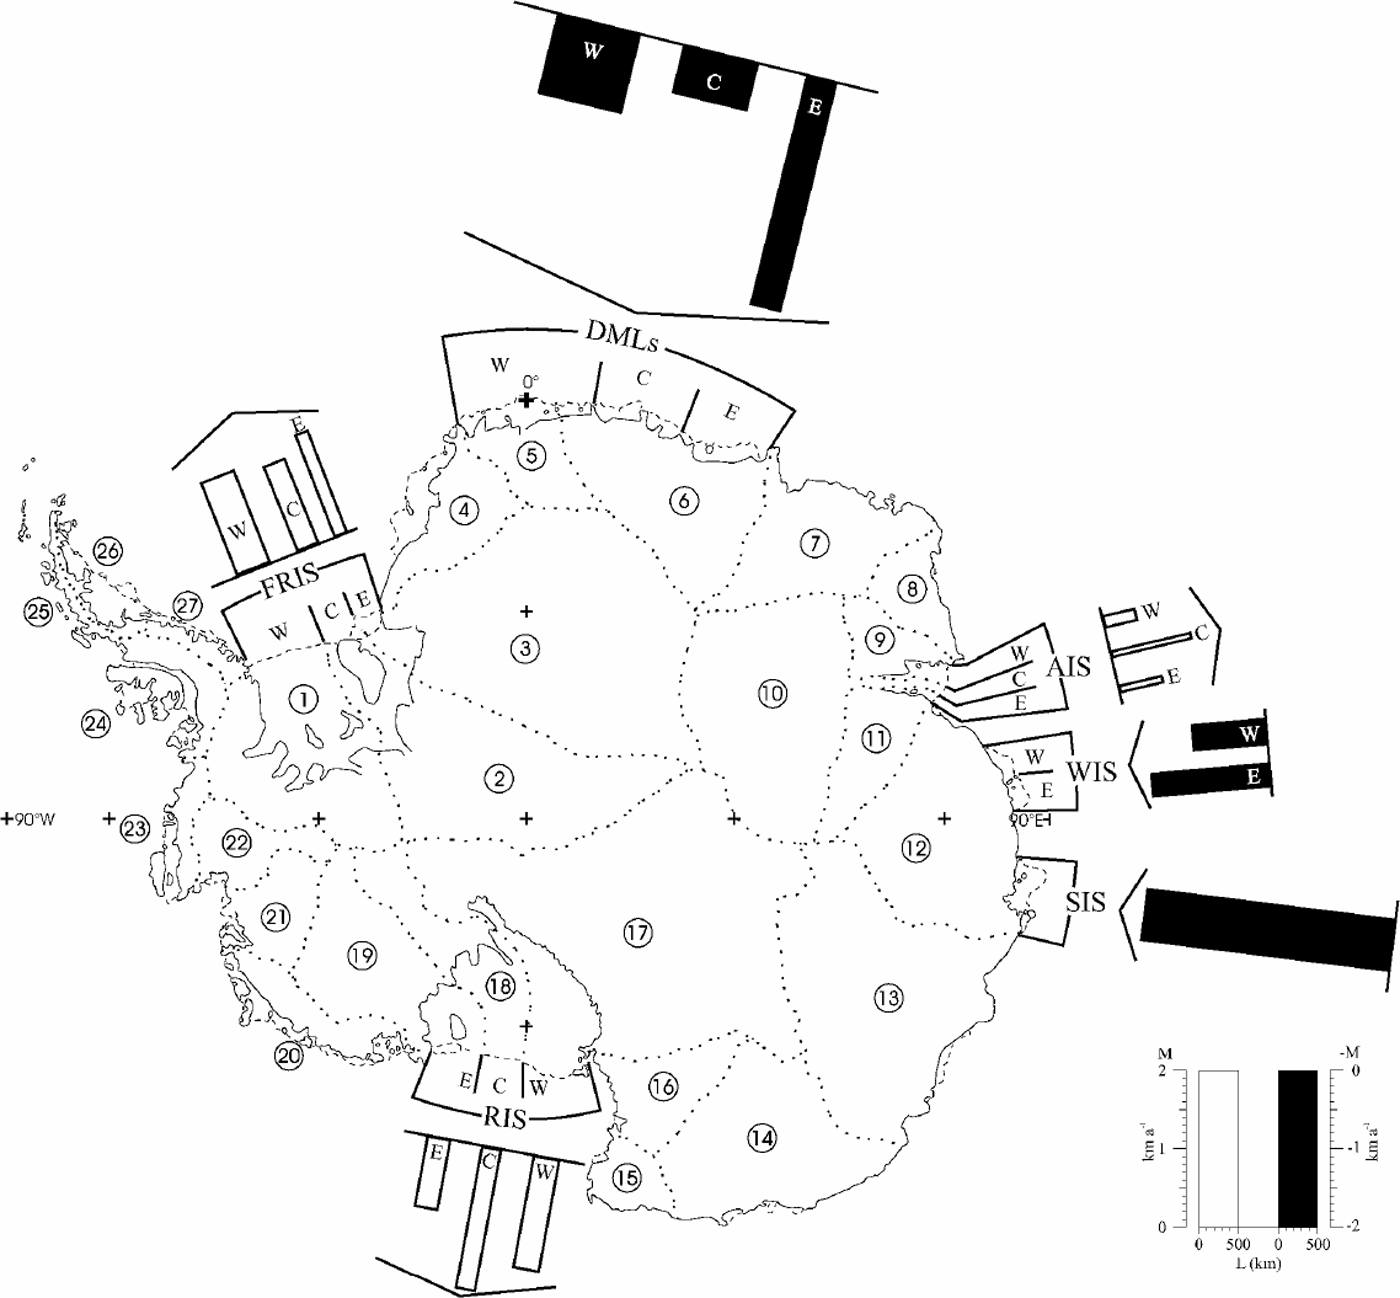
Barrier motion is estimated for the ice shelves that occupy large embayments (Filchner–Ronne, Amery and Ross Ice Shelves; FRIS, AIS and RIS, respectively), and some of the marginal ice shelves (in the Dronning Maud Land sector and the West and Shackleton Ice Shelves; DMLS, WIS and SIS, respectively). The ice-drainage divides (dotted lines) show the accumulation areas for the ice shelves (those for the WIS and SIS can be readily inferred from the layout of the divides in system 12). Other features: Roosevelt Island (RI), Berkner Island (BI), Cape Crozier (CC) on Ross Island.

Barrier Location
The slant-range analysis of radar altimeter data to compile barrier location is based on the short time (of the order of 1s) during which the radar altimeter that detects backscatter signals on a small surface-elevation range or window fails to adjust to an abrupt elevation change (Reference Martin, Zwally, Brenner and BindschadlerMartin and others, 1983; Reference Zwally, Brenner and FuZwally and Brenner, 2001). During this time the altimeter continues to detect the signals from a surface at the same level (e.g. from sea or sea ice in front of a barrier) but at an increasing range that is slanted backward (Reference Thomas, Martin and ZwallyThomas and others, 1983). In the reverse sequence, from ice shelf to ocean, the slant-range measurement continues backward to the higher ice-shelf elevation at the barrier
location that is closest to the satellite. The slant-range analysis produces a distinct V pattern of selected reflection points (Fig. 2) that is symmetrically distributed relative to the ground track (Reference Zwally, Stephenson, Bindschadler and ThomasZwally and others, 1987). This pattern, compiled for a series of orbits, is used to delineate the barrier location by manually joining the one arm of the V that best aligns with the orientation of the barrier as known from other satellite imagery, or surveys made from aircraft or ships. The approach cannot be applied to all barrier segments, particularly if they lie in sectors where the slant-range data distribution shows gaps of approximately 50 km or larger, or if total barrier length is approximately 50 km or less. The databases used in this study produced compilations of V patterns per 100 km of discharge periphery ranging from 29 for the WIS to 69 for the RIS. These average values varied widely for particular lobes or sectors, and databases, of any one ice shelf; some examples of poor coverage are mentioned further below.
The common V pattern selected reflecting points (center of each diamond) obtained from slant-range analysis of radar altimeter data is illustrated for a sector of the Ross Ice Shelf, central lobe (°W longitude). The center of each circle represents a selected reflection point. The barrier locations compiled from the ERS-1and -2 radar altimeter databases are shown relative to the location compiled from NOAA-6 imagery (Reference FerrignoFerrigno and others, 1996). The dates of the radar altimeter data are part of the compilation periods centered on 25 June 1992 (ERS-1) and 5May 1998 (ERS-2) mentioned in the text.

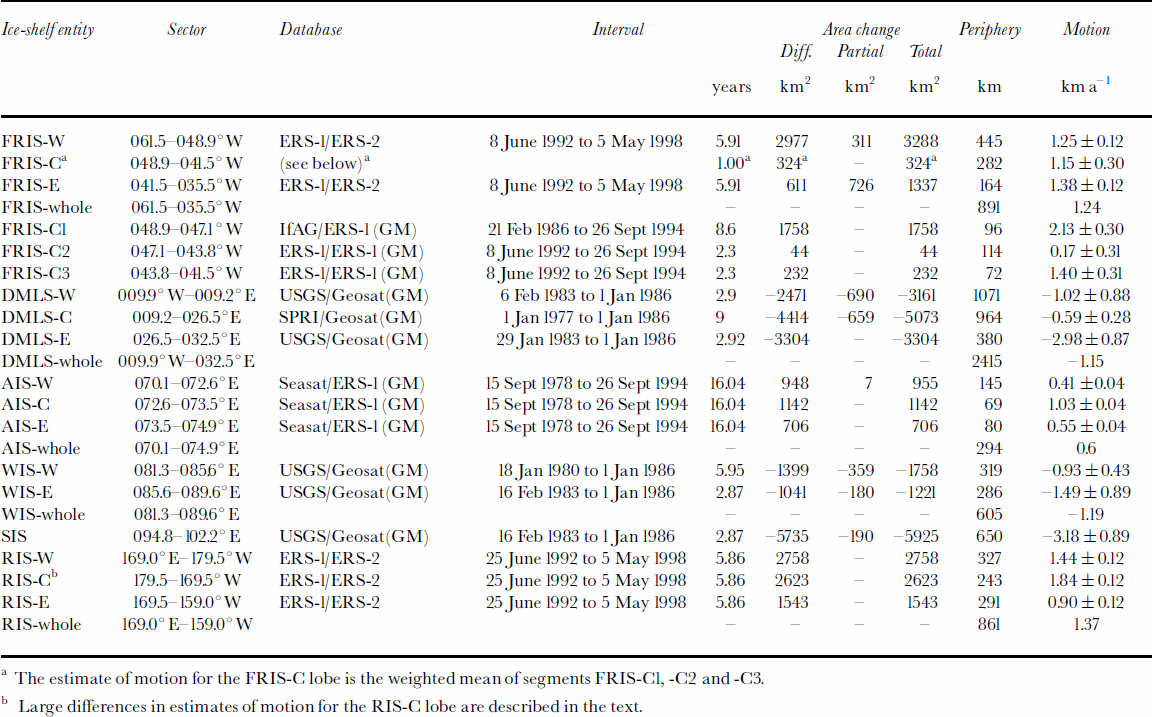
a The estimate of motion for the FRIS-C lobe is the weighted mean of segments FRIS-C1, -C2 and -C3.
b Large differences in estimates of motion for the RIS-C lobe are described in the text.
The procedure to delineate a barrier is relatively simple in sectors where barrier alignment is characteristically smooth as observed for long periods (e.g. sectors of the FRIS and RIS). The procedure becomes more difficult if barrier alignment is either characteristically uneven, or varies in relatively short periods, or both (e.g. sectors of the WIS and SIS). Where it is not possible to rely on the alignment of one arm consistent with the known orientation of a barrier, the barrier location is inferred by joining the vertices of V patterns. In these cases, there is a larger probability of erroneously including in the delineation one or more patterns produced by an iceberg lying close to the barrier, or ice-shelf features that are not the barrier (e.g. rifts and ice rises; Reference Stephenson and ZwallyStephenson and Zwally, 1989). Once completed, a particular barrier delineation is assigned the center date of the period between the first and last orbits used to compile V patterns.
In general, for each orbital path and altimeter waveform dataset used in the compilation, there are several other sets that were examined and discarded because the degraded waveforms were not suitable for analysis. A degraded waveform set is generally associated with a more oblique angle between orbital path and barrier alignment. Missing data result in longer distances between plotted V patterns and thus greater interpolation distance (the interpolation procedure is illustrated in Figure 2). However, a greater reliance on waveform sets associated with orbital paths in which the ground track approaches the barrier at or near a right angle significantly reduces the error in the determination of a barrier location. The error in the determination of a particular V pattern location decreases from ±1km to ±0.1km as the crossover angle is close to perpendicular (Reference Thomas, Martin and ZwallyThomas and others, 1983; Reference Zwally, Stephenson, Bindschadler and ThomasZwally and others, 1987; Reference Stephenson and ZwallyStephenson and Zwally, 1989).
Barrier Motion
Barrier motion (M, in kma–1) is estimated as the ratio between ice-shelf area change (D, in km2) determined for a particular interval (T, in years), and the length of the discharge periphery (L, in km):

In Figure 3 it is shown that the length of the discharge periphery is measured along a smooth line traced between the two delineated barrier locations. If D is a positive number (Fig. 3a), M (> 0) is the lower limit of barrier motion seaward because calving events smaller than the area change in particular sectors are not detected. If Dis a negative number (Fig. 3b), M (<0) is the lower limit of barrier regression (break-back) because seaward barrier motion smaller than the area change in particular sectors (e.g. due to prior surges of outlet glaciers or ice streams) is not detected.
Estimate of barrier motion based on the difference in ice-shelf area (D) for an interval defined by onset and closing dates (Equation (1)). The discharge periphery is delineated as a smooth trace between barrier locations at the onset and closing dates for the interval (length L). As described in the text, the estimates of barrier motion do not account for all possible calving and surge events. (a) Minimum rate of barrier motion seaward, where –d indicates the minimum detected area of calving (Equation (2)). (b) Minimum break-back rate (barrier regresses landward), where d indicates the minimum detected barrier motion seaward (Equation (3)).
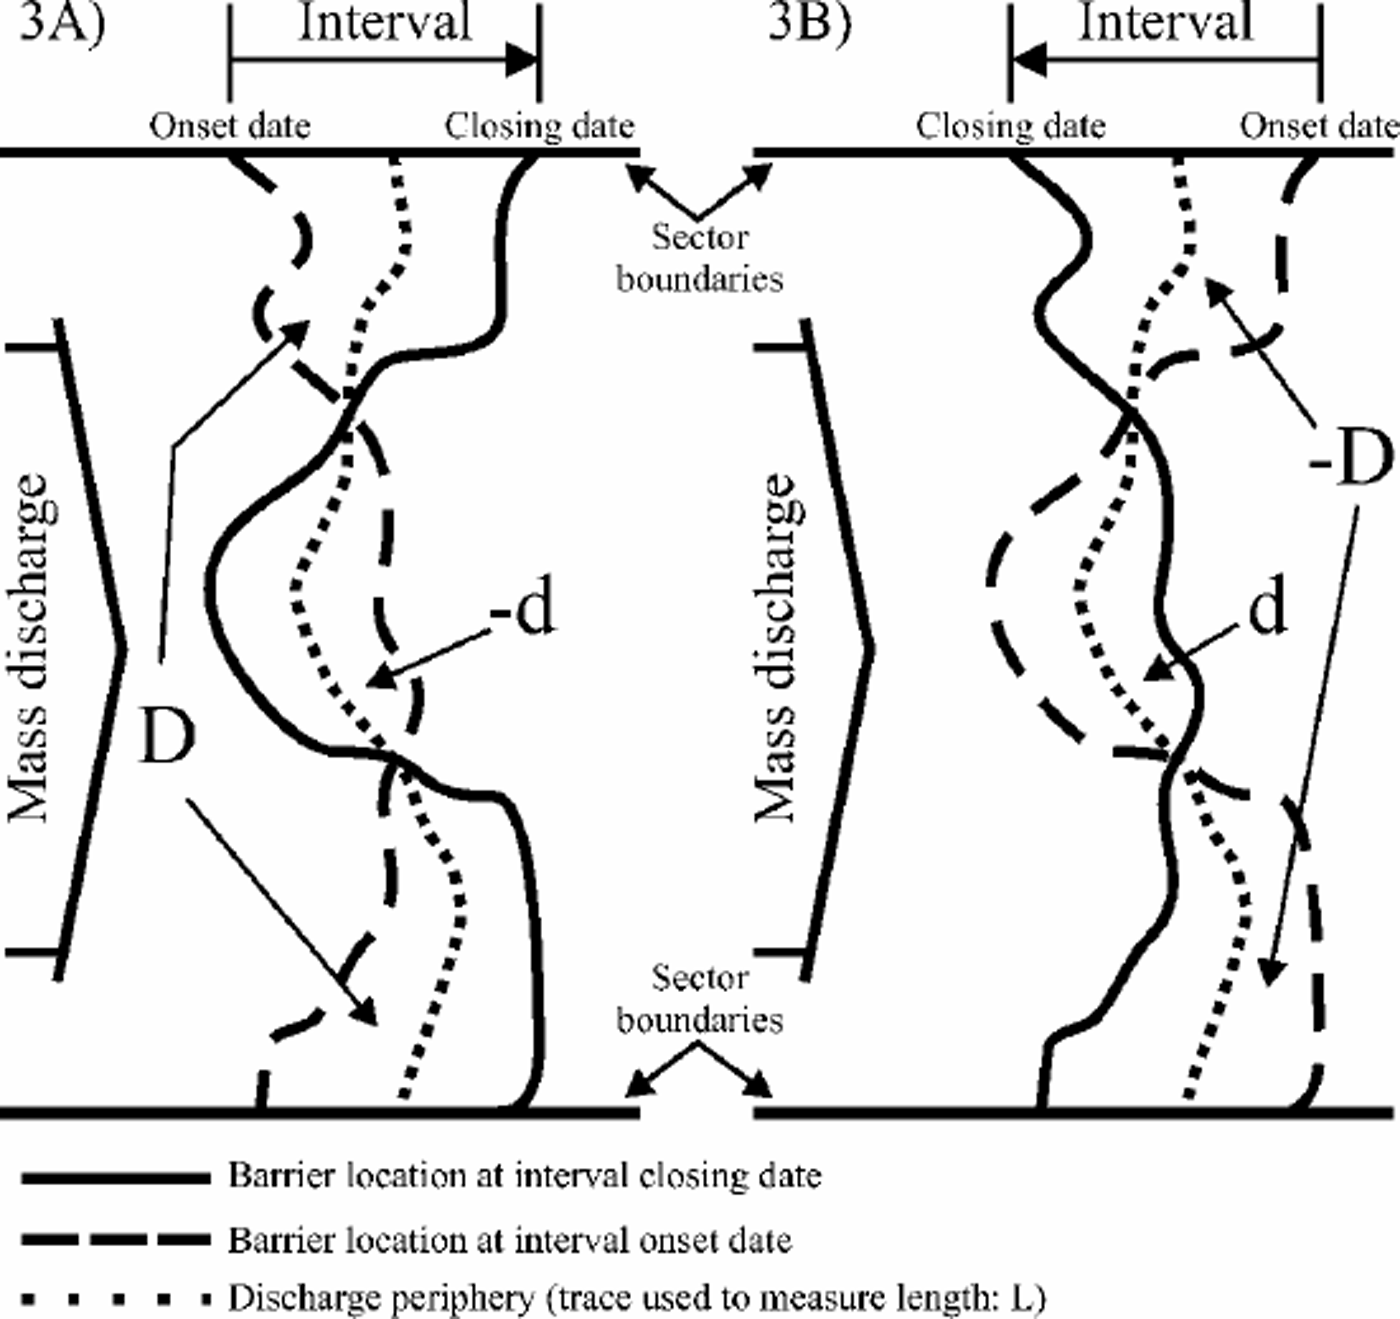
Any fortuitous detection of calving (Fig. 3a) where the delineation of the barrier for the interval closing date lies landward of the delineation for the interval onset date generates a partial area of negative value (–d, in km2) that is factored by 1and added to D:

The estimate of M remains a lower-limit estimate because –d is a measure of minimum detected calving. Similarly, any fortuitous detection of seaward barrier motion greater than the break-back rate (Fig. 3b) causes the delineation of the barrier for the interval closing date to lie seaward of the delineation for the interval onset date, generating a partial area of positive value (d, in km2) that is factored by –1 and added to –D:

The estimate of M remains a lower-limit estimate because d is a measure of minimum detected seaward motion.
Data Compilation And Analysis
Selection of ice shelves, ice-shelf sectors and barrier segments
The data on barrier motion corresponding to the FRIS, AIS and RIS are compiled for lobes that correspond to separate drainage systems (Table1; Fig. 4). The criteria for the selection of drainage divides will be discussed in detail elsewhere; however, there are several aspects that provide a perspective to the findings listed further below. Principally, it should be noted that the new divide pattern is only broadly similar to that discussed in prior studies (Reference Giovinetto and BentleyGiovinetto and Bentley, 1985; Reference Bentley, Giovinetto, Weller, Wilson and SeverinBentley and Giovinetto, 1991; Reference Vaughan, Bamber, Giovinetto, Russell and CooperVaughan and others, 1999; Reference Giovinetto and ZwallyGiovinetto and Zwally, 2000). The new pattern is based on the ERS-1 radar altimeter database transformed in a 5 km grid format listing maximum surface slope gradient and orientation (Reference Zwally, Brenner and FuZwally and Brenner, 2001). Southward of 81.5˚ S (outside ERS-1 and -2 radar altimeter coverage) the grid was extended using a digital elevation model (Reference Bamber and HuybrechtsBamber and Huybrechts, 1996) based on the Scott Polar Research Institute (SPRI) map (Reference Drewry and DrewryDrewry, 1983b). The pattern separates ice-shelf flow in the FRIS and RIS by provenance regions. The ice flow that originates exclusively in West Antarctica (drainagesystems 1,18 and 19) is separated from the ice-shelf flow that originates in part as land ice in East Antarctica (systems 2, 3 and 17).
Schematic representation of barrier-motion estimates listed in Table 1. Clear bars indicate minimum mean barrier motion seaward; solid bars indicate minimum mean break-back (barrier location regresses landward). AIS (Reference Hambrey and DowdeswellHambrey and Dowdeswell, 1994) and RIS (Reference Thomas, MacAyeal, Eilers, Gaylord, Hayes and BentleyThomas and others, 1984; Reference Fahnestock, Scambos, Bindschadler and KvaranFahnestock and others, 2000). The new divides do not coincide with the ridges of Berkner Island (BI, in system 2) and of Roosevelt Island (RI, in system 19), and the coastal endpoint of the divide between systems 16 and 17 has been shifted from Cape Crozier (CC) in Ross Island to the northernmost point on Brown Peninsula (77.78˚ S, 165.6°E).
Summary of minimum barrier-motion estimates
Splitting the ice flow of the FRIS and RIS in the context of land-ice provenance requires further analysis of the delineation of divides southward of ERS-1 and -2 radar altimeter coverage, particularly segments of divides on the grounded ice sheet between systems 1-2-3 and 17-18-19. Other aspects and features of the divide pattern require more study. For example, ice flow from the area of subglacial Lake Vostok (centered at approximately 77˚ S, 105°E; cf. Reference Zwally, Brenner and FuZwally and Brenner, 2001) is shown in Figure 1 as part of system 17, although flowline patterns derived from the RADARSAT database (personal communication from K. C. Jezek, 2001) show it as part of system 13. The delineation of divides was extended on ice shelves following ice-flow boundaries selected from compilations for the FRIS (Reference Swithinbank, Brunk and SieversSwithinbank and others,1987),
Because radar altimeter data are not reliable in the narrow coastal zone characterized by complex topography and steep slope gradient, the divides were extended to the coastline of the grounded ice sheet based on surface topography maps (Reference Drewry and DrewryDrewry, 1983b; Reference FerrignoFerrigno and others, 1996). Most grounding lines and junction points (where the coastline, grounding line and barrier adjoin) used as guides for some divides were those compiled in a separate map (Reference SwithinbankSwithinbank, 1988). We introduced a few changes due to large-scale calving (e.g. the divide between systems 12 and 13 was shifted west-wardby approximately 3˚ of longitude due to large-scale calving in the SIS). Lastly, system 10 now includes the three major glacier basins in the interior, i.e. the basin area of Fisher Glacier, formerly part of system 9, is joined to the Mellor and Lambert Glacier basins.
FRIS
The bulk of the slant-range data correspond to the FRIS-W and -E lobes using ERS-1 and -2 databases covering an interval of 5.91 years between 8 June 1992 and 5 May 1998. The FRIS-C lobe presents a special case because ice flow is split by Berkner Island, and it was necessary to consider three separate barrier segments designated C1–C3, from west to east, respectively. For the FRIS-C1 segment we used the delineation based on the ERS-1 database selecting orbital sets from its Geodetic Mission (GM) phase centered on 26 September 1994. We could not produce any other reliable delineation based on slant-range analysis, and therefore compared it with the barrier location shown in a map from the Institut für Angewandte Geodäsie (IfAG) compiled using the Landsat-5 Multispectral Scanner database centered on 21 February 1986, supplemented by information from the Earth Observation Satellite (EOSAT) database (Reference Swithinbank, Brunk and SieversSwithinbank and others, 1987). We were able to produce delineations for the central and eastern segments (FRIS-C2 and -C3) using the ERS-1 and ERS-1(GM) databases centered on 8 June 1992 and 26 September 1994, respectively.
The findings for the FRIS indicate a mean motion of 1.24 kma–1 along a discharge periphery of 891 km, the mean for each lobe showing small differences from the overall mean, i.e. the M values for the FRIS-W, -C and -E are 1.25, 1.15 and 1.38 kma–1. The largest difference in M values is found between barrier segments of distinct physiographic characteristics within FRIS-C. In this lobe with a discharge periphery of 282 km, the M value for segment C1 is 2.13 kma–1 along 96 km or 34% of the total periphery, and for segment C2 is 0.17 kma–1 along 114 km or 40% of the total periphery. A difference by a factor of 12.5 is not surprising, as segment C1 is the discharge periphery for flow that includes the input from at least the western and central parts of the Foundation Ice Stream basin (assuming that flow from the eastern part of the basin might be eastward of Berkner Island as suggested by detailed surface topography (cf. Reference SieversSievers and others, 1993)), while segment C2 is the drainage periphery for the northern sector of the ice cap on Berkner Island. The M value for segment C3 is 1.40 kma–1 along 72 km or 26% of the total periphery for the lobe.
As an example of the caution to be exercised in using the data for the FRIS and all other ice shelves included in this study, a major calving event (approximately 8200 km2) was recorded in 2000–05 by NOAA-14 along the westernmost 340 km of the FRIS-W periphery, with the maximum distance between the former and new barrier (break line) being slightly over 40 km in some sectors.
Ice shelves of the DMLS
We produced a single barrier delineation for the DMLS using the Geosat(GM) database centered on 1 January 1986, and compared it with barrier locations shown in maps printed by the United States Geological Survey (USGS; Reference FerrignoFerrigno and others, 1996) for subsectors DMLS-W and -E, and by SPRI (Reference Drewry and DrewryDrewry, 1983b) for DMLS-C. The USGS compilation for DMLS-Wis based mainly on U.S. National Oceanic and Atmospheric Administration NOAA-7 imagery obtained on 6 February 1983, supplemented by imagery from NOAA-12 obtained on 29 January 1983 for a small part of the westernmost sector (006.1–003.5°W). We dated the barrier mapping for the whole subsector at 6 February 1983 and assigned an interval of 2.90 years. The USGS compilation for DMLS-E is based on NOAA-7 imagery obtained on 29 January 1983, and we assigned an interval of 2.92 years. The SPRI compilation for DMLS-C is based on a report from ship and aircraft surveys completed summer 1976/77 (Reference Cooper, Drewry, Jordan and DrewryCooper and others, 1983), and we assigned an interval of 9.00 years.
The findings for the DMLS indicate a mean motion of –1.15 kma–1 along a discharge periphery of 2415 km, an over-allmeanmatched by the Mvalue for DMLS-W(–1.02 kma–1 along a periphery of 1071 km) but not in subsectors DMLS-C and -E (the M values are –0.59 kma–1 over a periphery of 964 km, and –2.98 kma–1 over a periphery of 380 km, respectively). In part, the larger break-back rate in DMLS-E might be explained by the larger land-ice discharge expected from the eastern area of system 6 which extends farther inland than the western area of the system because the difference in mean net accumulation at the surface is small (e.g. Reference Giovinetto and ZwallyGiovinetto and Zwally, 2000). Also in part, the smaller break-back rate in the DMLS-C might be explained by impeded land-ice discharge due to the mountain range alignment inland and parallel to the grounding line, as well as the absence of subglacial troughs, outlet ice streams, etc. (e.g. Reference Van Autenboer and DecleirVan Autenboer and Decleir, 1978; cf. Reference Bentley, Giovinetto, Weller, Wilson and SeverinBentley and Giovinetto, 1991).
AIS
The best slant-range measurements set compiled for the AIS barrier was obtained from the Geosat(GM) database centered on 1 January 1986, and adequate compilations were obtained from the Seasat database centered on 15 September 1978 and the ERS-1(GM) database centered on 26 September 1994. The M values obtained for all three lobes were uniform between the two possible intervals, with no extraordinary crossover of the barrier traces, i.e. any measured d and –d values were <±10 km2. Therefore, for simplicity, we present a single assessment for the longest possible interval (16.04 years).
The mean motion for the AIS is estimated at 0.60 kma–1 along a discharge periphery of 294 km. There is a small difference between the M values for the AIS-W and AIS-E lobes (0.41 along a periphery of 145 km or 49% of the total, and 0.55 kma–1 along a periphery of 80 km or 27% of the total, respectively). These two lobes drain the grounded ice areas extending on either side of the AIS (systems 9 and 11). As expected, the largest M value is estimated for AIS-C (1.03 kma–1 along 69 kmor 24% of the total periphery) that drains the three large interior basins of Fisher, Mellor and Lambert Glaciers (system 10).
WIS and SIS
The barrier delineation for both the WIS and the SIS was based on the Geosat(GM) database centered on 1 January 1986. These barrier locations were compared with those obtained from the USGS map, first for the WIS-W sector based on NOAA-6 data centered on 18 January 1980 (an interval of 5.95 years), and second for the WIS-E sector and SIS, both based on NOAA-7 data centered on 16 February 1983 (an interval of 2.87 years).
The mean motion for the WIS is estimated at –1.19 kma–1 along a discharge periphery of 605 km. The two component estimates for the WIS-W and -E sectors show a relatively large range of M values given the relatively uniform characteristics of the ice discharging across the grounding line (e.g. Budd and Smith, 1985; Reference Budd and WarnerBudd and Warner, 1996), suggesting that our sampling intervals of different length (–0.93 kma–1 for 5.95 years, and –1.49 kma–1 for 2.87 years, respectively) might include or exclude calving or surge phenomena on either sector that occurred betweenJanuary 1980 andJanuary 1986.
RIS
Slant-range measurements from the ERS-1 and -2 databases centered on 25 June 1992 and 5 May 1998, respectively, produced barrier locations encompassing an interval of 5.86 years that appears to be free of major calving events or surge episodes. The boundaries between lobes, inland as well as on the ice shelf, correspond to boundaries between ice streams typically identified at their gates near the grounding line of western West Antarctica. It was mentioned above that the coastal end-point of the divide between systems 16 and 17 is the northernmost point on Brown Peninsula (77.78˚ S, 165.6˚ E). In this study, for brevity, we do not include the minor RIS flow southward of Ross Island into the area of the McMurdo Ice Shelf (cf. Reference Giovinetto and ZumbergeGiovinetto and Zumberge, 1968; Reference SwithinbankSwithinbank, 1970), and select Cape Crozier on Ross Island as the western boundary for the RIS-W lobe. Elsewhere we use the divides as boundaries: the boundary between systems 17 and 18 is the boundarybetween Ice Stream A and Whillans Ice Stream, and that between systems 18 and 19 is the boundary between Ice Streams C and D (cf. Reference Thomas, MacAyeal, Eilers, Gaylord, Hayes and BentleyThomas and others, 1984; Reference Fahnestock, Scambos, Bindschadler and KvaranFahnestock and others, 2000).
Relative to the mean motion for the RIS as a whole (1.37 along a discharge periphery of 861km), the larger M value estimates are for the RIS-W and -C lobes (1.44 kma–1 along 327 km or 38% of the periphery, and 1.84 kma–1 along 243 km or 28% of the periphery, respectively). The lower M value estimate is for the RIS-E lobe (0.91kma–1 along 291km or 34% of the periphery). The discharge from this lobe is split by Roosevelt Island in complex interaction with the ice flow from Ice Streams D and E (Reference Fahnestock, Scambos, Bindschadler and KvaranFahnestock and others, 2000).
Discussion And Conclusions
Our determination of motion based on area change over time produces lower-limit estimates because the approach does not detect area change due to relatively small calving or surge events. This shortcoming is shared with all other methods that estimate barrier motion based on differences in barrier location over time (e.g. Reference Keys, Jacobs and BrighamKeys and others, 1998). However, the area-change approach is not affected by the inherent sources of error in estimates of ice-shelf motion based on vector analysis, namely, velocity interpolation between survey sites that are far apart, and azimuth variation of the motion (e.g. Reference Hofmann, Dorrer, Nottarp and MellorHofmann and others, 1964; Reference LisignoliLisignoli, 1964). Preceding studies show large directional (lateral) variability of ice-shelf motion for periods of a few years and longer, particularly in the vicinity of either permanently or temporarily grounding areas (e.g. Reference LisignoliLisignoli, 1964; Reference Giovinetto and ZumbergeGiovinetto and Zumberge, 1968; Reference Swithinbank, Brunk and SieversSwithinbank and others, 1987; Reference Keys, Jacobs and BrighamKeys and others, 1998; Reference Fahnestock, Scambos, Bindschadler and KvaranFahnestock and others, 2000).
We assess the composite error for each estimate of motion produced in this study on the basis of the mid-range value for the error in the compilation of barrier location from slant-range analysis (±0.5 km), and of the mean error in the location of features, including barriers, applicable to the supplementary maps used in the study (±2.5 km; e.g. Reference KohnenKohnen, 1982; Reference FerrignoFerrigno and others, 1996). Treated as standard errors, the composite values are ±0.71km for estimates based on two barrier locations determined from slant-range analysis, and ±2.55 km for estimates based on one of two barrier locations determined from maps compiled else-where. These two composite values are allocated to the corresponding estimates of motion listed in Table 1, split over each particular interval.
Excluding the extraordinarily large error applicable to the estimate for FRIS-C2, the assessed error ranges from ±4% for AIS-C (1.03±0.04 kma–1) to ±86% for DMLS-W (–1.02±0.88 kma–1). The error is generally smaller for the lobes corresponding to ice shelves in large embayments, where it is between the aforementioned ±4% for AIS-C and ±26% for FRIS-C (–1.15±0.30 kma–1), than for the sectors in marginal ice shelves, where it is between ±29% for DMLS-E (–2.98±0.87 kma–1) and the aforementioned ±86% for DMLS-W. Both the slant-range method used by us and the imagery utilized by others to compile the supplementary maps produce excellent spatial coverage relative to vector analysis, and significantly reduce the probable error in the determination ofmotion. Nonetheless, the errors listed in Table 1 are large and suggest that errors listed in other studies may be grossly underestimated.
Our findings are not directly comparable to many estimates of motion reported in the literature, most of which are based on vector analysis, or in surveys normally made at distances ranging from a few to >100 km from the barrier. Nevertheless, the following comparisons provide a perspective on the results listed in Table 1:
(a)Motion for a sector equivalent to FRIS-C3 and FRIS-E combined has been estimated from three vectors for sites a few kilometers from the barrier at 1.33 kma–1 for the period ~1957–62 (Reference LisignoliLisignoli, 1964). Our weighted estimate of motion is 1.39±0.18 kma–1 (~1992–98).
(b) Motion for a sector equivalent to the central and eastern parts of AIS-C has been estimated at 0.98 kma–1 at a mean distance from the barrier of approximately 37 km (the range for the velocity and distance of the nine vectors around 1962–65 is from 0.81kma–1 at 59 km from the barrier, to 1.25 kma–1 at 15 km from the barrier; Reference Budd, Corry and JackaBudd and others, 1982). This estimate suggests a mean motion of approximately 1.3 kma–1 at the barrier, a rate confirmed for the central part of the AIS for 1997 (Reference Fricker, Young, Allison and ColemanFricker and others, 2002). Our estimate for the lobe, including its western part, is 1.03±0.04 kma–1 (~1978–94).
(c) Mean motion for the equivalent of RIS-C can be estimated at 0.84 kma–1 for ~1962–66 from 28 vectors evenly distributed along a discharge periphery of 243 km extending approximately 100 km from the barrier and parallel to it (Reference Giovinetto and ZumbergeGiovinetto and Zumberge, 1968; original data from a personal communicationby E. Dorrer, 1966 (cf. Reference Hofmann, Dorrer, Nottarp and MellorHofmann and others, 1964; Reference DorrerDorrer, 1970)). This estimate suggests a mean motion of approximately 1.0 kma–1 at the barrier, which is well below our estimate of 1.84±0.12 kma–1 (~1992–96) for a discharge periphery of exactly the same length (see (e) below).
More direct comparisons are possible with information obtained from reports that either show different barrier locations for particular periods, or produce estimates from the same type of compilations:
(d) Detailed mapping of the barrier location in the FRIS (Reference Swithinbank, Brunk and SieversSwithinbank and others, 1987) shows the barrier location for the equivalent of FRIS-Wduring February– May 1986, and its location in February 1973 for the western third of its length and in February 1974 for the other two-thirds of its length. The mean distance between the two barrier traces is approximately 14 km, from which we obtain a weighted mean motion of 1.14 kma–1. Our estimate of motion for the same lobe is 1.25±0.10 kma–1 (~1992–98).
(e) A compilation of the RIS barrier location for particular years distributed between 1841 and 1997 includes reports on detailed mapping from ships (global positioning system (GPS) navigation and radar detection of the barrier) for the years 1987, 1994 and 1997, when the location was determined with an error of ±0.25 km(Reference Keys, Jacobs and BrighamKeys and others, 1998). Coincidentally during those years, the sector equivalent to our RIS-C lobe was least affected by calving or surge events (as opposed to phenomena in the RIS-E and -W, respectively). The mean velocity reported for either of the two periods in the sector equivalent to the RIS-C lobe is relatively steady at approximately 0.9 kma–1 (Reference Keys, Jacobs and BrighamKeys and others, 1998). Our estimate of motion for the lobe is 1.84±0.12 kma–1 (~1992–98). At the time of writing, we do not have an explanation for the large difference between the two estimates; the slant-range datasets are among the best in distribution and quality, there is no evidence of large calving or surge events, and we are not aware of any reports on transverse rift formation. A rate of motion similar to our estimate for the RIS-C lobe has been reported for the central part of the RIS-W lobe and obtained by the procedure based on change in barrier location around 1983–87 (approximately 1.9 kma–1, citing the widening of existing transverse rifts and formation of an additional rift during the period; Reference Keys, Jacobs and BrighamKeys and others, 1998). However, for the same period and using the same procedure, the motion for the equivalent to our RIS-C is approximately 0.6 kma–1 (Reference Keys, Jacobs and BrighamKeys and others, 1998), i.e. a 33% lower value than the estimate of 0.9 kma–1 for 1992–98. The estimates of motion based on vector analysis support the estimate of approximately 0.9 kma–1 rather than our estimate of 1.8 kma–1. Firstly, there is our own estimate of motion from the 28 sites surveyed around 1962–66 (approximately 1.0 kma–1 at the barrier) as described in (c), above. Secondly, we estimate a velocity of 0.96 kma–1 (~1976–77) for the sector from a set of five survey sites located from a few to 35 km from the barrier (Reference Thomas, MacAyeal, Eilers, Gaylord, Hayes and BentleyThomas and others, 1984; sites Q9 and R10–13) that also suggests a barrier motion of approximately 1.0 kma–1. More importantly, our own database shows an even larger difference between the estimates of motion derived from barrier locations compiled for 25 June 1992,26 September 1994 and 5 May 1998, corresponding to slant-range analysis of the ERS-1, ERS-1(GM) and ERS-2 databases, respectively. The first interval (2.25 years) produces an extraordinarily large value of 3.37 kma–1, while the second (3.61years) produces a value of 0.89 kma–1 that is in close agreement with the estimates of Reference Keys, Jacobs and BrighamKeys and others (1998). At the time of writing, we do not have an explanation for the large discrepancy in our data either, and therefore suggest that the estimate of motion listed in Table 1 for the RIS-C lobe should be used with caution and in full awareness of the diverse estimates obtainable for the lobe.
Our study suggests that ice shelves occupying large embayments (the FRIS, AIS and RIS) may, for periods of the order of 10 years, sustain motion seaward (positive M values), leading to large-scale calving events. It also suggests that marginal ice shelves characterized by relatively short distances between principal segments of their grounding line and barrier (i.e. practically all other Antarctic ice shelves) break back more gradually and with higher frequency (negative M values), and therefore large calving events are less frequent. One aspect of ice-shelf–ocean interactionsmight contribute to the signed motion difference just described. Briefly stated, it should be expected that the FRIS, AIS and RIS, due to their greater thickness near the barrier, break up in response to the cumulative effects of tide-induced flexing (wave periods of the order 105 s), while the thinner, marginal ice shelves break up in response to the cumulative effects of swell-induced flexing (wave periods of the order of 101 s), even if a particular tide or storm surge triggers the actual break.



