Introduction
Having children imposes large additional costs on households. The fact that this could be expected to lower the material living standards of adults who decide to have children does not necessarily prevent them from doing so. Even in societies where children are no longer an insurance against destitution in old age, they bring intrinsic value to families, rather than just being seen as an expense.
Nevertheless, governments intervene to help cover the cost of children, for a number of reasons. Family allowances have been used by a wide range of countries, in some cases as part of pro-natalist policies (Grant et al., Reference Grant, Hoorens, Sivadeasan, Loo, DaVanzo, Hale, Gibson and Butz2004) and more generally to express social solidarity with those raising the next generation as well as to help smooth household living standards over the life-course by transferring income to people during their childrearing years. Other transfers are targeted more specifically towards low-income families, aiming to combat child poverty and more specifically to prevent children from being damaged by physical hardship and social exclusion related to low family income (Battle and Mendelson, Reference Battle and Mendelson2001; OECD, 2011).
In a number of countries, the objectives of family assistance programmes targeted at low-income groups have become more ambitious in recent years. Governments have taken on the twin objectives of reducing relative poverty among families with children and maintaining work incentives. This has required substantial aid to working families with low earnings as well as to those where nobody works. This expanded role for the state has been influenced by changes both in families and in the labour market that have undermined the degree to which families can rely on a ‘breadwinner’ to make ends meet. A growth in lone parenthood has left families economically vulnerable, both in terms of having no earner in the family for lengthy periods of time and in terms of having low family earnings where a lone parent is working for limited hours on low wages – exacerbated by the expense of childcare. An increase in wage inequalities and in part-time and unstable employment has exacerbated these risks and also affected couples where a single earner on low pay cannot provide adequately for a family, or where a low-paid working couple faces high childcare costs.
The more wide-ranging forms of means-tested transfers to families that have resulted create a very different context of support than either a benefits safety net intended to see families through temporary periods of unemployment or a universal contribution to family income intended to ease the cost of raising children but not to take on a high proportion of this cost. Where the state now pays high income-dependent transfers to working as well as non-working families, the level of these transfers can do more to determine children's living standards than has been the case in the past. This is partly because parents in low-wage occupations never escape this ‘dependency’, whether they work or not and partly because high rates of withdrawal with rising income can mean that even people with somewhat modest but not very low earnings are unable to raise their net incomes much above a minimum guaranteed level.
In this context, the adequacy of state support has a closer relationship with family living standards than it has had previously. Yet political and public consensus over the acceptable level of support is hampered partly by limitations of the measurement of income adequacy (summarised for example in Bradshaw et al., Reference Bradshaw, Middleton, Davis, Oldfield, Smith, Cusworth and Williams2008: 1–2). Relative poverty benchmarks set arbitrary percentages of average household income, adjusted for household composition using equivalence scales that are also arbitrary or based on theoretical inferences about equivalent utility based on spending patterns. Among the public, there is no clearly defined consensus about what poverty means in a developed country (Park et al., Reference Park, Phillips and Robinson2007). Consensual methods for identifying deprivation, which consider how many items considered as necessities by the majority of the population cannot be afforded by certain households, do provide valuable measures of the extent of poverty that are grounded in public views (Mack and Lansley, Reference Mack and Lansley1985; Gordon et al., Reference Gordon, Adelman, Ashworth, Bradshaw, Levitas, Middleton, Pantazis, Patsios, Payne, Townsend and Williams2000). However, they do not in themselves produce ‘adequate income’ thresholds, since no one level of overall income determines whether families can or cannot afford the selected items classified as necessities.
However, in recent years, the development of budget standards, which add up the cost of items that families actually need to be able afford, has provided such benchmarks. Moreover, a new technique, the Minimum Income Standard (MIS), applied in several countries, anchors such a benchmark in social consensus about what comprises a minimum acceptable standard of living. This paper uses MIS results to assess the cost of a child in the United Kingdom and thereby to investigate the adequacy of state support for low-income families with children. First, however, it considers more specifically how current policies for supporting children raise issues about income adequacy.
The policy context: supporting families and income adequacy
Modern welfare states have traditionally protected families from destitution through social insurance and social assistance programmes designed to provide replacement income for those (with and without children) who are temporarily out of work. In recent years, a number of countries have found such programmes an insufficient form of family protection and have complemented and, in some cases, integrated them with income-tested transfers for families who have earnings from work.
This has proven necessary largely because, without such transfers, many low-earning families would have poor levels of family income, creating risks both of work disincentives and of child poverty. These related risks arise where market earnings are too low to provide income significantly higher than out-of-work benefits received by families with children. Lowering or restricting such benefits to improve work incentives would increase child poverty. Paying transfers instead to working families on low incomes can help restore work incentives, while cutting poverty among children whose parents do work.
Allowances or tax credits supporting working families with low incomes in and out of work were pioneered in several English-speaking countries where growth in lone parenthood and in earnings inequalities have tended to be greatest (OECD, 2001: 35, 67). As early as the 1970s, Canada, the United Kingdom and the United States introduced means-tested transfers for low-income working families, but set them at very modest levels. By the late 1990s, these three countries and Australia were using more substantial in-work transfers as part of prominent policies to address work incentives and child poverty (Battle and Mendelson, Reference Battle and Mendelson2001; Milligan and Stabile, Reference Milligan and Stabile2008; Mikol and Rémy, Reference Mikol and Rémy2009).
In many European countries, such benefits targeted at low-income working households have been less important, partly because relatively generous child-related benefits and tax allowances have been available more widely. These are either universal or means-tested but available a long way up the income scale – for example in some countries they are still paid to couples on average earnings (Van Mechelen and Bradshaw, Reference Van Mechelen, Bradshaw, Marx and Nelson2012). However, as Van Mechelen and Bradshaw show in their recent analysis of trends across Europe, reductions in these generally available benefits have increased the pressure for improved targeting to help low-income workers escape poverty. Moreover, debates about work incentives and their relationship to ‘activation’ policies have been prominent across OECD countries (OECD, 2011; de Luca et al., Reference De Luca, Rossetti and Vuri2012), and, in 2009, France introduced the Revenu de Solidarité Active (RSA), which shares many features with the tax credits, tax allowances and family benefits developed in English-speaking countries (Mikol and Rémy, Reference Mikol and Rémy2009).
Much debate and research about such in-work transfers and their impact has focused on work incentives and their behavioural consequences (OECD, 2011). However, the consequences for poverty and for income adequacy are also great. This is particularly the case to the extent that countries have been moving towards an integration of income-tested family support in and out of work. Australia's Family Tax Benefit and Canada's Child Tax Benefit both provide support for working and non-working families. The same is true of France's RSA, which has incorporated and replaced the main safety-net benefit, the Revenue Minimum de l'Insertion. In the United States on the other hand, in-work support through the Earned Income Tax Credit (EITC) remains entirely separate from out-of-work benefits.
In the United Kingdom, greater integration of in- and out-of-work transfers has come in phases. In 2003, when Working Tax Credit and Child Tax Credit replaced Working Families Tax Credit, the latter but not the former became an integrated payment to provide for family needs regardless of working status. From 2013 onwards, when both are replaced by the Universal Credit, the same baseline support level will be paid to out-of-work families and be used as the starting-point for a means-tested in-work payment (Department for Work and Pensions, 2010). However, as argued below, Universal Credit sustains rather than overturns the main feature of the present system for supporting the cost of children in low-income families: a credit paid at a flat rate up to a certain level of earnings and reduced as earnings rise above that level.
Integrated systems operate to a considerable degree like a negative income tax, with the state providing a baseline minimum income and reducing the net state transfer continuously as earned income rises. Were such a system to be introduced from a ‘blank sheet’, the obvious question would be: what level of basic income is adequate for families to live on? Such a question has particular political resonance when related to concerns about children suffering harmful outcomes or not achieving their potential as a result of low family income. It arises more obviously in an integrated system than in one where support is set separately for people in and out of work – where there may be an implicit or explicit desire to set out-of-work benefits low enough to make any decision not to work an uncomfortable one. Integrated systems may also be oriented to this end, but less easily dichotomise the generosity of support for ‘working’ and ‘non-working’ household types. In particular, any decision to change the general level of support typically applies across the board.
In practice, actual levels of support often follow a precedent rather any explicit principle about what minimum family income level is acceptable. Even in a move towards an entirely new set of support structures, such as the forthcoming introduction of the UK's Universal Credit, the working assumption has been that the level of out-of-work support, the baseline for the Credit, will be based on the previous system (Department for Work and Pensions, 2010). On the other hand, the support level can become a focus for efforts to address child poverty. The Child Tax Credit was introduced in the United Kingdom in 2003 as the first form of means-tested support to be set at a common level for families regardless of working status, and this made it the government's most powerful policy tool for reducing child poverty (Hirsch, Reference Hirsch2006). Canada's equivalent, the Canada Child Tax Credit, potentially plays a similar role, and has been compared to benchmarks of adequacy by those arguing for it to be raised to a higher level (e.g., Mendelson, Reference Mendelson2005).
Support levels vary greatly across countries, both in terms of the baseline level of support and in terms of how support changes with rising income. One nine-country comparison of these levels in the mid-2000s, for example, showed that Australia had particularly generous support for non-earning families but also the sharpest decline as earnings rise; that the UK's transfers are generous (relative to average earnings) at 50–100 per cent of average earnings; and that France was most generous at twice average earnings (Whiteford, Reference Whiteford2008: 28). More recent OECD figures using the same basis show that for a non-working lone parent, children's additions as a percentage of average earnings are nearly twice as high (27 per cent) for Australia than for France (15 per cent), with the United Kingdom closer to the Australia (24 per cent) figure (author calculations based on OECD, 2012). Within Europe, the United Kingdom stands out as a country paying particularly high child-contingent transfers to working families with very low incomes. Van Mechelen and Bradshaw (Reference Van Mechelen, Bradshaw, Marx and Nelson2012: 94) compare such benefits for a lone parent with two children on the minimum wage in twenty-six countries, and show that in the United Kingdom they make up about half of family income, much more than in any other country. The United Kingdom is also the only one of these countries where benefits and wages for such low-earning lone parents combine to bring net income significantly above the poverty line.
Support levels have also changed considerably over time. In the United States, the Earned Income Tax Credit has been expanded on a number of occasions, most recently from 2009, as a tool to combat in-work child poverty (Center on Budget and Policy Priorities, 2012). In the United Kingdom, children's benefits for an out-of-work family with two young children rose by over 50 per cent in real terms between 1997 and 2012, twice as fast as the growth in earnings (Hirsch et al., Reference Hirsch, Sutton and Beckhelling2012). However, towards the end of this period, the trend started to reverse, first with the freezing of Child Benefit and then with the announcement of below-inflation rises in means-tested support (HM Treasury, 2011, 2012). Such changes are largely driven by fiscal austerity, but they are also influenced by a de-emphasising of support for incomes as an anti-poverty strategy (see, for example, Field, Reference Field2010).
Measuring the cost of a child: (1) specifying a minimum
In judging the adequacy of benefits targeted at families with children on limited means, a crucial issue is how much it costs to bring up a child at an acceptable standard of living. State support for such families is motivated to a large degree by the desire to ensure that children do not suffer undue hardship or long-term damage in their development as a consequence of family poverty. As set out above, work incentives are also a key objective, but these could be achieved by reducing out-of-work benefits were it not for a concern for the damage that this could do to children.
Measuring the cost of a child is not easy. Income poverty lines are adjusted for family composition, implying that they take account of additional costs related to having children. However, they are not based on evidence of actual needs, but on arbitrary percentages of average income and on equivalence scales which are themselves based on abstract estimates of relative needs (Banks and Johnson, Reference Banks and Johnson1993). Recently, Bollinger et al. (Reference Bollinger, Nicolletti and Pudney2012) have shown that when self-reports of economic well-being in different family types are compared to income, responses suggest that existing equivalence scales underestimate economies of scale in couples but also underestimate the marginal cost of children. Both these findings are in the same direction as the findings of Minimum Income Standard research, described below.
Budget standards measures (sometimes referred to as reference budgets), on the other hand, look at what actually should be in a minimum family budget. There are, however, many different ways in which such budgets can be constructed, with many different approaches adopted in different countries (Deeming, Reference Deeming2011; Nibud, 2009; Saunders, Reference Saunders2004). In some cases, budget standards draw on spending patterns, assuming that to some extent minimum spending in a particular category of consumption is determined by what a given percentage of the population, or people in a given range of the income distribution, actually do spend. Such approaches do not however measure need, and, importantly, do not capture the extent to which greater economic inequalities could lead to a larger proportion of the population falling short of reaching an acceptable living standard. In other cases, budget standards draw on expert judgements about what constitute necessities, but their approaches and interpretations differ across countries and methodologies, making an objective measure on this basis problematic (Hirsch et al., Reference Hirsch, Sutton and Beckhelling2012).
The Minimum Income Standard (MIS) methodology, developed in the United Kingdom (Bradshaw et al., Reference Bradshaw, Middleton, Davis, Oldfield, Smith, Cusworth and Williams2008) and repeated in Ireland (Collins et al., Reference Collins, Mac Mahon, Weld and Thornton2012), Guernsey (Smith et al., Reference Smith, Davis and Hirsch2011), Japan (Shigekawa and Yamada, Reference Shigekawa and Yamada2012) and Portugal (Rendimento Adequado em Portugal, 2013), provides a stable and robust basis for measuring the minimum that households need to spend in order to meet an adequate standard of living. The method was developed jointly by the Family Budget Unit at the University of York and the Centre for Research in Social Policy at Loughborough University, supported by the Joseph Rowntree Foundation, which also funds regular updates of the standard for the UK. MIS realises an ambition first set out in a seminal article in the Journal for Social Policy in 1987 by Robert Walker and developed over the following years (Walker, Reference Walker1987; Middleton, Reference Middleton, Bradshaw and Sainsbury2000): the creation of an income standard informed by consensus among members of the public.
The central feature of this method is the compilation of lists of items in a series of deliberative groups comprising members of the public. Each group is required to compile or to check and revise a complete list of items that a household would need in order to reach a minimum acceptable standard of living. Groups of around eight people are drawn from a range of socio-economic groups, in each case from a given demographic category (e.g., pensioner, couple with children) according to the type of household whose needs are under review. However, participants are not asked to define their own minimum requirements but that of a hypothetical ‘case study’ family to illustrate what a household would generally need as a minimum. Groups operate under the following definition:
A minimum standard of living in Britain today includes, but is more than just, food, clothes and shelter. It is about having what you need in order to have the opportunities and choices necessary to participate in society.
Each budget list is drawn up by an initial task group and verified or amended by subsequent checkback and final groups. These later groups also combine individual lists and comment on economies of scale. In between these stages, public deliberation is complemented by expert input on issues such as nutritional adequacy and heating requirements, and by researcher pricing of the specified goods and services according to shopping principles agreed by the groups. Researchers compare budget totals to the actual distribution of spending by households, and, where these seem greatly out of line, ask the final group to consider whether they need revision.
While the dependence of this method on judgements made by members of the public may appear to make it more arbitrary than more ‘scientific’ calculations, in practice it has proven a robust and consistent technique for quantifying a socially agreed minimum. The level of consensus within groups is high, as detailed discussions produce common understanding of what is meant by a minimum. The great majority of items are readily agreed, and confirmed by checkback groups. Others produce debate, normally leading to a resolution within each group. For the small number of items over which a group's decision is less certain, the use of a series of groups helps produce the result that best reflects the judgements of members of the public.
Moreover, in the United Kingdom and in Ireland, repeated MIS studies have provided stable results that suggest that the method is internally robust (Davis et al., Reference Davis, Hirsch, Smith, Beckhelling and Padley2012; Collins et al., Reference Collins, Mac Mahon, Weld and Thornton2012). The 2012 MIS research in the United Kingdom compiled budgets for families with children from scratch, using the same method, but different research participants, as in 2008. In the great majority of cases, the later groups came to almost identical decisions, and, where decisions varied significantly, there were usually plausible rationales about why they should have changed. For example, increased transport budgets could be related to a documented deterioration of and less reliance on public transport, and reduced social participation budgets to a more thrifty attitude to the minimum needed for eating out and buying birthday and Christmas presents in tougher economic times (Davis et al., Reference Davis, Hirsch, Smith, Beckhelling and Padley2012).
Crucially, MIS offers comparison of minimum requirements across time and place using a consistent metric, namely social consensus measured by a clearly specified method. The fact that this method is being successfully applied in cultures as diverse as Ireland and Japan offers future scope for international comparisons of minimum income requirements, and their relationship to the actual distribution of income.
Measuring the cost of a child: (2) calculating additional costs
The cost of a child can be conceptualised and measured as the additional amount that a family needs to spend in order to have a minimum acceptable standard of living, as a result of having that child (Hirsch et al., Reference Hirsch, Sutton and Beckhelling2012).
This definition contrasts with measures that look at the amount actually spent on children (such as LV, 2012). As discussed above, spending figures are bound to reflect actual resources available to families, and capture neither the extent to which poorer families under-provide for their children nor the extent to which richer families provide well beyond what children ‘need’ because they can afford to.
Among measures that count the additional cost of a child in relation to family needs, Oldfield (Reference Oldfield1993) distinguishes two approaches derived from budget standards. The ‘itemised variant’ adds up the cost of items identified as attributable to the presence of the child in the family, in some cases attributing a proportion of shared items. The ‘deductive variant’, on the other hand, subtracts the whole budget for a family without children from one with children to estimate the net extra cost that the children bring. Using MIS data, Oldfield and Bradshaw (Reference Oldfield and Bradshaw2011) focus on the itemised variant, which is also used for the same purpose in relation to MIS research in Ireland (Mac Mahon et al., Reference Mac Mahon, Weld, Thornton and Collins2012). The present paper uses the deductive variant, drawing on calculations made by Hirsch et al. (Reference Hirsch, Sutton and Beckhelling2012), and in so doing is able to give a fuller estimate of costs of children at various ages, birth orders and over the life cycle than previous work.
Both conceptual and practical considerations affect the choice between these two variants. Conceptually, the itemised variant is easier to grasp, consisting simply of the aggregate cost of things that children need. However, by taking account of a wider range of changes that occur as a result of having a child, the deductive variant gives a more complete picture of the overall impact of children on family costs. For example, it includes changes in the structure of social participation for adults when they are parents compared to when they are not. Hirsch et al. (Reference Hirsch, Sutton and Beckhelling2012) explored the rationales for such changes, through additional discussion with members of the public about how a minimum acceptable living standard changes with family composition, and show that some additional children's cost is offset by savings in required spending on adults.
In practical terms, itemised cost calculations based on previous budget standard studies (Oldfield, Reference Oldfield1993) and on selected MIS budgets (Oldfield and Bradshaw, Reference Oldfield and Bradshaw2011) have required very detailed enumeration of which budget items can be attributed in whole or in part to children. This requires researcher judgement about how to allocate costs for shared items and the level of detail makes it impractical to repeat the exercise for children at every age and for every size of family. Conversely, Oldfield and Bradshaw point to difficulties with the deductive method, in terms of understanding the respective roles of changes in adult needs, changes in child needs and economies of scale in driving household differences.
However, making full use of the detailed data in MIS on budgets for families with different numbers of children at different ages allows the deductive method to give a more complete profile of the additional cost of children. Hirsch et al. (Reference Hirsch, Sutton and Beckhelling2012) use this in combination with new qualitative research on the drivers of family costs to observe and comment on the additional cost of each child, by birth order, at each year of age up to the eighteenth birthday. For the first child of a couple, this is based on subtracting the budget for a couple without children from that of a couple with one child at each particular age. The same is done for a lone parent family in comparison to a single person. The additional cost of having a second child at age x is calculated as the cost of a family with children aged x and x + 3, minus the cost of a family with just one child aged x + 3, based on the observation from survey data that the median age gap in two-child families is three years. Similar calculations are made for the additional cost of a third child and (for couple families only) a fourth child.
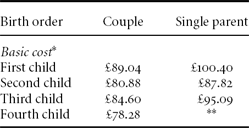
Table 1 shows the structure of the average weekly cost of children from birth to their eighteenth birthday in the UK, using this method. This initial figure does not include childcare or housing costs, which vary greatly across families. The results suggest that overall, additional children's costs are greater for single parent families than for couples, and that the additional costs of a child is in some cases less for each successive child, but not consistently so.
Average additional cost of each child per week, all ages, UK 2012
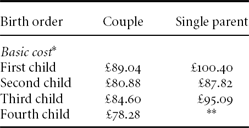
Notes: *Excludes rent, council tax and childcare costs.
**MIS only calculates budgets up to three children for lone parent families.
Source: Hirsch et al. (Reference Hirsch, Sutton and Beckhelling2012).
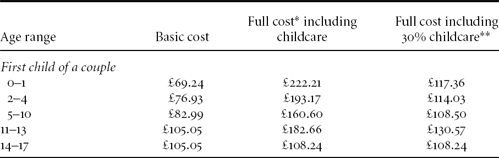
On this ‘additional cost’ basis, housing could potentially bring either: high additional costs where additional space requirements increase the price of privately renting or buying a home; only very modest additional costs for tenants of social housing where rental differences associated with size are very modest; or even a reduction in costs where a household gets access to a cheaper housing sector as a result of having children. Total costs, shown in Table 2 below, include modest additional rents using a model of social renting throughout.
Average additional cost of child per week, by age range, UK 2012

Notes: *Full cost includes modest additions to social housing rents – see text – and additional council tax.
**Tax credits pay up to 70% childcare for low income working families.
Source: Hirsch et al. (Reference Hirsch, Sutton and Beckhelling2012) and author calculations based on MIS data.
These results are influenced by an interaction of a number of different factors, sometimes working in different directions. In particular, clear economies of scale in some items such as food are in some cases counteracted by additional needs that appear when a family reaches a certain size. For example, the consensus in MIS groups is that a car becomes a necessity when the first child arrives in the family, and a larger car than the most basic one is needed with the arrival of the third child. This creates particularly large additional transport costs for the first child, and higher additional transport costs for the third than the second or the fourth. The arrival of the first child also triggers a reduction in spending on adults’ leisure activities which brings greater savings for couples than for single parents. In some cases, economies of scale associated with rising family numbers are non-linear because pack sizes for items such as food favour a particular number of people. All these factors operating together make the relationship between family numbers and the additional cost of a child less clear-cut than one might expect.
On the other hand, as shown in the first column of Table 2, there is a distinct positive relationship between children's ages and their basic costs, not including childcare. A secondary school child costs an estimated 50 per cent more on a day-to-day basis than a baby; this is influenced especially by items like clothes, food and social participation.
However, the reverse is true of the cost of childcare, and Table 2 shows the extent to which falling childcare costs and rising other costs balance each other out (the figures including childcare are for families working full time, where full-time paid childcare is assumed for those periods not covered by free fifteen-hour early years provision for three- to four-year olds or by school time for children up to the age of thirteen). In cases where the full cost of childcare falls on the family, the overall cost of a very young child is about twice as great as for a secondary school child, with full-time childcare costing about twice as much as all other costs combined for an infant.
On the other hand, for families on low incomes, tax credits can cover up to 70 per cent of such costs, and, where they do, the net additional cost of a child is more evenly spread throughout childhood. The total may peak when a child of eleven or twelve starts incurring the expenses associated with secondary-school age but still needs after-school and holiday childcare (the MIS data may somewhat exaggerate this peak by assuming the same childcare costs from ages five to thirteen and the same other costs from ages eleven to eighteen, both of which are likely to be simplifications). However, the net overall cost of an infant in a low-income family is estimated at only about 8 per cent higher than that of a teenager, showing that for those who claim it, the childcare element of the Working Tax Credit can do a good job of smoothing the expense of a child over the period of childhood. It used to go even further; if this Credit had continued to reimburse up to 80 per cent of childcare costs rather than 70 per cent, as it did before 2011, the net overall cost of the infant would be about 5 per cent lower than that of the secondary school child for families receiving full childcare tax credit.
The adequacy of state support for children in the UK
How far do state transfers directed at families with children go in covering the additional costs that children bring? This question can be addressed differently for two types of family in the UK: those who do not work and those who work but with incomes far too low to support their families adequately. Support is also available for families not on low incomes, but this ‘universal’ support plays a comparatively minor part in supporting such families and is declining in relative importance. As shown in Table 3, families on low incomes in work presently receive up to 4.4 times as much in combined child-based allowances as better-off children receive in Child Benefit alone. In 1992, the ratio was 2.2. Moreover, in April 2013, Child Benefit stops being universal, as families with someone earning over £60,000 a year become ineligible, while in 2012 the tapering of the Child Tax Credit was restructuredFootnote 1 to make fewer families with relatively high incomes eligible.
Benefit rates for children, per week* – couple with two children, UK, 1992 and 2012

Notes: *Combined value of Child Benefit (both years), Child Tax Credit (2012) and children's elements of Income Support and Family Credit (1992). Expressed in nominal terms, so relevant comparison is of within-year ratios between the three columns.
**Child Benefit only. From 2013, some families with high incomes become ineligible for this.
Out-of-work families
Families without work depend largely or wholly on the state for support. Some also receive help from other sources, including absent partners, but the level at which benefits are set cannot take such support for granted. Out-of-work benefits for adults in the UK were pegged to prices between 1981 and 2012, and therefore fell continuously (other than during recessions) relative to earnings and to average incomes. However, in addressing child poverty, UK governments from 1998 to 2011 frequently increased out-of-work benefits for children (child allowances in Income Support before 2003 and Child Tax Credit after 2003) faster than the growth in average earnings. To what extent has this helped their families meet the cost of a child adequately?
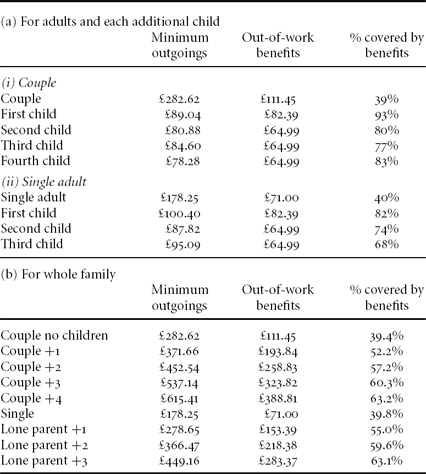
Table 4 looks at how adequately the cost of children is covered by the benefits system, in two ways. The top half of the table shows that while benefits provide less than half of what adults need, additional benefits for each child provide most of the additional cost of having that child – in most cases at least three quarters of that cost, and in one case over 90 per cent. These are averages for all ages, and in general the younger the child, the higher the proportion covered. For the youngest age category (ages 0–1), children's benefits in most cases cover above 100 per cent of the additional cost.
Income requirements and benefits, per week, UK 2012
Note: Net of rent and council tax. No childcare. Costs averaged across children's ages.
Source: Hirsch et al. (Reference Hirsch, Sutton and Beckhelling2012) and further author calculations.
However, as shown in the lower part of Table 4, the overall adequacy of benefits for families with children looks much less favourable than this, providing between half and two-thirds of overall family costs. This is because the relative generosity of children's benefits is mixed with the relative frugality of those of their parents in determining family income. Given that evidence has shown consistently that parents on low incomes make sacrifices in their own well-being to meet the needs of their children (Hirsch et al., Reference Hirsch, Sutton and Beckhelling2012), the fact that children's benefits provide for most of the cost of a child remains significant in relation to children's welfare. But family living standards as a whole for those depending on benefits remain well below what is considered a minimum acceptable standard of living by the general public in the UK.
Low-income working families
The support package for children in working families on low incomes has the same foundation as for out-of-work families as shown in the top half of Table 4, comprising Child Benefit and Child Tax Credit. These families can thus potentially get an equivalent contribution towards the basic cost of a child as those on benefits. In fact, when comparing low-earning families with and without children, the difference in state transfers can be greater than this, because the presence of children increases the amount of income disregarded when calculating state support. These conditions will be replicated under the new Universal Credit (see next section). On the one hand, this state transfer contributing most of the cost of a child to the poorest working families is superior, in terms of ‘adequacy’, to the same amount paid to out-of-work families, since the former are better provided for overall. Even low earnings make a higher contribution to the adult side of family spending than adult benefits. On the other hand, for working but not out-of-work families, young children typically bring an additional cost, in the form either of paid childcare or loss of the earnings of a parent-carer.
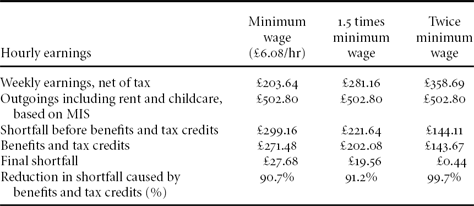
Thus, in-work benefits cover much of the additional cost of children for families on the lowest incomes, but are unlikely to overcompensate for them. As argued earlier in this paper, this gives the state a significant and relatively new role in underpinning living standards for low-income families in a more fundamental way than preventing destitution during periods when they are out of work. While the extent of this help varies greatly according to the wages, childcare costs and housing costs of each family, Table 5 illustrates the extent of these transfers for a lone parent on various wages, and their relationship to meeting an adequate income.
The state contribution to making ends meet: lone parent with child aged 1, working full time (2012)
Table 5 shows that for a single parent on the minimum wage, after-tax earnings cover only half of required outgoings, including childcare and rent (even assuming full-time work, which is not always possible). The state makes up most of this difference, but leaves the family about £28 a week short of what it needs, which represents about 10 per cent of net outgoings (after rent and childcare). As family earnings rise, reduction of income-tested transfers together with increased tax severely curtails the increase in net income, and, as a consequence, this family would have to double its earnings in order to make up this relatively small shortfall. This situation underlines the extent to which the UK state guarantees working families a baseline income, but makes it hard for those on modest earnings to rise much above this baseline. One consequence of this is that the level of earnings required for a given standard of living is highly sensitive to the level at which entitlements are set.
The Universal Credit and changes in entitlement levels
Starting in late 2013, a new system for delivering income transfers inside and outside work, the Universal Credit, is replacing Britain's benefits and tax credits system for working-age families (Department for Work and Pensions, 2010). This will simplify entitlements by making a single monthly payment to entitled families inside and outside work. It will end distinctions between ‘adult’ and ‘child’ portions of income transfers and between ‘working’ and ‘out-of-work’ benefits. While under the old system, a common level of Child Tax Credit is paid regardless of working status and withdrawn when income reaches a certain level, adult/whole family needs are supported in entirely different systems according to how many hours people work, with Income Support payable below and Working Tax Credit above an hours threshold that depends on family composition. Universal Credit combines the adult and child portions, abolishes hours rules, and is available in full to anyone earning below a given ‘disregarded’ income level. It is withdrawn at 65 per cent of post-tax earnings above that level.
These changes will have some important effects on the structure of entitlements, most importantly in terms of rewards to part-time work. In the old system, anyone working below the minimum hours thresholds is little better off than in benefits, but net income jumps sharply once they reach these thresholds; under Universal Credit, there will be a smoother, continuous scale of rewards, with marginal gains at their greatest when working a few hours, and earning below the disregard. The switch to the new system will create winners and losers (Hirsch and Beckhelling, Reference Hirsch and Beckhelling2011), and just as importantly is being brought in at a time when benefit levels generally are not keeping up with rising minimum living costs, and some entitlements such as childcare support are being reduced (Davis et al., Reference Davis, Hirsch, Smith, Beckhelling and Padley2012).
Yet despite these changes, when it comes to supporting families with children, Universal Credit has much more in common with the tax credit system than with anything that came before. It maintains the principle, introduced in 2003, of paying a credit based on number of children to every family on a low income, in and out of work, which is only withdrawn once income reaches a given level. It also continues to pay a percentage of eligible childcare costs, also as a means-tested entitlement, although no longer subjected to the hours entitlement applying to Working Tax Credit.
Conclusion: a new dependency?
This paper has used a relatively new method of measuring income adequacy to explore the extent to which the United Kingdom's tax credit and benefits system allows families on low incomes to reach acceptable living standards. The results show that in non-working families and working families on the lowest incomes, the state provides most but not all of the additional costs of children. However, families as a whole get well below what they need on out-of-work benefits, and from 2011 onwards the overall generosity of the system to all families is being reduced through budget cuts. Moreover, sharp withdrawal of state support as earnings rise can also trap families on incomes that may still not be enough for an acceptable living standard.
These findings show through the UK's example both the potential and the pitfalls of a system where the state plays the prime role in covering the cost of children in low-income families as well as those out of work. They provide lessons in particular to countries where in-work support has been less targeted, but where tighter public budgets create the incentive to make it more so (Van Mechelen and Bradshaw, Reference Van Mechelen, Bradshaw, Marx and Nelson2012).
On the one hand, the UK system has gone a long way in addressing the inability of low-wage jobs to meet the needs of families with high costs due to having children. In some cases, it has made it about as feasible for parents in such jobs to make ends meet as non-parents earning the same amount. The new Universal Credit is continuing what the tax credit system introduced: the principle of transferring the same level of child-related support to low-earning families as to those out of work. Notwithstanding recent cuts in support levels, this principle allows adequacy of transfers to low-income families to be addressed in an integrated way.
On the other hand, the high level of dependency on the state for income that this has created for millions of working families also has its downsides. One is that it limits families’ ability to improve their net incomes by working longer hours or progressing in their jobs, because they lose most of any earnings increase through reduced state support. Another consequence is that they are presently facing reductions in their living standards as a heavily indebted state cuts back on the level of entitlements. These disadvantages can work in combination. Families who have recently experienced a reduction in in-work support to below what they need are poorly placed to make up the difference, say by working additional hours, because most of the extra income would be recouped by the state in higher taxes and reduced benefits.
The Universal Credit will rationalise entitlements and change some structural features of support, but will preserve the overall nature of a system that targets support to families with children on low incomes, whether they work or not. The sharpest combined income withdrawal rates for working families will be abolished, but those receiving Universal Credit and paying tax will still lose 76 per cent of additional earnings. For such families, the level at which the Credit is set, and how much of their earned income is disregarded before it starts to be withdrawn, could be at least as important as their wage rates in determining their living standards. The Minimum Income Standard will provide an ongoing benchmark against which to monitor the standards that families can achieve under this system.