


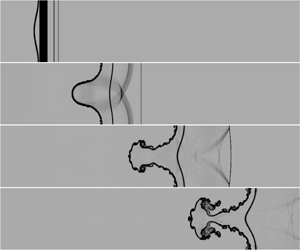
1 Introduction
The interfacial instability of a heavy fluid accelerated by a light fluid is generally known as Rayleigh–Taylor (RT) instability (Rayleigh Reference Rayleigh1883; Taylor Reference Taylor1950). It is induced by a baroclinic torque created by the misalignment of the pressure gradient,  $\unicode[STIX]{x1D735}p$, and the density gradient,
 $\unicode[STIX]{x1D735}\unicode[STIX]{x1D70C}$, at the perturbed interface, with
 $\unicode[STIX]{x1D735}\unicode[STIX]{x1D70C}\boldsymbol{\cdot }\unicode[STIX]{x1D735}p<0$. A similar phenomenon is Richtmyer–Meshkov (RM) instability (Richtmyer Reference Richtmyer1960; Meshkov Reference Meshkov1969), which occurs when an interface separating two fluids of different densities is accelerated by an impulsive acceleration (e.g. a shock wave). Both RT instability and RM instability play important roles in inertial confinement fusion (Lindl et al. Reference Lindl, Landen, Edwards and Moses2014) and astrophysical problems (Shimoda et al. Reference Shimoda, Inoue, Ohira, Yamazaki, Bamba and Vink2015). Extensive studies have been performed to understand RT and RM instability, and several comprehensive reviews have been presented (Sharp Reference Sharp1983; Brouillette Reference Brouillette2002; Ranjan, Oakley & Bonazza Reference Ranjan, Oakley and Bonazza2011; Zhou Reference Zhou2017a,Reference Zhoub).
In contrast, the interfacial instability induced by rarefaction waves attracts less attention than that driven by continuous acceleration (RT instability) or shock waves (RM instability), although the interfacial instability induced by rarefaction waves is also a factor in many engineering and scientific problems. For example, interfacial instability occurs in a jet-engine combustor at the interface between fuel and air when the flow passes through the rarefaction waves generated by the geometrical configuration of the engine or by fuel injection (Li & Book Reference Li and Book1991). In addition, in the interaction of a blast wave with an interface between materials, the rarefaction waves that follow the leading shock wave move outward from the energy source point (Miles et al. Reference Miles, Edwards, Blue, Hansen, Robey, Drake, Kuranz and Leibrandt2004; Kuranz et al. Reference Kuranz, Drake, Harding, Grosskopf, Robey, Remington, Edwards, Miles, Perry and Blue2009). The interface thus experiences a complex acceleration history due to the combination of the leading shock wave and the subsequent rarefaction waves, and RT instability occurs when the blast wave crosses the interface or transits through a region where the density decreases. In addition, in shock–bubble interaction (Niederhaus et al. Reference Niederhaus, Greenough, Oakley, Ranjan, Anderson and Bonazza2008) and shock–droplet interaction (Sembian et al. Reference Sembian, Liverts, Tillmark and Apazidis2016; Guan et al. Reference Guan, Liu, Wen and Shen2018), rarefaction waves are generated by the shock wave interacting with the downstream heavy/light interface. The internal rarefaction waves accelerate the upstream interface motion, and focusing of these waves even generates cavitation bubbles near the downstream interface in a droplet.
Numerically, the RT instability induced by rarefaction waves has been investigated (Li & Book Reference Li and Book1991; Li, Kailasanath & Book Reference Li, Kailasanath and Book1991), and the mixing enhancement due to the rarefaction waves in supersonic mixing layers was determined. However, the time-varying amplitude growth of the interface perturbation induced by rarefaction waves has not been quantitatively investigated. Experimentally, the RT instability driven by rarefaction waves was investigated in a vertical rarefaction tube (Morgan, Likhachev & Jacobs Reference Morgan, Likhachev and Jacobs2016; Morgan et al. Reference Morgan, Cabot, Greenough and Jacobs2018). Puncturing of the diaphragm separating the vacuum tank beneath the test section generated rarefaction waves that travelled upwards and accelerated the interface downwards. Two-dimensional (2-D) and three-dimensional (3-D) single-mode perturbation diffuse interfaces were created, and planar laser-induced Mie scattering photography was used to visualise the interface evolution. The effects of the interface diffusion and the Atwood number on the interface evolution were investigated. The interaction of rarefaction waves with the interface persisted throughout the entire experimental period. The interfacial instability after the rarefaction waves leave the interface and the effects of the rarefaction wave strength on the interfacial instability have not been studied.
In this work, SF6/air interfaces separating gases with different densities are considered. The interaction of rarefaction waves with the interface is quantified using one-dimensional (1-D) gas dynamics theory. The interface evolution and wave patterns are acquired from 2-D simulations with the in-house conservation element and solution element (CE/SE) scheme (Shen et al. Reference Shen, Wen, Liu and Zhang2015a; Shen, Wen & Zhang Reference Shen, Wen and Zhang2015b; Shen & Wen Reference Shen and Wen2016). The time-varying amplitude growth of the interface induced by rarefaction waves is compared for different initial conditions. The effects of the interaction time of the rarefaction waves with the interface and the rarefaction wave strength on the interfacial instability are highlighted. Notably, the interaction time of rarefaction waves with the interface is defined as the period between the time at which the rarefaction wave head (RWH) reaches the initial average position (IAP) of the interface and the time at which the rarefaction wave tail (RWT) leaves the IAP, while the rarefaction wave strength is defined as the ratio of the difference between the initial pressure across the interface and the pressure behind the RWT to the initial pressure across the interface. Furthermore, nonlinear models are established considering the two stages of RT and RM instability, and the model predictions agree well with the numerical results. Finally, quantitative comparisons of the interfacial instability induced by rarefaction waves and a shock wave are investigated for the first time.
2 Numerical methods
2.1 Numerical set-up and scheme
The process of rarefaction waves interacting with a heavy/light interface examined in this study is described by the compressible Euler equations. An in-house upwind space–time CE/SE scheme with a second-order accuracy in both space and time (Shen et al. Reference Shen, Wen, Liu and Zhang2015a,Reference Shen, Wen and Zhangb; Shen & Wen Reference Shen and Wen2016) is utilised. A volume-fraction-based five-equation model (Abgrall Reference Abgrall1996; Shyue Reference Shyue1998) is used to illustrate the different species residing on both sides of the inhomogeneous interface. The contact discontinuity restoring HLLC (Harten–Lax–van Leer–Contact) Riemann solver (Toro, Spruce & Speares Reference Toro, Spruce and Speares1994) is used to determine the numerical fluxes between the conservation elements. The use of this scheme in capturing shocks and details of complex flow structures for shock–bubble and shock–droplet interactions has been well validated (Shen et al. Reference Shen, Wen and Zhang2015b; Shen & Wen Reference Shen and Wen2016; Shen et al. Reference Shen, Wen, Parsani and Shu2017; Shen & Parsani Reference Shen and Parsani2017; Fan et al. Reference Fan, Guan, Wen and Shen2019). Recently, the CE/SE scheme was further proven by Zhai et al. (Reference Zhai, Zhang, Zhou, Ding and Wen2019) to be reliable in the study of the RT instability effects on the cylindrically converging RM instability, which justifies the use of this scheme in computing the physics of fluids consisting of both RT instability and RM instability.
Two-dimensional simulations are performed in the present study. The initial settings of the simulation are presented in figure 1(a). Non-reflecting boundary conditions are enforced by implementing stretching grids beyond the top and bottom boundaries ( $y=-200$ and
 $y=300$ mm) to increase numerical dissipation and eliminate the effects of the rarefaction waves reflected from the top and bottom boundaries on the interface evolution; reflecting and periodic conditions are imposed at the right and left boundaries (
 $x=0$ and
 $x=60$ mm), respectively. The initial amplitude (
 $a_{0}$), wavelength (
 $\unicode[STIX]{x1D706}$) and wavenumber (
 $k$) of the 2-D single-mode perturbation sharp interface are 2.0 mm, 60 mm and
 $104.72~\text{m}^{-1}$, respectively, in all cases. The zones of the initial gases A (air), B (SF6) and C (SF6) are defined as zone 5, zone 1 and zone 0, respectively. There are two reasons for the gas pair of SF6 and air being chosen as the test gases on the two sides of the interface: First, the density of SF6 in zone 5 (
 $\unicode[STIX]{x1D70C}_{5}$) is
 $6.143~\text{kg}~\text{m}^{-3}$, and the density of air in zone 1 (
 $\unicode[STIX]{x1D70C}_{1}$) is
 $1.204~\text{kg}~\text{m}^{-3}$; thus, the initial Atwood number (
 $A$) of the SF6/air interface, which is defined as
 $(\unicode[STIX]{x1D70C}_{5}-\unicode[STIX]{x1D70C}_{1})/(\unicode[STIX]{x1D70C}_{5}+\unicode[STIX]{x1D70C}_{1})$, equals 0.672. Therefore, the development of RT instability and RM instability induced by rarefaction waves is rapid when the SF6/air interface is chosen, providing the interface evolves for a long time. Second, due to the non-toxicity and stability of SF6, the gas pair of SF6 and air chosen in the present study is a good candidate for further experimental studies in a rarefaction tube. The specific heat ratios in zone 5 (
 $\unicode[STIX]{x1D6FE}_{5}$) and zone 0 (or 1) (
 $\unicode[STIX]{x1D6FE}_{0(1)}$) are 1.399 and 1.094, respectively. The sound speeds in zone 5 (
 $c_{5}$) and zone 0 (or 1) (
 $c_{0(1)}$) are
 $343.1~\text{m}~\text{s}^{-1}$ and
 $133.9~\text{m}~\text{s}^{-1}$, respectively. The initial pressure in zone 5 (or 1) (
 $p_{5(1)}$) is 101 325 Pa. The other initial gas parameters in zone 0 are shown in table 1. The initial interface is set above the diaphragm and the distance between the IAP of the interface and the diaphragm is
 $L$;
 $L$ is varied from 10.0 mm to 50.0 mm to change the interaction time of the rarefaction waves with the interface, and
 $\unicode[STIX]{x1D70C}_{0}$ (
 $p_{0}$) in zone 0 is varied from
 $0.1\unicode[STIX]{x1D70C}_{1}$ (
 $0.1p_{1}$) to
 $0.5\unicode[STIX]{x1D70C}_{1}$ (
 $0.5p_{1}$) to change the pressure ratio on the two sides of the diaphragm. The ratio of
 $L$ to
 $\unicode[STIX]{x1D706}$,
 $L/\unicode[STIX]{x1D706}$, and the ratio of
 $p_{1}$ to
 $p_{0}$,
 $p_{10}$, are shown in table 1 for different cases. The initial pressure of gas C is lower than that of both gases A and B. Therefore, rarefaction waves arise when the diaphragm (at
 $x=0$) between gases B and C suddenly bursts, and move upwards to interact with the interface.
Schematics of the initial configuration for the numerical simulation (a), the flow field when the rarefaction wave head impacts the initial average position of the interface (b) and the flow field after the rarefaction wave tail leaves the interface (c).

The initial physical parameters in all cases.  $L$ represents the distance between IAP of the interface and the diaphragm;
 $\unicode[STIX]{x1D70C}_{0}$ and
 $p_{0}$ represent the density and pressure in zone 0, respectively;
 $L/\unicode[STIX]{x1D706}$ represents the ratio of
 $L$ to
 $\unicode[STIX]{x1D706}$; and
 $p_{10}$ represents the ratio of
 $p_{1}$ to
 $p_{0}$.

For the data of the numerical simulations, the nodes with a volume fraction of SF6 between 15 % and 85 % are chosen as the finite-thickness interface. Then, the mean value of  $y$ of these nodes on each row is taken as the average position of the local interface. The amplitude is defined as half of the distance between the local interface position closest to the upper boundary and that closest to the bottom boundary. Notably, a separate test was conducted with the ranges of 1 %–99 %, 5 %–95 %, 10 %–90 % and 15 %–85 % of volume fraction of SF6 as the finite-thickness interface. The results show that the time-varying amplitude growth of the interface is not sensitive to the choice of the volume fraction range.
2.2 Code validation
The evolution of a 2-D single-mode perturbation diffuse interface with the gas pair of SF6/CO2 for 3.5 wavelengths induced by rarefaction waves obtained in experimental work (Morgan et al. Reference Morgan, Cabot, Greenough and Jacobs2018) is used for the code validation. Figure 2(a) illustrates the comparisons of the interface evolution between the numerical results (right) and the images obtained from the experiments (left) and Miranda simulations (middle). It can be observed that both the amplitude and the overall shape of the 2-D perturbation in the current numerical results agree well with the experiments and Miranda simulations before 3.3 ms. After 4.2 ms, more small vortices occur along the interface in the current numerical simulations compared with the Miranda simulations when the mesh sizes are the same ( $=0.1$ mm). The discrepancies are ascribed to Navier–Stokes simulations being used in the work of Morgan et al. (Reference Morgan, Cabot, Greenough and Jacobs2018) and Euler simulations being used in this study. However, the whole interface evolution and mixing width growth in the numerical simulations are in agreement with the Miranda simulations. In addition, the time-varying amplitude growth of a 2-D single-mode perturbation diffuse interface with the gas pair of SF6/air for 1.5 wavelengths calculated by the Miranda code is compared with the current numerical results, as shown in figure 2(b). The current simulations also quantitatively agree well with the Miranda simulations.
Code validation based on comparisons of (a) the interface evolutions for the gas pair of CO2/SF6 and 3.5 wavelengths from experiments (left) and Miranda simulations (middle) obtained from Morgan et al. (Reference Morgan, Cabot, Greenough and Jacobs2018) and the present simulation (right), where numbers represent the time in ms; and (b) the time-varying amplitude growth for the gas pair of air/SF6 and 1.5 wavelengths.

2.3 Grid independence test
Four mesh sizes of 0.4 mm, 0.2 mm, 0.1 mm and 0.05 mm were tested for grid-convergence validation. The density along the symmetry line of the interface at 2.5 ms converges when the mesh size is reduced to 0.1 mm and 0.05 mm in the numerical simulations, as sketched in figure 3(a). In addition, the amplitude of the interface at 2.5 ms also converges when the mesh size is reduced to 0.1 mm and 0.05 mm in the numerical simulations, as shown in figure 3(b). Therefore, to ensure the accuracy and minimise the computational cost, an initial mesh size of 0.1 mm is adopted for all simulations. Notably, due to the large thickness of the initial interface ( $=3.4~\text{mm}$), grid-convergence validation with the density and amplitude profiles across the diffuse interface is challenging.
Grid-convergence validation. (a) Density profiles, where the inset shows the data extracted along the symmetry line of the interface at 2.5 ms from the present simulation, and (b) the time-varying amplitude growth, where the inset shows how the amplitude  $a$ is measured.

3 One-dimensional gas dynamics theory
Before qualitative and quantitative analyses are performed on the interactions of rarefaction waves with a perturbed heavy/light interface, 1-D gas dynamics theory (Owczarek Reference Owczarek1964; Velikovich & Phillips Reference Velikovich and Phillips1996) is used to estimate the flow conditions in zones 2, 3 and 4 in figure 1 after the rarefaction wave–interface interactions. We define  $p_{mn}=p_{m}/p_{n}$,
 $c_{mn}=c_{m}/c_{n}$,
 $\unicode[STIX]{x1D6FC}_{n}=(\unicode[STIX]{x1D6FE}_{n}+1)/(\unicode[STIX]{x1D6FE}_{n}-1)$,
 $\unicode[STIX]{x1D6FD}_{n}=(\unicode[STIX]{x1D6FE}_{n}-1)/2\unicode[STIX]{x1D6FE}_{n}$ and
 $\unicode[STIX]{x1D6FF}_{n}=\sqrt{2/\unicode[STIX]{x1D6FE}_{n}(\unicode[STIX]{x1D6FE}_{n}-1)}$, where ‘
 $m$’ and ‘
 $n$’ are the numbers of zones shown in figure 1. After the diaphragm bursts, rarefaction waves move upwards, and a shock wave moves downwards, followed by the burst diaphragm, as seen in figure 1(b). The Mach number (
 $M_{s}$) of the shock wave, the pressure (
 $p_{2}$) and the flow velocity (
 $u_{2}$), in zone 2 can be obtained using 1-D gas dynamics theory (Owczarek Reference Owczarek1964; Velikovich & Phillips Reference Velikovich and Phillips1996), as shown in table 2. As mentioned in § 1, the dimensionless pressure,
 $|p_{2}-p_{1}|/p_{1}$, is proposed to evaluate the pressure change along the propagation direction of the rarefaction waves and is defined as the rarefaction wave strength (see table 2). It is shown that as
 $p_{10}$ increases,
 $|p_{2}-p_{1}|/p_{1}$ increases, implying that the rarefaction waves are stronger.
The RWH moves with speed  $-c_{1}$, and the RWT moves with speed
 $(\unicode[STIX]{x1D6FE}_{1}+1)u_{2}/2-c_{1}$. Therefore, the rarefaction wave zone expands as the waves move upwards. After the RWH impacts the interface, the weaker rarefaction waves are transmitted into gas A, and the compression waves are reflected into gas B. The zones in gas A and gas B on the two sides of the interface are defined as zone 4 and zone 3 after the RWT leaves the interface, as shown in figure 1(c). During the interaction of the rarefaction waves and the interface, the interface accelerates, and its final velocity reaches
 $u_{3}$ (
 $\equiv u_{4}$). According to 1-D gas dynamics theory (Owczarek Reference Owczarek1964; Velikovich & Phillips Reference Velikovich and Phillips1996):
 $$\begin{eqnarray}u_{3}=\frac{c_{1}}{\unicode[STIX]{x1D6FE}_{1}\unicode[STIX]{x1D6FD}_{1}}(p_{21}^{\unicode[STIX]{x1D6FD}_{1}}-1)-\frac{c_{1}\unicode[STIX]{x1D6FF}_{1}(p_{32}-1)}{(\unicode[STIX]{x1D6FC}_{1}p_{32})^{0.5}}p_{21}^{\unicode[STIX]{x1D6FD}_{1}}.\end{eqnarray}$$
The unknown parameter in (3.1) is  $p_{32}$ (
 $=p_{31}/p_{21}$), which satisfies the relation
 $$\begin{eqnarray}c_{51}=\frac{\unicode[STIX]{x1D6FE}_{5}\unicode[STIX]{x1D6FD}_{5}}{p_{31}^{\unicode[STIX]{x1D6FD}_{5}}-1}\left[\frac{1}{\unicode[STIX]{x1D6FE}_{1}\unicode[STIX]{x1D6FD}_{1}}(p_{21}^{\unicode[STIX]{x1D6FD}_{1}}-1)-\frac{\unicode[STIX]{x1D6FF}_{1}(p_{32}-1)}{(\unicode[STIX]{x1D6FC}_{1}p_{32}+1)^{0.5}}p_{21}^{\unicode[STIX]{x1D6FD}_{1}}\right].\end{eqnarray}$$
Here,  $p_{32}$ can be derived from (3.2) using a numerical iterative algorithm and then substituted into (3.1) to acquire
 $u_{3}$, as listed in table 2.
Physical properties of different gases calculated from 1-D gas dynamics theory (Owczarek Reference Owczarek1964; Velikovich & Phillips Reference Velikovich and Phillips1996) for all cases.  $M_{s}$ is the Mach number of the shock wave;
 $p_{2}$ and
 $p_{3(4)}$ are the pressures in zone 2 and zone 3 (or 4), respectively;
 $|p_{2}-p_{1}|/p_{1}$ represents the rarefaction wave strength;
 $u_{2}$ and
 $u_{3(4)}$ are the flow velocities in zone 2 and zone 3 (or 4), respectively;
 $\unicode[STIX]{x0394}t$ is the interaction time of the rarefaction waves with the interface; and
 $\bar{g}$ is the average acceleration imposed on the interface by the rarefaction waves.

As discussed in previous work (Li & Book Reference Li and Book1991; Li et al. Reference Li, Kailasanath and Book1991; Morgan et al. Reference Morgan, Likhachev and Jacobs2016, Reference Morgan, Cabot, Greenough and Jacobs2018), the perturbation growth at the heavy/light interface is dominated by RT instability during the interaction of the rarefaction waves with the interface. Therefore, it is important to derive the interaction time of the rarefaction waves with the interface,  $\unicode[STIX]{x0394}t$, and the interface acceleration,
 $g$. The sufficiently small ratio of the interface amplitude to the wavelength (0.033) in this study means that the interaction of the rarefaction waves with the interface is regarded as a quasi-1-D case. This implies that the interface begins to accelerate after the RWH reaches the IAP of the interface at
 $t=0$ and stops accelerating after the RWT leaves the IAP of the interface at
 $t=\unicode[STIX]{x0394}t$. When the RWH reaches the IAP of the interface, the span of the rarefaction waves region (
 $S$, defined as the distance between RWH and RWT) is
 $(\unicode[STIX]{x1D6FE}_{1}+1)u_{2}\unicode[STIX]{x1D6FF}t/2$, and
 $\unicode[STIX]{x1D6FF}t=L/c_{1}$ is the time period between the RWH formation and the moment when it reaches IAP of the interface. By analogy with the acceleration profiles derived from the flat interface displacement obtained in figure 6 of the experimental work of Morgan et al. (Reference Morgan, Cabot, Greenough and Jacobs2018), the acceleration imposed on the flow is assumed to linearly decrease from the RWH to the RWT, and the expressions for the time-varying
 $g$ and interface displacement (
 $x$) are thus
 $$\begin{eqnarray}\displaystyle \left.\begin{array}{@{}c@{}}\displaystyle g=\bar{g}\left[\unicode[STIX]{x1D716}-(2\unicode[STIX]{x1D716}-2)\frac{t}{\unicode[STIX]{x0394}t}\right],\\ \displaystyle x=\int _{0}^{\unicode[STIX]{x0394}t}\bar{g}\left[\unicode[STIX]{x1D716}-(2\unicode[STIX]{x1D716}-2)\frac{t}{\unicode[STIX]{x0394}t}\right]t\,\text{d}t,\end{array}\right\} & & \displaystyle\end{eqnarray}$$
where  $\bar{g}$ is the average acceleration imposed on the interface and
 $\unicode[STIX]{x1D716}$ is the parameter indicating the acceleration strength distribution in the direction of propagation of the rarefaction waves. The value of
 $\unicode[STIX]{x1D716}$ is greater than 1 and less than 2. When
 $\unicode[STIX]{x1D716}$ equals 1,
 $g$ is uniform across the rarefaction waves; when
 $\unicode[STIX]{x1D716}$ equals 2,
 $g$ at the RWT is 0. Then,
 $\unicode[STIX]{x0394}t$ and
 $\bar{g}$ in the interaction problem between the IAP of the interface and the rarefaction waves can be solved as follows:
 $$\begin{eqnarray}\displaystyle \left.\begin{array}{@{}c@{}}\displaystyle \unicode[STIX]{x0394}t=\frac{3(\unicode[STIX]{x1D6FE}_{1}+1)u_{2}L}{4c_{1}u_{3}-\unicode[STIX]{x1D716}c_{1}u_{3}+6c_{1}^{2}-3(\unicode[STIX]{x1D6FE}_{1}+1)c_{1}u_{2}},\\ \displaystyle \bar{g}=\frac{u_{3}}{\unicode[STIX]{x0394}t}=\frac{4c_{1}u_{3}^{2}-\unicode[STIX]{x1D716}c_{1}u_{3}^{2}+6c_{1}^{2}u_{3}-3(\unicode[STIX]{x1D6FE}_{1}+1)c_{1}u_{2}u_{3}}{3(\unicode[STIX]{x1D6FE}_{1}+1)u_{2}L}.\end{array}\right\} & & \displaystyle\end{eqnarray}$$
When  $\unicode[STIX]{x1D716}$ equals 1.2, the time-varying SF6/air interface displacements calculated by (3.3) agree well with their 1-D numerical counterparts, as shown in figure 4(a). The values of
 $\unicode[STIX]{x0394}t$ and
 $\bar{g}$ for different cases are also listed in table 2.
(a) The comparisons of the time-varying SF6/air interface displacements obtained from the 1-D simulation (symbols) with the theoretical predictions (lines) calculated from (3.3). The comparisons of  $\unicode[STIX]{x0394}t$ and
 $\bar{g}$ by changing (b)
 $L/\unicode[STIX]{x1D706}$ with
 $p_{10}=10.0$ and (c)
 $p_{10}$ with
 $L/\unicode[STIX]{x1D706}=0.50$.

The effects of  $L$ and
 $p_{10}$ on
 $\unicode[STIX]{x0394}t$ and
 $\bar{g}$ are discussed here. Figures 4(b) and 4(c) show the variations in
 $\unicode[STIX]{x0394}t$ and
 $\bar{g}$ with
 $L$/
 $\unicode[STIX]{x1D706}$ when
 $p_{10}$=10.0 and with
 $p_{10}$ when
 $L/\unicode[STIX]{x1D706}=0.50$, respectively, according to (3.4). As seen in figure 4(b), when
 $L/\unicode[STIX]{x1D706}$, i.e. the span of the rarefaction wave region, increases,
 $\unicode[STIX]{x0394}t$ linearly increases but
 $\bar{g}$ sharply decreases when
 $L/\unicode[STIX]{x1D706}$ is less than 0.1. Additionally, figure 4(c) shows that as
 $p_{10}$, i.e. the rarefaction wave strength, increases,
 $\unicode[STIX]{x0394}t$ increases but
 $\bar{g}$ decreases.
4 Results and discussion
4.1 Qualitative analysis
The numerical schlieren images (Desse & Deron Reference Desse and Deron2009) of the SF6/air interface evolution induced by the rarefaction waves in different cases are presented in figure 5. Time zero is defined as the moment at which the RWH impacts the IAP of the interface. The SA1 case is used as an example to detail the interaction process, as shown in figure 5(a). The black layer in the first frame shows the density-varying layer across the rarefaction waves ( $-25~\unicode[STIX]{x03BC}\text{s}$). The initial interface accelerates after the RWH impacts it; then, RT instability is triggered on the interface, and the perturbation on the interface gradually grows. Then, after the RWT leaves the interface, the interface acceleration decreases to zero, and the baroclinic vorticity generated by the mismatch of the density gradient on the interface and the pressure gradient induced by the rarefaction waves dominates the later interface evolution (
 $33~\unicode[STIX]{x03BC}\text{s}$). The interfacial instability at this stage is similar to RM instability; the baroclinic vorticity generated by the shock wave dominates the perturbation growth after the shock wave leaves the interface. Generally, we define the flow structure of a heavy fluid penetrating a light fluid as a spike and the flow structure of a light fluid penetrating a heavy fluid as a bubble. Later, at approximately
 $68~\unicode[STIX]{x03BC}\text{s}$, a pair of large vortices appears on the head of the spike; these are caused by the velocity shears on the two sides of the interface and represent Kelvin–Helmholtz instability. Eventually, the large
 $A$ leads to spike–bubble asymmetry, and a mushroom-shaped spike structure forms in the final nonlinear evolution stage, which adopts a shape very different to the adjacent bubble structures (
 $103~\unicode[STIX]{x03BC}\text{s}$). In figure 5, it can be seen that the interfacial morphologies are similar during the whole evolution process in SA1, SA3 and SA5. In contrast, the interface evolution is faster when
 $p_{10}$ is larger, as can be seen by comparing SA3, SA7 and SA9, which means that stronger rarefaction waves induce a faster evolution of the interface.
Schlieren images of the SF6/air interface evolution induced by rarefaction waves in cases (a) SA1, (b) SA3, (c) SA5, (d) SA7 and (e) SA9. Numbers represent the time in  $\unicode[STIX]{x03BC}\text{s}$. (f) Schlieren images of the interface evolution in cases SA1 (left), SA3 (middle) and SA5 (right) at dimensionless time
 $ku_{3}At=10.3$.

4.2 Quantitative analysis
The amplitude variations of the SF6/air interfaces with time in the dimensionless form for cases of (a) different  $L$ and a fixed
 $p_{10}~(=10.0)$ and (b) different
 $p_{10}$ and a fixed
 $L$ (
 $L/\unicode[STIX]{x1D706}=0.50$) are shown with symbols in figure 6. The time and amplitude of the perturbed interface are normalised as
 $ku_{3}At$ and
 $k[a(t)-a_{0}]$, respectively, where
 $a(t)$ is the time-varying amplitude of the interface. As seen in figure 6, the dimensionless amplitude for every case increases in an ‘S’-shaped trend as the dimensionless time increases. The vertical dashed lines with the same colours as the symbols mark the inflection point at
 $t=\unicode[STIX]{x0394}t$ for each case. During the interaction of the rarefaction waves with the interface (
 $0<t<\unicode[STIX]{x0394}t$), RT instability occurs at the interface and the interface amplitude growth rate continues to increase due to the continuous acceleration of the rarefaction waves (i.e. the amplitude growth curve traces a ‘concave-up’ shape). After the RWT leaves the evolving interface, there is no body force (
 $g$) imposed on the interface. Therefore, the interface moves downwards at a constant velocity
 $u_{3}$, and the interface evolution enters the RM instability stage.
Comparisons of the dimensionless amplitude of the SF6/air interface among cases of (a) different  $L$ and a fixed
 $p_{10}=10.0$ and (b) different
 $p_{01}$ and a fixed
 $L/\unicode[STIX]{x1D706}=0.50$. Symbols represent the interface amplitude growth obtained from the simulations. Solid lines and dashed-dotted lines with the colours corresponding to the symbols represent the predictions of the modified ZGRT model proposed by Zhang & Guo (Reference Zhang and Guo2016) and the modified ZRM model proposed by Zhang, Deng & Guo (Reference Zhang, Deng and Guo2018), respectively, and vertical dashed lines of the colours corresponding to the symbols represent the separation between the RT and RM instability stages at
 $t=\unicode[STIX]{x0394}t$.

The cross-over point of the interface amplitude growth appears at approximately the dimensionless time of 10.3 for cases with different  $L$, as shown in figure 6(a). The schlieren images of cases SA1, SA3 and SA5 at this moment are presented in figure 5(f). The asymmetry between the spike and the bubble is obvious in all three cases, which implies that the interface evolution has entered the nonlinear stage at this moment. The interfaces have similar shapes at the cross-over point. In addition, the vortices on two sides of the spike in the SA1 case are larger than those in the other two cases, which indicates that a larger vortex shear is induced when the interaction period is shorter.
4.3 Nonlinear theory analysis
The nonlinear models separately proposed by Zhang & Guo (Reference Zhang and Guo2016) and Zhang et al. (Reference Zhang, Deng and Guo2018) to predict the single-mode perturbation interface amplitude growth under RT instability (ZGRT model) and RM instability (ZRM model) are adopted for comparison with the numerical simulations and to interpret the results shown in figure 6. The model of Zhang & Guo (Reference Zhang and Guo2016) shows a remarkable ability to predict the growth of both the bubble and the spike. Based on the feature that all bubbles and spikes closely follow a universal curve in terms of scaled dimensionless variables at any density ratio, the growth rates of both the bubble and the spike are derived (Liu et al. Reference Liu, Liang, Ding, Liu and Luo2018). The ZGRT model is written as follows:
 $$\begin{eqnarray}\frac{\text{d}v}{\text{d}t}=-\unicode[STIX]{x1D6FC}(A)k(v^{2}-v_{qs}^{2}),\end{eqnarray}$$
where  $v(=\text{d}a(t)/\text{d}t)$ is the interface amplitude growth rate
 $$\begin{eqnarray}\displaystyle \unicode[STIX]{x1D6FC}(A)=\frac{3}{4}\frac{(1+A)(3+A)}{[3+A+\sqrt{2(1+A)}]}\frac{[4(3+A)+\sqrt{2(1+A)}(9+A)]}{[(3+A)^{2}+2\sqrt{2(1+A)}(3-A)]}, & & \displaystyle\end{eqnarray}$$
 $$\begin{eqnarray}\displaystyle v_{qs}=\sqrt{\left(\frac{Ag}{3k}\frac{8}{(1+A)(3+A)}\frac{[3+A+\sqrt{2(1+A)}]^{2}}{[4(3+A)+\sqrt{2(1+A)}(9+A)]}\right)}, & & \displaystyle\end{eqnarray}$$
with a positive Atwood number for bubbles and the negative counterpart for spikes with the same density ratio. The initial amplitude growth rate ( $v_{0}$) at
 $t=0$ equals 0.
 $\unicode[STIX]{x1D6FC}(A)$ is a function of
 $A$. Due to the limited variance in
 $A$ with time caused by the rarefaction waves (Morgan et al. Reference Morgan, Cabot, Greenough and Jacobs2018),
 $A$ is set as the initial value of 0.672, and
 $\unicode[STIX]{x1D6FC}(A)$ equals 1.232 in the present study. The parameter
 $v_{qs}$ is the interface amplitude growth rate in the quasi-steady stage of RT instability. Notably,
 $v_{qs}$ is a function of time because
 $g$ is time dependent (3.3), which is different from the original ZGRT model. The time-varying growth rates of the bubble and the spike (
 $v_{b}$ and
 $v_{s}$) induced by RT instability are obtained by integrating equation (4.1) over time. The bubble and spike growth rates (
 $v_{b}^{\unicode[STIX]{x0394}t}$ and
 $v_{s}^{\unicode[STIX]{x0394}t}$) at
 $t=\unicode[STIX]{x0394}t$ for all cases are listed in table 3. The predictions of the modified ZGRT model considering the time-varying acceleration imposed on the interface amplitudes are represented with solid lines in figure 6 and agree well with the numerical results in all cases.
Physical parameters in the ZGRT model and ZRM model. Here  $v_{b}^{\unicode[STIX]{x0394}t}$ and
 $v_{s}^{\unicode[STIX]{x0394}t}$ are the bubble and spike growth rates at
 $t=\unicode[STIX]{x0394}t$, respectively;
 $v_{imp}$ is the interface amplitude growth rate calculated with impulsive theory (Richtmyer Reference Richtmyer1960); and
 $\unicode[STIX]{x1D703}$ is the transition coefficient from RT instability to RM instability.

As shown in figure 6(a), at a particular  $t$ during the early stage of the interaction, the interface amplitude decreases as
 $L/\unicode[STIX]{x1D706}$ increases (for a fixed
 $p_{10}$). When
 $L/\unicode[STIX]{x1D706}$ is small,
 $\unicode[STIX]{x0394}t$ is small but
 $\bar{g}$ is large, as illustrated in figure 4(b). This high equivalent body force (
 $g$) imposed on the interface results in a high amplitude growth rate,
 $v$, and consequently a large interface amplitude (4.1). However, when
 $L/\unicode[STIX]{x1D706}$ is fixed, the interface amplitude decreases as
 $p_{10}$ increases at a particular
 $t$ during the early stage of the interaction, as depicted in figure 6(b). When
 $p_{10}$ is large,
 $\unicode[STIX]{x0394}t$ is large but
 $\bar{g}$ is small, as illustrated in figure 4(c), consequently yielding a small interface amplitude (4.1).
When  $t>\unicode[STIX]{x0394}t$, the interface evolution enters the equivalent RM instability stage. The model proposed by Zhang et al. (Reference Zhang, Deng and Guo2018) covers the entire time domain from the early to late stages of RM instability development and is applicable to interfaces with arbitrary fluid density ratio. The predictions of the model have shown good agreement with the data from several independent numerical simulations (Holmes et al. Reference Holmes, Dimonte, Fryxell, Gittings, Grove, Schneider, Sharp, Velikovich, Weaver and Zhang1999; Latini, Schilling & Don Reference Latini, Schilling and Don2007; Latini & Schilling Reference Latini and Schilling2020) and experiments (Collins & Jacobs Reference Collins and Jacobs2002; Jacobs & Krivets Reference Jacobs and Krivets2005). In the ZRM model, the incompressible amplitude growth rate is written as follows:
 $$\begin{eqnarray}v=v_{0}\frac{1+a_{1}(A)(kv_{0})t+a_{2}(A)(kv_{0})^{2}t^{2}}{1+b_{1}(A)(kv_{0})t+b_{2}(A)(kv_{0})^{2}t^{2}+b_{3}(A)(kv_{0})^{3}t^{3}},\end{eqnarray}$$
where
 $$\begin{eqnarray}\displaystyle & \displaystyle a_{i}(A)=\unicode[STIX]{x1D701}_{i}(A)+\unicode[STIX]{x1D702}_{i}(A)b_{1}(A),\quad i=1,2, & \displaystyle\end{eqnarray}$$
 $$\begin{eqnarray}\displaystyle & \displaystyle b_{i}(A)=\unicode[STIX]{x1D70E}_{i}(A)+\unicode[STIX]{x1D714}_{i}(A)b_{1}(A),\quad i=2,3, & \displaystyle\end{eqnarray}$$
 $$\begin{eqnarray}\displaystyle & \displaystyle b_{1}(A)={\textstyle \frac{1}{4}}(c_{1}+c_{2})(3-A^{2})A+{\textstyle \frac{1}{2}}(c_{1}-c_{2}). & \displaystyle\end{eqnarray}$$
 $$\begin{eqnarray}\displaystyle \left.\begin{array}{@{}c@{}}\displaystyle \unicode[STIX]{x1D701}_{1}(A)=-(A+ka_{0}),\unicode[STIX]{x1D701}_{2}(A)=\unicode[STIX]{x1D719}(A)[2A^{3}-5A-(18A^{2}-3)ka_{0}-12A(ka_{0})^{2}],\\ \displaystyle \unicode[STIX]{x1D702}_{1}(A)=1,\unicode[STIX]{x1D702}_{2}(A)=\unicode[STIX]{x1D719}(A)[3+6(ka_{0})^{2}],\\ \displaystyle \unicode[STIX]{x1D70E}_{2}(A)=\unicode[STIX]{x1D719}(A)[8A^{3}-6A^{2}\unicode[STIX]{x1D6FC}(A)-8A+3\unicode[STIX]{x1D6FC}(A)-12A\unicode[STIX]{x1D6FC}(A)ka_{0}],\quad \unicode[STIX]{x1D70E}_{3}(A)=\unicode[STIX]{x1D6FC}(A)\unicode[STIX]{x1D701}_{2}(A),\\ \displaystyle \unicode[STIX]{x1D714}_{2}(A)=\unicode[STIX]{x1D719}(A)3-6A^{2}+6\unicode[STIX]{x1D6FC}(A)A-[12A-6\unicode[STIX]{x1D6FC}(A)]ka_{0},\quad \unicode[STIX]{x1D714}_{3}(A)=\unicode[STIX]{x1D6FC}(A)\unicode[STIX]{x1D702}_{2}(A),\\ \displaystyle \unicode[STIX]{x1D719}(A)=\frac{1}{6\unicode[STIX]{x1D6FC}(A)-A-ka_{0}}>0\quad \text{for}~ka_{0}<0.5,\\ \displaystyle c_{1}=\frac{3}{2}\frac{(1+4ka_{0})[(1-2ka_{0})\sqrt{2+4k^{2}a_{0}^{2}}-(1+4ka_{0})ka_{0}]}{2-8ka_{0}+11(ka_{0})^{2}-24(ka_{0})^{3}},\\ \displaystyle c_{2}=\frac{(1-ka_{0})(1-4ka_{0})}{1+\sqrt{\displaystyle \frac{3+3ka_{0}}{1+3ka_{0}}}(1-4ka_{0})+2(ka_{0})^{2}}.\end{array}\right\} & & \displaystyle \nonumber\\ \displaystyle & & \displaystyle\end{eqnarray}$$
For all cases,  $A=0.672$,
 $ka_{0}=0.209$,
 $a_{1}(A)=1.172$,
 $a_{2}(A)=1.197$,
 $b_{1}(A)=2.053$,
 $b_{2}(A)=2.774$,
 $b_{3}(A)=1.475$,
 $c_{1}(A)=2.219$,
 $c_{2}(A)=0.096$,
 $\unicode[STIX]{x1D701}_{1}(A)=-0.882$,
 $\unicode[STIX]{x1D701}_{2}(A)=-1.989$,
 $\unicode[STIX]{x1D702}_{1}(A)=1$,
 $\unicode[STIX]{x1D702}_{2}(A)=1.552$,
 $\unicode[STIX]{x1D70E}_{2}(A)=-2.222$,
 $\unicode[STIX]{x1D70E}_{3}(A)=-2.451$,
 $\unicode[STIX]{x1D714}_{2}(A)=2.433$,
 $\unicode[STIX]{x1D714}_{3}(A)=1.912$ and
 $\unicode[STIX]{x1D719}(A)=0.475$. The two-point Padé approximant given by (4.4)–(4.6) satisfies all known properties of the incompressible RM instability (Zhang et al. Reference Zhang, Deng and Guo2018). For the incompressible RM instability with a small
 $ka_{0}$,
 $v_{imp}=ka_{0}\unicode[STIX]{x0394}vA$. The linear amplitude growth rate calculated with impulsive theory (Richtmyer Reference Richtmyer1960) is generally taken as
 $v_{0}$, where
 $\unicode[STIX]{x0394}v$ is the jump velocity of the interface and is commonly adopted as the interface velocity (
 $u_{3}$). In this study, it was found that both
 $v_{b}^{\unicode[STIX]{x0394}t}$ and
 $v_{s}^{\unicode[STIX]{x0394}t}$ induced by RT instability are much larger than
 $v_{imp}$, as shown in table 3. In effect,
 $v_{b}^{\unicode[STIX]{x0394}t}/v_{imp}$ ranges from 1.71 to 2.24 and
 $v_{s}^{\unicode[STIX]{x0394}t}/v_{imp}$ ranges from 2.41 to 2.59 for cases SA1–SA9. Setting
 $g=0$ in (4.1) or substituting
 $v_{b/s}^{\unicode[STIX]{x0394}t}$ for
 $v_{0}$ in (4.4) overestimates the interface amplitude growth. To solve this problem,
 $v_{0}$ in the ZRM model is considered as a transition velocity from
 $v_{b/s}^{\unicode[STIX]{x0394}t}$ induced by RT instability to
 $v_{imp}$:
 $v_{0b/0s}=(v_{b/s}^{\unicode[STIX]{x0394}t}-v_{imp})/[1+\unicode[STIX]{x1D703}(t-\unicode[STIX]{x0394}t)]+v_{imp}$, including the initial bubble or spike growth rate (
 $v_{0b/0s}$) under RM instability and the transition coefficient (
 $\unicode[STIX]{x1D703}$). In this study, the values of
 $\unicode[STIX]{x1D703}$ (table 3) are adjusted to fit the curves of the modified ZRM model to the numerical results in all cases (shown as dashed-dotted lines in figure 6). As the interaction time or/and rarefaction wave strength increases,
 $\unicode[STIX]{x1D703}$ decreases.
Moreover, as mentioned earlier, when  $L/\unicode[STIX]{x1D706}$ is small (under a fixed
 $p_{10}$),
 $\unicode[STIX]{x0394}t$ is small (figure 4a). Although the consequently large
 $\bar{g}$ results in a high amplitude growth rate at
 $t=\unicode[STIX]{x0394}t$, the amplitude growth rate decreases as time proceeds (4.4). Therefore, when comparing the cases of different
 $L/\unicode[STIX]{x1D706}$ (under a fixed
 $p_{10}$) at a later time, it can be seen that the amplitude growth rate for a small
 $L/\unicode[STIX]{x1D706}$ has a longer decay time than that for a large
 $L/\unicode[STIX]{x1D706}$, which eventually yields a smaller interface amplitude (see figure 6a). Similar explanations can be applied to the cases in figure 6(b) with different
 $p_{10}$ but the same
 $L/\unicode[STIX]{x1D706}$. In summary, a small
 $L/\unicode[STIX]{x1D706}$ and a small
 $p_{10}$ lead to a small
 $\unicode[STIX]{x0394}t$ and a large
 $\bar{g}$, which in turn result in an initially large interface amplitude that decreases to a small interface amplitude over time.
4.4 Interfacial instability induced by a shock wave and rarefaction waves
Finally, the interface amplitude growth induced by the rarefaction waves and that induced by a shock wave of comparable strength are compared. As shown in figure 7(a), a shock wave is initiated in gas B and then moves towards the SF6/air interface separating gases A and B. Under the shock wave conditions, the initial physical parameters of gases in zone  $1^{\prime }$ and zone
 $5^{\prime }$ correspond to those in zone 1 and zone 5 in the SA3 and SA6
 ${\sim}$ SA9 cases under the rarefaction wave conditions. Correspondingly, the cases under the shock wave conditions are denoted as the
 $\text{SA}3^{\prime }$ and
 $\text{SA}6^{\prime }\sim \text{SA}9^{\prime }$ cases. In the present study, to obtain comparable results for cases under the shock wave condition and their rarefaction wave counterparts, the interface velocity under the shock wave condition is set equal to that under the rarefaction wave condition, i.e.
 $u_{3^{\prime }}=u_{3}$ (figure 7b). The corresponding shock wave Mach number (
 $M_{i}$) is calculated according to 1-D gas dynamics theory (Owczarek Reference Owczarek1964; Han & Yin Reference Han and Yin1992) and listed in table 4 for different cases.
Schematics of the interaction of a shock wave with a single-mode perturbation interface (a) before the shock wave impacts the interface and (b) after the shock wave impacts the interface.

Physical parameters of different cases under the shock wave condition.  $M_{i}$ represents the Mach number of the shock wave and
 $|p_{2^{\prime }}-p_{1^{\prime }}|/p_{1^{\prime }}$ represents the dimensionless pressure gradient of the shock wave under the shock wave condition.

Comparisons of the dimensionless amplitudes of the SF6/air interface induced by the rarefaction waves and a shock wave.

Comparisons of the time-varying SF6/air interface amplitude growth induced by rarefaction waves and by a shock wave are shown in figure 8. First, after the rarefaction waves impact the heavy/light interface, the interface amplitude grows continuously. However, after a shock wave impacts the heavy/light interface, the amplitude first decreases and then increases because of the indirect phase inversion induced by the baroclinic mechanism (Brouillette Reference Brouillette2002). Second, as the rarefaction wave strength increases, the dimensionless interface amplitude growth becomes larger at a later time. In contrast, as the shock wave strength increases, i.e.  $M_{i}$ increases, the dimensionless interface amplitude growth becomes smaller, which agrees with previous studies (Rikanati et al. Reference Rikanati, Oron, Sadot and Shvarts2003; Stanic et al. Reference Stanic, Stellingwerf, Cassibry and Abarzhi2012; Dell, Stellingwerf & Abarzhi Reference Dell, Stellingwerf and Abarzhi2015). For the RM instability with a strong shock, the high pressure behind the shock front inhibits bubble growth (Rikanati et al. Reference Rikanati, Oron, Sadot and Shvarts2003). Meanwhile, after the passage of the shock, a significant part of the shock energy goes to the compression and background motion of the fluids, and only a small part of it is available for interfacial mixing (Stanic et al. Reference Stanic, Stellingwerf, Cassibry and Abarzhi2012; Dell et al. Reference Dell, Stellingwerf and Abarzhi2015). Third, the interface amplitude growth under the rarefaction wave condition is always larger than that under the shock wave condition. In the current study, the initial density gradients along the interface are the same under the rarefaction wave condition and the shock wave condition. However, the initial pressure gradients are different. The dimensionless pressure gradients,
 $|p_{2^{\prime }}-p_{1^{\prime }}|/p_{1^{\prime }}$, calculated with the 1-D gas dynamics theory (Owczarek Reference Owczarek1964; Han & Yin Reference Han and Yin1992) under the shock wave conditions are shown in table 4 for all cases. It is noted in every corresponding case, the dimensionless pressure is larger under the shock wave condition. However, the interface amplitude growth under the rarefaction waves condition is larger and the interaction time between the wave and the interface is longer, which indicates that more vorticity is deposited when the pressure gradient is continuous. In summary, when the post-rarefaction flow velocity equals the post-shock flow velocity, i.e.
 $v_{imp}$ is the same, the interface perturbations under the rarefaction wave condition are more unstable than those under the shock wave condition.
5 Conclusions
Numerical simulations of the interfacial instabilities of a heavy/light interface induced by rarefaction waves are performed using the upwind space–time CE/SE scheme. Ideal rarefaction waves are generated by simulating diaphragm burst in a shock tube. The effects of the distance between the diaphragm and the interface and the pressure ratio between the two sides of the diaphragm, i.e. the interaction time (span) and strength of the rarefaction waves, on the interfacial instability are determined.
The physical parameters before and after the rarefaction waves impact the interface are calculated with 1-D gas dynamics theory (Owczarek Reference Owczarek1964; Velikovich & Phillips Reference Velikovich and Phillips1996). During the interaction of the rarefaction waves with the heavy/light interface, the interface is accelerated and RT instability is induced. The expressions for the interaction time and interface acceleration are also obtained according to 1-D gas dynamics theory. It is found that both the span and the strength of the rarefaction waves influence the interaction time and the interface acceleration. For a perturbed interface, the rarefaction waves with a short interaction time and/or a high strength enhance the interfacial mixing. After the rarefaction waves leave the interface, RM instability dominates the interfacial instability. The ZGRT model proposed by Zhang & Guo (Reference Zhang and Guo2016) and the ZRM model proposed by Zhang et al. (Reference Zhang, Deng and Guo2018) are modified considering the time-varying acceleration and the growth rate transition from RT instability to RM instability, respectively. Each model accurately coincides with the interfacial amplitude growth during the corresponding interfacial instability stage. Last, comparisons of the interface amplitude growth under the rarefaction wave condition and a shock wave condition are investigated, with the same initial gas physical parameters and final interface velocity. As clearly observed, the interface perturbation is more unstable under the rarefaction wave condition than under the shock wave condition due to the higher amount of vorticity deposited by the continuous pressure gradient. In future studies, the interfacial instability of a light/heavy interface induced by rarefaction waves will be investigated.
Acknowledgements
This work was supported by the Natural Science Foundation of China (nos 11772284, 11772329 and 11621202), the Science Challenge Project (no. TZ2016001), the Fundamental Research Funds for the Central Universities and the Research Grants Council of Hong Kong (no. GRF 152151/16E).
Declaration of interests
The authors report no conflict of interest.



