1. Introduction
Participating to energy transfers between scales in the oceans, nonlinear interactions of internal waves have been studied theoretically and experimentally in the case of several wave fields interacting together (e.g. Husseini et al. Reference Husseini, Varma, Dauxois, Joubaud, Odier and Mathur2019) and in the case of self-interacting wave fields (e.g. Baker & Sutherland Reference Baker and Sutherland2020). Self-interaction can be categorised into two separate dual mechanisms (Boury Reference Boury2020): super-harmonic generation (SHG) (e.g. Baker & Sutherland Reference Baker and Sutherland2020; Varma, Chalamalla & Mathur Reference Varma, Chalamalla and Mathur2020; Boury, Peacock & Odier Reference Boury, Peacock and Odier2021a); and generation of sub-harmonics via triadic resonant instability (TRI) (see Dauxois et al. (Reference Dauxois, Joubaud, Odier and Venaille2018) for a review). TRI is characterised by the nonlinear generation of two waves (the sub-harmonic secondary waves) from a wave of larger frequency (the primary wave), forming a triad of monochromatic waves. These waves are in resonance, i.e. their frequencies  $\omega$ and wave vectors
 $\boldsymbol {k}$ are linked through linear relations
 \begin{equation} \omega_0 ={\pm} \omega_1 \pm \omega_2\quad \mathrm{and}\quad \boldsymbol{k_0} ={\pm} \boldsymbol{k_1} \pm \boldsymbol{k_2}, \end{equation}
where  $\omega _0$ and
 $\boldsymbol {k_0}$ (respectively
 $\omega _1$,
 $\omega _2$ and
 $\boldsymbol {k_1}$,
 $\boldsymbol {k_2}$) are related to the primary wave (respectively the secondary waves). Such nonlinear processes have been mostly studied in two-dimensional (
 $2$-D) Cartesian geometry, for monochromatic propagating plane waves and modes (i.e. horizontal standing wave propagating vertically, or the contrary; or fully confined modes, e.g. Yalim, Lopez & Welfert Reference Yalim, Lopez and Welfert2018; Grayer II et al. Reference Grayer II, Yalim, Welfert and Lopez2021). Recent works have explored the implications of a three-dimensional (
 $3$-D) domain, still with plane wave forcings (see e.g. Mora et al. Reference Mora, Monsalve, Brunet, Dauxois and Cortet2021).
Recent studies have focused on linear processes and resonance conditions in other geometries, notably cylindrical (e.g. Lopez et al. Reference Lopez, Hart, Marques, Kittelman and Shen2002; Lopez & Marques Reference Lopez and Marques2018). Experiments conducted with axisymmetric forcings (creating radially decaying wave fields, described by Bessel functions) have confirmed that changing geometry allows for a rich dynamics and a wide variety of interesting nonlinear behaviours (Shmakova & Flór Reference Shmakova and Flór2019; Boury et al. Reference Boury, Peacock and Odier2021a,Reference Boury, Sibgatullin, Ermanyuk, Odier, Joubaud and Dauxoisb). For example, Boury et al. (Reference Boury, Peacock and Odier2021a) provided evidence that super-harmonics can be spontaneously generated through the self-interaction of a monochromatic axisymmetric wave field, in a non-rotating linearly stably stratified fluid. Studying an axisymmetric inertial wave attractor, Sibgatullin et al. (Reference Sibgatullin, Ermanyuk, Xiulin, Maas and Dauxois2017) and Boury et al. (Reference Boury, Sibgatullin, Ermanyuk, Odier, Joubaud and Dauxois2021b) have also shown that orthoradial symmetry breakings are likely to occur with energetic wave fields. The existence of resonant triads has also been explored in the case of the elliptic instability triggered by a precessional forcing (e.g. Eloy, Le Gal & Le Dizés Reference Eloy, Le Gal and Le Dizés2003; Albrecht et al. Reference Albrecht, Blackburn, Lopez, Manasseh and Meunier2015; Lagrange, Meunier & Eloy Reference Lagrange, Meunier and Eloy2016; Albrecht et al. Reference Albrecht, Blackburn, Lopez, Manasseh and Meunier2018). Among recent studies, of particular interest are the focusing experiments performed by Shmakova & Flór (Reference Shmakova and Flór2019) and by Maurer (Reference Maurer2017) with axisymmetric conical wave fields in stably stratified fluids. Using a vertically oscillating torus, Shmakova & Flór (Reference Shmakova and Flór2019) provided experimental evidence of localised TRI triggered at the apex of the internal wave cone (the focusing region). With a similar set-up of an annular wave generator in non-uniform stratification, Maurer (Reference Maurer2017) also observed the generation of sub-harmonics at the convergence point of the  $3$-D wave field, this time accompanied by axisymmetry breaking. While in both cases, frequencies and vertical wavenumbers were found to be resonant, observations differed on the radial resonance condition, seen to be satisfied locally in the case of Shmakova & Flór (Reference Shmakova and Flór2019) but not in the experiments of Maurer (Reference Maurer2017) (in which axisymmetry breaking is incompatible with trivial resonance conditions within a triad of monochromatic waves).
Conceptually, the description of the wave field in terms of monochromatic Bessel functions, imposed by the geometry of the forcing, presents two major difficulties compared with Cartesian plane waves: first, a product of two Bessel functions cannot be expressed as a single Bessel function (unlike for exponential functions describing plane waves), meaning that the nonlinear terms do not produce a priori a monochromatic wave; second, as the zeros of the Bessel functions are not regularly distributed (unlike for sines and cosines), the allowed radial wavenumbers set by the boundary conditions in a confined domain are not evenly spaced, preventing a priori simple algebraic resonances to exist.
The present article delves into these difficulties by investigating analytically the resonance conditions of axisymmetric internal wave triads in confined and unconfined domains, with the support of experimental observations. The domains considered, and the experimental apparatus, are described in § 2 with two configurations: (1) a domain larger than the wave source, in which experiments are stopped before reflected waves play a role so that no boundary conditions apply (‘unconfined’ geometry); and (2) a doubly confined domain, both vertically and radially, in which boundary conditions matter (‘confined’ geometry). The internal wave governing equations and their linear solutions in cylindrical coordinates are derived and discussed in § 3. Sections 4 and 5 then explore theoretically and experimentally the possible resonances for the wave triads in the unconfined and confined domains, respectively. Our conclusions and discussion on the problem are presented in § 6.
2. Methods
2.1. Geometries
We consider two set-ups: the ‘unconfined’ case, in which waves can propagate freely in an infinitely large domain; and the ‘confined’ case, in which the accessible domain is restricted to a vertical cylinder with lateral, top and bottom boundaries. If these ideal domains can easily be considered theoretically, it is important to note that experimentally (with the set-up described below), both the wave generator and the domain have a finite size. If the size of the domain is large enough compared with the size of the wave generator, the boundaries are located sufficiently far from the source and have no impact on the local nonlinear behaviour of the waves within the experimental measuring time, leading to the configuration that we call ‘unconfined’; in contrast, if the size of the domain matches the size of the generator, internal wave modes (‘box modes’) are generated, with the waves constantly reflecting back on the cylindrical boundaries, leading to the configuration we call ‘confined’.
2.2. Numerical tools
For the numerical computations, Bessel functions, Bessel integrals and Fresnel integrals were evaluated using Matlab's functions and integration scheme, providing good estimates of these different quantities. When studying the dependence of Bessel function integrals on radial wave numbers, a resolution of  $10^{-2}\ \mathrm {m}^{-1}$ was used.
2.3. Experimental apparatus
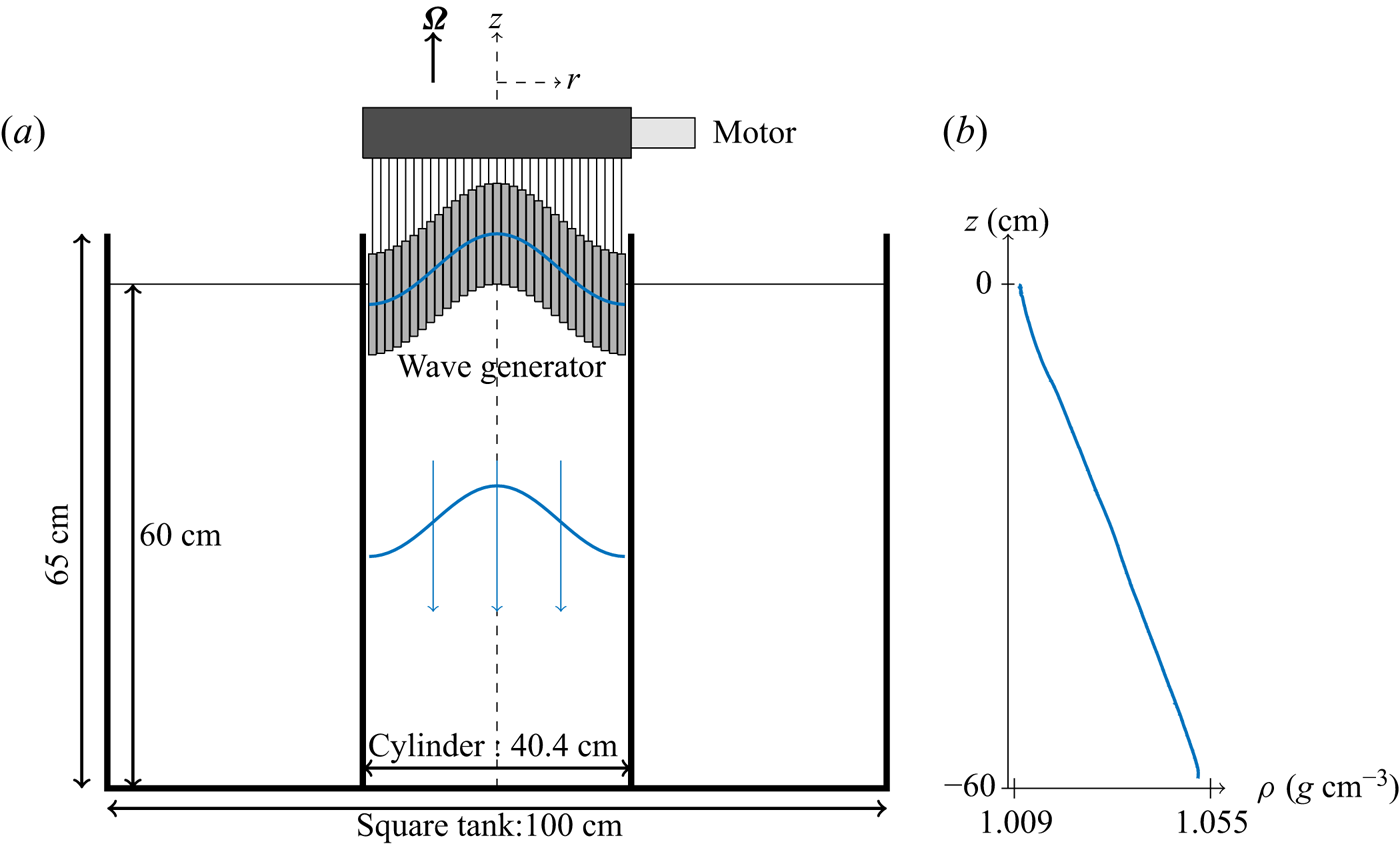
Experiments were conducted using the apparatus described by Boury, Peacock & Odier (Reference Boury, Peacock and Odier2019) and presented in figure 1. A cylindrical tank, enclosed in a  $600\ \mathrm {L}$ square-base acrylic tank, mounted on a rotating table, is filled with salt stratified water by using the double-bucket method to obtain a linear stratification (constant vertical density gradient) (Fortuin Reference Fortuin1960; Oster & Yamamoto Reference Oster and Yamamoto1963). This allows us to consider both the gravity wave case (as in § 5) and the gravito-inertial case (as in § 4). Internal wave fields were produced thanks to an axisymmetric wave generator (Maurer et al. Reference Maurer, Ghaemsaidi, Joubaud, Peacock and Odier2017) located at the top of the tank. This device, adapted from
 $2$-D wave makers (Gostiaux et al. Reference Gostiaux, Didelle, Mercier and Dauxois2006), is constituted of
 $16$ concentric cylinders oscillating vertically at the same tunable frequency and whose amplitudes can be set separately. Its reliability in producing axisymmetric wave fields such as Bessel modes or conical beams has been discussed in previous studies (Maurer et al. Reference Maurer, Ghaemsaidi, Joubaud, Peacock and Odier2017; Boury et al. Reference Boury, Peacock and Odier2019; Boury, Odier & Peacock Reference Boury, Odier and Peacock2020; Boury et al. Reference Boury, Peacock and Odier2021a). An additional acrylic cylinder of the same diameter as the generator is used to confine the wave field, and hence two different sets of experiments were conducted: a first set without this cylindrical boundary (‘unconfined’ case); and a second set with it (‘confined’ case).
(a) Schematic of the experimental apparatus in the ‘confined’ configuration. The inner cylinder can be removed to perform experiments in an ‘unconfined’ domain. Here,  $\boldsymbol {\varOmega }$ is the rotation vector. (b) Example of a linear stratification, from the confined experiments.

Velocity fields were visualised thanks to the particle image velocimetry (PIV) technique. The fluid was seeded with hollow glass spheres and silver coated spheres, both of  $10\ \mathrm {\mu }\mathrm {m}$ diameter. Vertical and horizontal laser sheets were generated with a
 $2\ \mathrm {W}$ Ti:Sapphire laser (wavelength
 $532\ \mathrm {nm}$) and a cylindrical lens. Particle displacements were recorded at
 $4\ \mathrm {Hz}$ using a camera located either on the side of the tank (visualisation in the vertical cross-section) or facing a
 $45^\circ$ mirror placed under the tank (visualisation in the horizontal cross-section). PIV raw images were processed thanks to the CIVx algorithm (Fincham & Delerce Reference Fincham and Delerce2000) to extract the velocity fields.
3. Theory
3.1. Governing equations
In the Boussinesq approximation, the Euler and conservation equations governing an incompressible inviscid rotating (angular velocity  $\varOmega$) stratified fluid (density
 $\rho = \bar {\rho } + \rho '$, with background density
 $\bar {\rho }$ and fluctuations
 $\rho '$) read, in cylindrical coordinates
 $$\begin{gather} \partial_t \boldsymbol{v} + (\boldsymbol{v} \boldsymbol{\cdot} \boldsymbol{\nabla}) \boldsymbol{v} ={-} f \boldsymbol{e_z} \times \boldsymbol{v} - \frac{1}{\rho_0}\boldsymbol{\nabla}P + \boldsymbol{b}, \end{gather}$$
 $$\begin{gather}\partial_t \boldsymbol{b} + (\boldsymbol{v} \boldsymbol{\cdot} \boldsymbol{\nabla}) \boldsymbol{b} ={-} N^2 v_z \boldsymbol{e_z}, \end{gather}$$
 $$\begin{gather}\boldsymbol{\nabla}\boldsymbol{\cdot}\boldsymbol{v} = 0 \end{gather}$$
with  $\boldsymbol {v} = (v_r, v_\theta, v_z)$,
 $\boldsymbol {b} = b\boldsymbol {e_z}$ and
 $P$ the velocity, buoyancy and pressure fields, respectively. Here we define the buoyancy
 $b$ and the buoyancy frequency
 $N$ as
 \begin{equation} b ={-}g \frac{\rho'}{\rho_0} \quad \mathrm{and}\quad N(z) = \sqrt{-\frac{g}{\rho_0}\left.\frac{\partial \bar{\rho}}{\partial z}\right|_z},\end{equation}
with  $\rho _0$ the mean density and the Coriolis frequency
 $f$ as
 $f=2\varOmega$. Introducing the vorticity
 $\boldsymbol {\xi } = \boldsymbol {\nabla }\times \boldsymbol {v}$, (3.1) and (3.2) yield, after some algebra,
 \begin{equation} \partial^2_t \boldsymbol{\nabla}\times\boldsymbol{\xi} + \boldsymbol{\nabla}\times\mathcal{N} (\boldsymbol{v},\boldsymbol{b}) = f \partial_t\partial_z \boldsymbol{\xi} - N^2 \boldsymbol{\nabla}\times [\boldsymbol{\nabla}\times(v_z \boldsymbol{e_z})]\end{equation}
with the nonlinear terms
 \begin{equation} \mathcal{N} (\boldsymbol{v},\boldsymbol{b}) = \boldsymbol{\nabla} \times [\partial_t \left( (\boldsymbol{v} \boldsymbol{\cdot} \boldsymbol{\nabla}) \boldsymbol{v}\right) + (\boldsymbol{v} \boldsymbol{\cdot} \boldsymbol{\nabla}) \boldsymbol{b} ]. \end{equation}
3.2. Solutions of the linear problem
We first consider low amplitude waves, for which nonlinear effects can be neglected. Hence, the linearised equations are obtained by setting the nonlinear term  $\mathcal {N}$ in (3.5) to zero, leading to the following time evolution equation:
 \begin{equation} \partial^2_t \boldsymbol{\nabla}\times\boldsymbol{\xi} = f \partial_t\partial_z \boldsymbol{\xi} - N^2\boldsymbol{\nabla}\times [\boldsymbol{\nabla}\times(v_z \boldsymbol{e_z})].\end{equation}
Using the volume conservation equation (3.3), the curl of the vorticity simply writes in terms of the Laplacian of the velocity. Equation (3.7) writes
 \begin{equation} \partial^2_t \varDelta^\odot \boldsymbol{v} ={-} f\partial_t\partial_z \boldsymbol{\xi} + N^2 \boldsymbol{\nabla}\times [\boldsymbol{\nabla}\times(v_z \boldsymbol{e_z})],\end{equation}
in terms of the velocities  $v_r$,
 $v_\theta$ and
 $v_z$. The vectorial cylindrical Laplacian
 $\varDelta ^\odot$ is defined involving a coupling between the radial and orthoradial velocities
 $v_r$ and
 $v_\theta$ as
 \begin{equation} \varDelta^\odot
\boldsymbol{v} = \begin{bmatrix} \Delta v_r
-\dfrac{1}{r^2} \left( v_r + 2 \partial_\theta v_\theta
\right) \\ \Delta v_\theta -\dfrac{1}{r^2} \left( v_\theta
- 2 \partial_\theta v_r \right)\\ \Delta v_z
\end{bmatrix},\quad \mathrm{with}\ \Delta v =
\frac{1}{r}\partial_r \left( r \partial_r v \right) +
\frac{1}{r^2} \partial^2_\theta v + \partial^2 _z v.
\end{equation}
Therefore, the linearisation of (3.5) yields
 $$\begin{gather} \partial_t^2 \Delta v_z + f^2 \partial^2_z v_z + N^2 \left(\frac{1}{r}\partial_r (r \partial_r v_z) + \frac{1}{r^2}\partial^2_\theta v_z \right) = 0, \end{gather}$$
 $$\begin{gather}\partial_t^2 \Delta v_r -\frac{1}{r^2}\partial_t^2\left( v_r + 2\partial_\theta v_\theta \right) + f \partial_t \partial_z \left( \frac{1}{r}\partial_\theta v_z - \partial_z v_\theta \right) - N^2 \partial_r \partial_z v_z = 0, \end{gather}$$
 $$\begin{gather}\partial_t^2 \Delta v_\theta -\frac{1}{r^2}\partial_t^2\left( v_\theta - 2\partial_\theta v_r \right) + f \partial_t \partial_z \left( \partial_z v_r - \partial_r v_z \right) - N^2 \frac{1}{r}\partial_\theta \partial_z v_z = 0. \end{gather}$$
The analytical solutions of this system are called Kelvin modes, and are explicitly
 \begin{gather} v_r (r, \theta , z, t) = {\rm i} \frac{m v_z^0}{4\;l \omega}\left[ (f-2\omega) J_{p-1} (l r) + (f + 2\omega) J_{p+1} (l r) \right] \nonumber\\ \qquad\quad\times\, \exp({{\rm i} (\omega t - m z - p \theta)}) + \mathrm{c.c.}, \end{gather}
 \begin{gather} v_\theta (r, \theta , z, t) = \frac{m v_z^0}{2\;l \omega} \left[ (2 f-\omega) J_{p-1} (l r) - (2 f + \omega) J_{p+1} (l r) \right] \nonumber\\ \qquad\quad\times\, \exp({{\rm i} (\omega t - m z - p \theta)}) + \mathrm{c.c.}, \end{gather}
 $$\begin{gather} v_z (r, \theta , z, t) = v_z^0 J_p (l r) \exp({{\rm i} (\omega t - m z - p \theta)}) + \mathrm{c.c.}, \end{gather}$$
 $$\begin{gather}b (r,\theta,z,t) = {\rm i}\frac{N^2 v_z^0}{\omega} J_p (l r) \exp({{\rm i} (\omega t - m z - p \theta)}) + \mathrm{c.c.}, \end{gather}$$
 $$\begin{gather}P (r,\theta,z,t) ={=} \frac{\rho_0\;m (f^2 - \omega^2) v_z^0}{l^2 \omega} J_p (l r) \exp({{\rm i} (\omega t - m z - p \theta)}) + \mathrm{c.c.}, \end{gather}$$
with  $J_j$ a Bessel function of order
 $j\in \mathbb {Z}$, and with
 $\omega$ the wave frequency, and
 $l\in \mathbb {R}$,
 $m\in \mathbb {R}$ and
 $p\in \mathbb {Z}$ the radial, vertical and azimuthal wavenumbers, respectively. Note that
 $l$ and
 $m$ are spatial wavenumbers (
 $\mathrm {m}^{-1}$), whereas
 $p$ is an angular wavenumber (
 $\mathrm {rad}^{-1}$). Other functions also satisfy (3.10), (3.11) and (3.12), but have divergences either for
 $r\rightarrow 0$ or
 $r\rightarrow +\infty$ (Olver et al. Reference Olver, Lozier, Boisvert and Clark2010), and are thus disregarded. A more thorough description of these modes is provided by Guimbard (Reference Guimbard2008) and Boury (Reference Boury2020).
In the case of non-rotating flows ( $f=0$) that, for the sake of simplicity, will be considered in the analytical discussion from now on, the system (3.13)–(3.17) can be further simplified and we deduce the polarisation relations
 \begin{equation} v_r ={-}{\rm i}\frac{m}{l^2} \partial_r v_z,\quad v_\theta ={-}\frac{mp}{l^2 r} v_z,\quad b = {\rm i}\frac{N^2}{\omega} v_z\quad \mathrm{and}\quad P = \frac{\rho_0 (N^2 - \omega^2)}{\omega m} v_z. \end{equation}
3.3. Nonlinearities and sub-harmonics generation
To investigate internal wave resonant triads, we now discuss the fully nonlinear equations and compute explicitly the nonlinear terms in the case of three monochromatic Kelvin modes. Theoretical derivations are now conducted in the non-rotating case to make the calculus more tractable and pedagogical; note that the subsequent discussion is not changed if we consider rotating flows. Setting  $f=0$, the system of (3.1)–(3.3) is equivalent, once expanded, to
 $$\begin{gather} \partial_t v_r + \frac{1}{\rho_0} \partial_r P ={-} (\boldsymbol{v} \boldsymbol{\cdot} \boldsymbol{\nabla}) v_r, \end{gather}$$
 $$\begin{gather}\partial_t v_\theta + \frac{1}{r \rho_0}\partial_\theta P ={-} (\boldsymbol{v} \boldsymbol{\cdot} \boldsymbol{\nabla}) v_\theta, \end{gather}$$
 $$\begin{gather}\partial_t v_z + \frac{1}{\rho_0}\partial_z P - b ={-} (\boldsymbol{v} \boldsymbol{\cdot} \boldsymbol{\nabla}) v_z, \end{gather}$$
 $$\begin{gather}\partial_t b + N^2 v_z ={-} (\boldsymbol{v} \boldsymbol{\cdot} \boldsymbol{\nabla}) b, \end{gather}$$
 $$\begin{gather}\boldsymbol{\nabla}\boldsymbol{\cdot}\boldsymbol{v} = 0. \end{gather}$$
In the general case, the triadic wave field can be decomposed into
 \begin{equation} v_r = \sum_{j=1}^3 v_{r,j},\quad v_\theta = \sum_{j=1}^3 v_{\theta,j},\quad v_z = \sum_{j=1}^3 v_{z,j},\quad b = \sum_{j=1}^3 b_{j}\quad \mathrm{and}\quad P = \sum_{j=1}^3 P_{j},\end{equation}
where a canonical Kelvin mode, labelled  $j$, is defined as
 $$\begin{gather} v_{r,j} (r,\theta,z,t) = v_{r,j}^0(t) J_{p_j}' (l_j r) \exp({{\rm i}(\omega_j t - m_j z - p_j \theta)}) + \mathrm{c.c.}, \end{gather}$$
 $$\begin{gather}v_{\theta,j} (r,\theta,z,t) = v_{\theta,j}^0(t) \frac{J_{p_j} (l_j r)}{l_j r} \exp({{\rm i}(\omega_j t - m_j z - p_j \theta)}) + \mathrm{c.c.}, \end{gather}$$
 $$\begin{gather}v_{z,j} (r,\theta,z,t) = v_{z,j}^0(t) J_{p_j} (l_j r) \exp({{\rm i}(\omega_j t - m_j z - p_j \theta)}) + \mathrm{c.c.}, \end{gather}$$
 $$\begin{gather}b_j (r,\theta,z,t) = b_{j}^0(t) J_{p_j} (l_j r) \exp({{\rm i}(\omega_j t - m_j z - p_j \theta)}) + \mathrm{c.c.}, \end{gather}$$
 $$\begin{gather}P_j (r,\theta,z,t) = P_{j}^0(t) J_{p_j} (l_j r) \exp({{\rm i}(\omega_j t - m_j z - p_j \theta)}) + \mathrm{c.c.}, \end{gather}$$
where, to allow energetic exchanges between the modes, the amplitudes  $v_{r,j}^0$,
 $v_{\theta,j}^0$,
 $v_{z,j}^0$,
 $b_j^0$ and
 $P_j^0$ are slowly varying in time, yet still uniform in space. Equations (3.19)–(3.23) then constitute a system with four nonlinear equations where, introducing the triad (3.24a–e) and the explicit writing of the fields (3.25)–(3.29), the linear left-hand side can be written as
 \begin{gather} \partial_t v_r + \frac{1}{\rho_0} \partial_r P = \sum_{j=1}^3 \left[\partial_t v_{r,j}^0 + {\rm i} \omega_j v_{r,j}^0 + \frac{l_j}{\rho_0} P_j^0 \right] J_{p_j}'(l_j r) \exp({{\rm i}(\omega_j t - m_j z - p_j \theta)}) + \mathrm{c.c.}, \end{gather}
 \begin{gather} \partial_t v_\theta + \frac{1}{r \rho_0}\partial_\theta P = \sum_{j=1}^3 \left[\partial_t v_{\theta,j}^0 + {\rm i} \omega_j v_{\theta,j}^0 - {\rm i} \frac{p_j l_j}{\rho_0} P_j^0 \right] \frac{J_{p_j} (l_j r)}{l_j r} \nonumber\\ \qquad\qquad\qquad\qquad \times\,\exp({{\rm i}(\omega_j t - m_j z - p_j \theta)})+ \mathrm{c.c.}, \end{gather}
 \begin{gather} \partial_t v_z + \frac{1}{\rho_0}\partial_z P - b = \sum_{i=j}^3 \left[\partial_t v_{z,j}^0 + {\rm i}\omega_j v_{z,j}^0 - {\rm i} \frac{m_j}{\rho_0} P_j^0 \right] J_{p_j} (l_j r) \nonumber\\ \qquad\qquad\qquad\qquad\quad \times\, \exp({{\rm i}(\omega_j t - m_j z - p_j \theta)}) + \mathrm{c.c.}, \end{gather}
 \begin{gather} \partial_t b + N^2 v_z = \sum_{i=j}^3 \left[ \partial_t b_{j}^0 + {\rm i}\omega_j b_j^0 + N^2 v_{z,j}^0 \right] J_{p_j} (l_j r) \exp({{\rm i}(\omega_j t - m_j z - p_j \theta)}) + \mathrm{c.c.} \end{gather}
At this point, it is worth noting that (3.30)–(3.33) show a well-established structure for the radial dependence (namely (3.30)  $\propto J_{p_j}'(r)$, (3.31)
 $\propto J_{p_j} (r) / r$, and (3.32) and (3.33)
 $\propto J_{p_j}(r)$). To be able to compute scalar products involving Bessel functions (see next section), we write the radial dependences from (3.30) and (3.31) only in terms of a single Bessel function
 $\propto J_{p_j}(r)$ as in (3.32) and (3.33) by integrating (3.30) and by multiplying (3.31) by
 $r$; the linear terms are then written as
 \begin{gather} \int \left(\partial_t v_r + \frac{1}{\rho_0} \partial_r P \right) \text{d} r = \sum_{j=1}^3 \left[\partial_t v_{r,j}^0 + {\rm i} \frac{\omega_j}{l_j} v_{r,j}^0 + \frac{1}{\rho_0} P_j^0 \right] J_{p_j}(l_j r) \nonumber\\ \qquad\qquad\qquad\qquad\qquad\quad \times\,\exp({{\rm i}(\omega_j t - m_j z - p_j \theta)}) + \mathrm{c.c.}, \end{gather}
 \begin{gather} r\left(\partial_t v_\theta + \frac{1}{r \rho_0}\partial_\theta P\right) = \sum_{j=1}^3 \left[\partial_t v_{\theta,j}^0 + {\rm i} \frac{\omega_j}{l_j} v_{\theta,j}^0 - {\rm i} \frac{p_j}{\rho_0} P_j^0 \right] J_{p_j} (l_j r) \nonumber\\ \qquad\qquad\qquad\qquad\quad\times\, \exp({{\rm i}(\omega_j t - m_j z - p_j \theta)}) +\mathrm{c.c.}, \end{gather}
 \begin{gather} \partial_t v_z + \frac{1}{\rho_0}\partial_z P - b = \sum_{i=j}^3 \left[\partial_t v_{z,j}^0 + {\rm i}\omega_j v_{z,j}^0 - {\rm i} \frac{m_j}{\rho_0} P_j^0 \right] J_{p_j} (l_j r) \nonumber\\ \qquad\qquad\qquad\qquad\quad\times\,\exp({{\rm i}(\omega_j t - m_j z - p_j \theta)}) + \mathrm{c.c.}, \end{gather}
 \begin{gather} \partial_t b + N^2 v_z = \sum_{i=j}^3 \left[ \partial_t b_{j}^0 + {\rm i}\omega_j b_j^0 + N^2 v_{z,j}^0 \right] J_{p_j} (l_j r) \exp({{\rm i}(\omega_j t - m_j z - p_j \theta)}) + \mathrm{c.c.} \end{gather}
Following the same techniques that have been used to investigate Cartesian TRI, we consider a time scale separation in which the amplitude variations have a different temporal scale than the wave field itself, i.e.  $\partial _t v_z^0 \ll \omega v_z^0$. At first order, we recover the polarisation relations and the linear solution, whereas at second order, we obtain equations on the amplitudes involving the nonlinear (second order) interaction terms of (3.19)–(3.23). This scale separation also imposes that all amplitudes have the same temporal variation, i.e.
 $\partial _t v_{z,j}^0 \propto \partial _t v_{r,j}^0\propto \partial _t v_{\theta,j}^0\propto \partial _t b_{j}^0$. The study of the nonlinear terms can therefore be reduced to the sole investigation of the effect of the nonlinear terms on
 $v_{z,j}^0$. To compute the nonlinear terms, we consider a triad of Kelvin modes, defined through the vertical velocity as follows:
 \begin{align} v_z (r,\theta,z,t) = \sum_{i=1}^3 v_{z,i}(r,\theta,z,t) = \sum_{i=1}^3 v_{z,i}^0 (t) J_{p_i} (l_i r) \exp({{\rm i}(\omega_i t - m_i z - p_i \theta)} + \mathrm{c.c.} \end{align}
Using the polarisation relations, the choice of vertical velocity is sufficient to describe the whole velocity and buoyancy fields. As detailed in Appendix A, the computation of the nonlinear terms shows that  $(\boldsymbol {v} \boldsymbol {\cdot } \boldsymbol {\nabla }) v_z$ determines the structure of the sub-harmonics, and we will therefore restrict our study to this term. We will write
 \begin{equation} - (\boldsymbol{v}
\boldsymbol{\cdot} \boldsymbol{\nabla}) v_z = \sum_{i=1}^3
\sum_{j=1}^3 -{\rm i}\frac{v_{z,i}^0 v_{z,j}^0}{l_j}
\left[\frac{M_{ij}}{2} \left({\mathsf{J}}_{p_i
-1}^{p_j+1} + {\mathsf{J}}_{p_i +1}^{p_j-1} \right)
- M_{ji} {\mathsf{J}}_{p_i}^{p_j}\right]
\varPhi_{ij}, \end{equation}
where the azimuthal, vertical and temporal dependences are included in
 \begin{equation} \varPhi_{ij} \equiv \varPhi_{ij} (\theta,z,t) = \exp({{\rm i}\left[(\omega_i \pm \omega_j) t - (m_i \pm m_j) z - (p_i \pm p_j) \theta\right]}), \end{equation}
and where, for the sake of clarity, we have defined the wavenumber product  $M_{ij} = m_i l_j$ and introduced the radially dependent quantity
 \begin{equation} {\mathsf{J}}_{p_i}^{p_j} \equiv {\mathsf{J}}_{p_i}^{p_j} (r) = J_{p_i}(l_i r) J_{p_j} (l_j r). \end{equation}
To summarise, the linear left-hand side is a sum of three monochromatic waves, corresponding to a single frequency and a single spatial configuration, whereas the nonlinear right-hand side is a sum of interacting waves. In general, these terms are non-zero even for the self-interaction term, and thus can act as a second-order forcing term on the linear part of the equations (similarly to what has been discussed in Boury et al. Reference Boury, Odier and Peacock2020, Reference Boury, Peacock and Odier2021a). This is relevant to triad formation: two sub-harmonic wave fields can grow out of noise with energy input from a monochromatic forcing, potentially leading to TRI or parametric sub-harmonic instability (PSI). A more thorough discussion is provided in the next sections.
4. Unconfined domains: triadic resonant instability
4.1. Physical domain and projection
To investigate the forcing term created by the nonlinear interactions, we generalise the projection method used to derive resonance relations in  $2$-D Cartesian TRI (Bourget Reference Bourget2014; Maurer Reference Maurer2017). We have shown previously that, in the linear theory, Kelvin modes (i.e. the velocity, buoyancy and pressure fields solutions of the linear equations) can be entirely determined by the vertical velocity field,
 $v_z$. Given different
 $4$-uplets
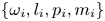 $\lbrace \omega _i, l_i, p_i, m_i \rbrace$ of frequencies and wavenumbers, the corresponding vertical velocity fields
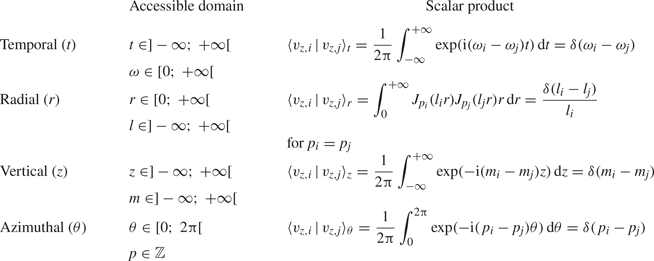
 $\lbrace v_{z,i} \rbrace$ (defined by (3.38)) form a family of mutually orthogonal functions with the spatio-temporal Fourier–Hankel scalar product defined in table 1. We note
 $\langle v_{z,i} \,|\, v_{z,j} \rangle$ the complete scalar product of two fields (operated for
 $(t,r,\theta,z) \in \mathbb {R} \times \mathbb {R^+} \times [0;\ 2{\rm \pi} ] \times \mathbb {R}$).
Scalar products to consider in an unconfined domain.

Here, we should point out an additional difficulty compared with the Cartesian case: the projections are different for the temporal and vertical variables (integrals over  $\mathbb {R}$), the azimuthal variable (integral on
 $[0;\ 2{\rm \pi} ]$ due to the
 $2{\rm \pi}$-periodicity) and the radial coordinate (integral on
 $\mathbb {R}^+$, with orthogonality of Bessel functions). Note that to compute the radial scalar product of the
 $v_r$,
 $v_\theta$ and
 $v_z$ equations, we have to write their
 $r$-dependence in terms of Bessel functions only. Considering (3.21) on
 $v_z$, its projection onto a monochromatic solution of norm
 $1$,
 $v_{z,j}^\ast$, defined by (3.27) as
 \begin{equation} v_{z,j}^\ast (r,\theta,z,t) = J_{p_j} (l_j r) \exp({{\rm i}(\omega_j t - m_j z - p_j \theta)}), \end{equation}
leads to
 \begin{equation} \left\langle \left. \partial_t v_z + \frac{1}{\rho_0}\partial_z P - b\right\vert v_{z,j}^\ast \right\rangle = \partial_t v_{z,j}^0 = \langle \left. - \left( \boldsymbol{v}\boldsymbol{\cdot}\boldsymbol{\nabla} \right) v_z \right\vert v_{z,j}^\ast \rangle.\end{equation}
Since the temporal variations of the amplitudes present in the linear terms are at a different time scale than the oscillatory part, they appear as uncoupled and the scalar product does not affect their derivatives. We conclude, from (4.2), that the slow-varying amplitude terms can be fed by nonlinear processes if and only if the scalar product of the corresponding nonlinear left-hand side is non-zero.
4.2. Frequency resonance
Performing the temporal scalar product on the nonlinear terms, we obtain a delta function whose argument is a linear combination of three frequencies. As the frequencies are non-zero, the only resonant term (i.e. non-zero) is obtained when the resonance condition in frequency is satisfied, meaning
 \begin{equation} \omega_0 ={\pm} \omega_1 \pm \omega_2. \end{equation}
For sub-harmonics, both  $\omega _1$ and
 $\omega _2$ are smaller than
 $\omega _0$; but the existence of triads involving super-harmonics are also allowed by this relation. A particular case exists when
 $\omega _1 = \omega _2 = \omega _0 / 2$, called PSI, with several experimental and in situ oceanic observations.
4.3. Vertical and azimuthal resonances
Similarly, the vertical and azimuthal scalar products yield resonance conditions in vertical and azimuthal wavenumbers, namely
 $$\begin{gather} m_0 ={\pm} m_1 \pm m_2, \end{gather}$$
 $$\begin{gather}p_0 ={\pm} p_1 \pm p_2. \end{gather}$$
There is, however, an important difference between  $m$ and
 $p$: the vertical wavenumber
 $m$ is a continuous parameter that can take any value in
 $\mathbb {R}$, whereas the azimuthal wavenumber
 $p$ is, because of the
 $2{\rm \pi}$-periodicity, a discrete parameter taken in
 $\mathbb {Z}$.
4.4. Radial resonance
The radial scalar products are more difficult to evaluate, as they involve integrals over a product of three Bessel functions of different orders and different arguments. To simplify the discussion, we define the following integral:
 \begin{equation} \forall\ (h,i,j)\in \mathbb{N}^3,\quad \varXi_{hij} = \int _0 ^{+\infty} J_h (l_0 r) J_i (l_1 r) J_j (l_2 r) r \, \text{d} r. \end{equation}
Before delving into the general case, we will study two peculiar examples. The first case is the triadic interaction of three axisymmetric modes; the second case involves a symmetry breaking and leads to two cylindrical modes that are counter-rotating in the horizontal plane, forced by an axisymmetric primary wave. In both cases, one of the secondary waves (labelled  $2$) is computed using the nonlinear interaction of the primary wave (labelled
 $0$) with the other secondary wave (labelled
 $1$), which naturally breaks the symmetry between them; the calculus, however, gives the same results when switching the secondary waves
 $1$ and
 $2$.
4.4.1. Radial resonance: axisymmetric case  $p_0 = p_1 = p_2 = 0$

We first consider the case of a triad with  $p_0 = p_1 = p_2 = 0$, i.e. where the axisymmetric primary wave is in resonance with two axisymmetric secondary waves. Introducing a constant coefficient
 $A_z$, the radial scalar product of the nonlinear term is
 \begin{equation} \left\langle- (\boldsymbol{v} \boldsymbol{\cdot} \boldsymbol{\nabla}) v_z\right\rangle_r = A_{z} \left[ M_{01} \varXi_{110} + M_{10} \varXi_{000} \right]. \end{equation}
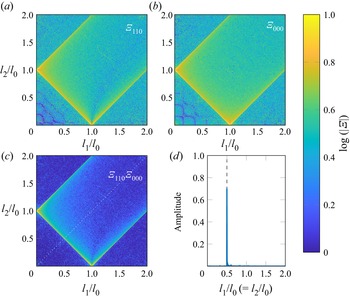
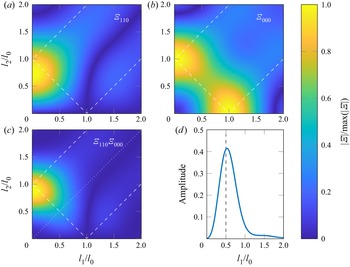
The coefficients  $\varXi _{hij}$ involved in (4.7) can be numerically investigated. Figure 2 presents colourmaps of the logarithm of the absolute value of these coefficients
 $|\varXi _{hij}|$ for
 $R l_0$ between
 $0$ and
 $1900$ with (a)
 $|\varXi _{110}|$; (b)
 $|\varXi _{000}|$; and (c) the product
 $|\varXi _{110}\varXi _{000}|$. All quantities are plotted as a function of
 $l_1/l_0$ and
 $l_2/l_0$, with
 $l_1/l_0$ and
 $l_2/l_0$ going from
 $0$ to
 $2$, and the colourbar saturates at
 $1$. The plots can be extended by symmetry to obtain the complete diagram for negative values of
 $l_1/l_0$ and
 $l_2/l_0$. Note that these quadrants are, in general, not symmetrical with respect to the bissectrix: switching the wavenumbers
 $l_1$ and
 $l_2$ yields the same plot if and only if the corresponding indices of the associated Bessel functions in
 $\varXi _{hij}$ are the same, i.e. if we can write
 $\varXi _{hhj}$ as in figures 2(a) and 2(b) with
 $\varXi _{000}$ and
 $\varXi _{110}$. As clearly identified in figure 2(c) (and less clearly in figure 2(a,b)), the only cases for which the
 $\varXi _{hij}$ integrals are non-zero correspond to the lines
 $l_0 \pm l_1 \pm l_2 = 0$, i.e. along the possible radial resonance relations. Figure 2(d) shows the value of
 $|\varXi _{000}\varXi _{110}|$ along the first bissectrix (dotted line in figure 2c) and illustrates that a maximum is reached when the resonance relation is reached, i.e.
 $l_1 / l_0 = l_2/l_0 = 0.5$.
Colourmaps of the logarithm of the coefficients  $|\varXi _{hij}|$ as a function of wavenumber ratios
 $l_1/l_0$ and
 $l_2/l_0$, in the case
 $p_0 = p_1 = p_2 = 0$, with (a)
 $\log (|\varXi _{110}|)$, (b)
 $\log (|\varXi _{000}|)$ and (c) logarithm of the product of these two coefficients. Dashed lines show the locations of
 $l_0 \pm l_1 \pm l_2 = 0$. (d) Profile of
 $|\varXi _{110}\varXi _{000}|$ along the first bissectrix (dotted line in panel (c)).

4.4.2. Radial resonance: non-axisymmetric case $p_0 = 0$, $p_1=1$ and $p_2=-1$


We now consider a second case study involving a symmetry breaking, with  $p_0 = 0$,
 $p_1=1$ and
 $p_2=-1$. This triad corresponds to an axisymmetric primary wave in resonance with two non-axisymmetric (i.e. cylindrical) secondary waves. In the horizontal plane, one of the secondary waves is rotating clockwise while the other one is rotating anti-clockwise. Following the same reasoning as previously, the radial scalar product of the nonlinear term is written as
 \begin{equation} \left\langle- (\boldsymbol{v} \boldsymbol{\cdot} \boldsymbol{\nabla}) v_z\right\rangle_r = A_{z} \left[ \frac{ M_{01}}{2}( \varXi_{101} - \varXi_{121}) - M_{10} \varXi_{011} \right]. \end{equation}
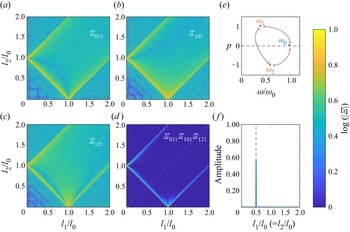
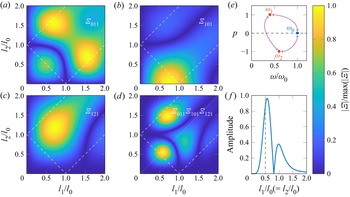
As for the previous case study, we conduct a numerical investigation of the different terms  $|\varXi _{hij}|$ involved in (4.8). Figure 3 presents colourmaps of the logarithm of the absolute value of these coefficients for (a)
 $|\varXi _{011}|$; (b)
 $|\varXi _{101}|$; (c)
 $|\varXi _{121}|$; and (d) the product
 $|\varXi _{011}\varXi _{101}\varXi _{121}|$. Again, the numerical integration is performed for
 $R l_0$ between
 $0$ and
 $1900$, and all quantities are plotted as a function of
 $l_1/l_0$ and
 $l_2/l_0$, with
 $l_1/l_0$ and
 $l_2/l_0$ going from
 $0$ to
 $2$. As in the fully axisymmetric case, the coefficients (and their product) are maximal along the lines corresponding to the radial resonance relation, and almost zero everywhere else.
Colourmaps of the logarithm of the coefficients  $|\varXi _{hij}|$ as a function of wavenumber ratios
 $l_1/l_0$ and
 $l_2/l_0$, in the case of
 $p_0 = 0$,
 $p_1 = 1$ and
 $p_2 = -1$, with (a)
 $\log (|\varXi _{011}|)$, (b)
 $\log (|\varXi _{101}|)$, (c)
 $\log (|\varXi _{121}|)$ and (d) logarithm of the product of the three coefficients. Dashed lines show the locations of
 $l_0 \pm l_1 \pm l_2 = 0$. (e) Schematic representation of the triad. ( f) Profile of the product
 $|\varXi _{011}\varXi _{101}\varXi _{121}|$ along the first bissectrix (dotted line in panel (d)).

4.4.3. Asymptotics
From the two numerical case studies of sub-harmonics, we empirically conjecture that the existence of non-vanishing  $\varXi _{hij}$ coefficients in the nonlinear part of the wave equations leads to a radial resonance condition of the form
 $l_0 = \pm l_1 \pm l_2$. A possible way to investigate this further is to use an asymptotic development of the Bessel functions. At a given radial wavenumber
 $l$, for large values of
 $l r$, the functions
 $J_n$ can be approximated by the functions
 $\tilde {J}_n$ defined as follows (Olver et al. Reference Olver, Lozier, Boisvert and Clark2010):
 \begin{equation} \forall\ n \in \mathbb{N},\enspace \forall\ r \in \mathbb{R}^*,\quad \tilde{J}_n(lr) = \sqrt{\frac{2}{{\rm \pi} lr}} \cos \left( lr -\frac{\rm \pi}{2}\left(n+\frac{1}{2}\right) \right),\end{equation}
from which we deduce, notably, for the zeroth- and first-order Bessel functions describing the axisymmetric wave field
 \begin{align} \forall\ r \in \mathbb{R}^*,\quad \tilde{J}_0 (lr) = \sqrt{\frac{2}{{\rm \pi} l r}} \cos \left(lr-\frac{\rm \pi}{4}\right) \quad \mathrm{and}\quad \tilde{J}_1 (lr) = \sqrt{\frac{2}{{\rm \pi} l r}} \sin \left(lr-\frac{\rm \pi}{4}\right). \end{align}
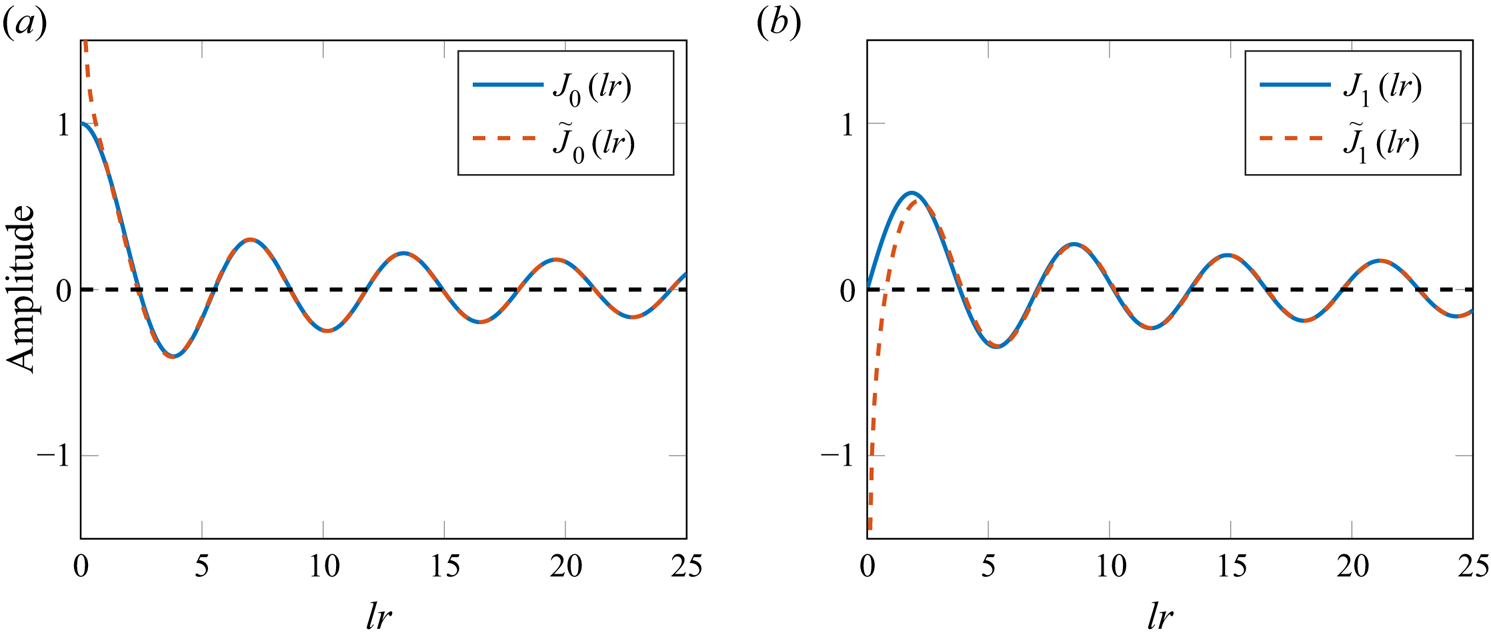
These approximations are presented in figures 4(a) and 4(b), respectively. As can be seen in these two plots, the values of  $l r$ for which the approximation (4.9) is valid (less than 4 % difference) is
 $l r>1$ for
 $J_0$ and
 $l r> 2$ for
 $J_1$. Compared with our experimental configuration of a radial mode
 $1$ with
 $l=19\ \mathrm {m}^{-1}$, this means that the profile is very well approximated by this decaying cosine for
 $r>15\ \mathrm {cm}$, and sooner for higher order radial modes.
Plots of the functions (a)  $J_0$ and (b)
 $J_1$ (solid lines) with the asymptotic approximation
 $\tilde {J}_0$ and
 $\tilde {J}_1$ (dashed lines).

The coefficients  $\varXi _{hij}$ previously defined in (4.6) can be rewritten, using this asymptotic formulation, as an improper integral
 \begin{equation} \forall\ (h,i,j)\in \mathbb{N}^3,\quad \varXi_{hij} \simeq \lim_{\varepsilon\rightarrow 0} \int _\varepsilon ^{+\infty} \tilde{J}_h (l_0 r) \tilde{J}_i (l_1 r) \tilde{J}_j (l_2 r) r \, \text{d} r, \end{equation}
whose integrands are diverging in  $0$ (see dotted curves in figure 4), while remaining integrable (which is why, formally, the limit
 $\varepsilon$ approaching
 $0$ is needed). Using the definition from (4.9) and trigonometric relations, we find that the coefficients
 $\varXi _{hij}$ can be expressed as a sum of integrals over approximated Bessel functions
 \begin{gather} \begin{gathered}\forall\ (h,i,j)\in \mathbb{N}^3, \nonumber\\ \quad \varXi_{hij} \simeq \varGamma(1,h,i,j) + \varGamma(0,h,i,-j) + \varGamma (0,h,-i,j) + \varGamma({-}1,h,-i,-j), \end{gathered}\end{gather}
where, given  $(a,b,c,d)\in \mathbb {Z}^4$, we write
 \begin{equation} \varGamma (a,b,c,d) = \lim_{\varepsilon\rightarrow 0}\int _\varepsilon^{+\infty} \frac{1}{2{\rm \pi}} \sqrt{\frac{l_{bcd}}{l_0 l_1 l_2}} {\tilde{J}_{a+b+c+d} (l_{bcd} r)} \,\text{d} r, \end{equation}
with, using the  $\mathrm {sign}$ function, the radial interaction wavenumber
 $l_{bcd}$, i.e.
 \begin{equation} l_{bcd} = \mathrm{sign}(b) l_0 + \mathrm{sign}(c) l_1 + \mathrm{sign}(d) l_2. \end{equation}
Note that, thanks to the symmetric writing of  $\varGamma$, the four
 $\varGamma$ integrals involved in (4.12) are linked to four different radial interaction wavenumbers
 $l_{abc}$. Interestingly, the cases
 $l_{bcd}=0$ correspond to the four possible triads that can be obtained through the formula
 $l_0 \pm l_1 \pm l_2 = 0$.
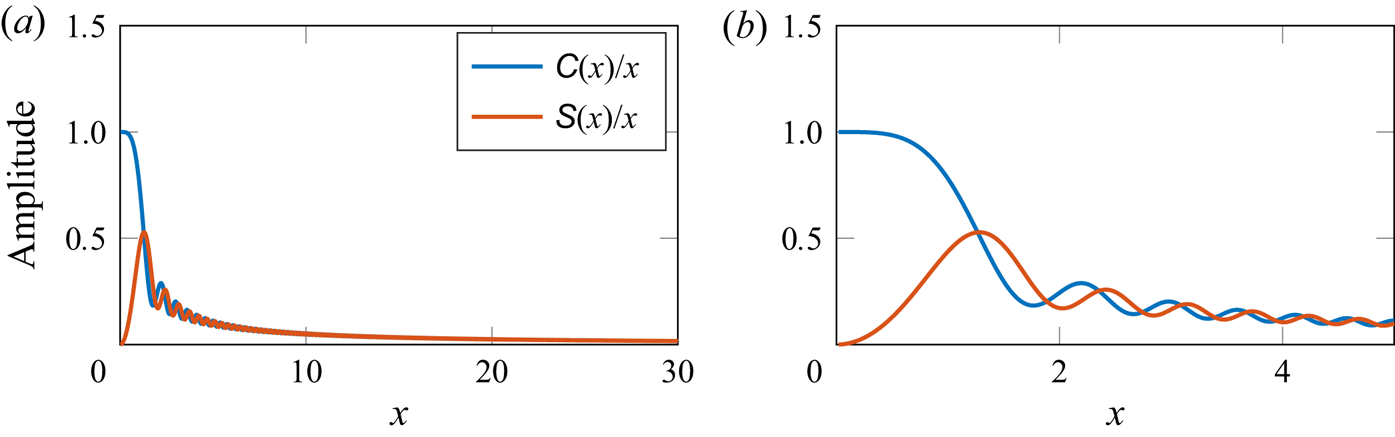
Thanks to trigonometric relations and change of variables, these  $\varGamma$ integrals can be explicitly described by a sum of Fresnel integrals
 $x \mapsto {\mathsf{C}}(x)$ and
 $x \mapsto {\mathsf{S}}(x)$ (see Appendix B and Olver et al. Reference Olver, Lozier, Boisvert and Clark2010), whose values in
 $x=0$ are
 $1$ and
 $0$, respectively, and whose limit when
 $x$ approaches
 $+\infty$ is
 $0$. We deduce that the value of
 $\varGamma$ only depends on the cosine Fresnel integral and we can therefore write
 \begin{equation} \varGamma(a,b,c,d) = \varGamma^{{\mathsf{C}}} (a,b,c,d), \end{equation}
with
 \begin{equation} \varGamma^{{\mathsf{C}}} (a,b,c,d) = \sqrt{\frac{2}{{\rm \pi}^3 l_0 l_1 l_2}} \cos \left(\frac{\rm \pi}{2}\left( a+b+c+d +\frac{1}{2}\right) \right) \delta(l_{bcd}). \end{equation}
If  $l_0$,
 $l_1$ and
 $l_2$ are linked by a triadic relation so that
 $l_{bcd} = 0$ for a given
 $(b,c,d)\in \mathbb {Z}^3$, then one (and only one) of the four
 $\varGamma$ integrals has a reduced interaction radial wavenumber
 $l_{bcd}$ equal to zero whereas the three others have non-zero reduced interaction radial wavenumbers. The corresponding disjunctive case study is presented in table 2. We conclude that one (and only one) of the four
 $\varGamma$ integrals is non-zero, and we have
 \begin{equation} |\varXi_{hij}| = \frac{1}{\sqrt{{\rm \pi}^3 l_0 l_1 l_2}} \quad \mathrm{with}\ l_0 \pm l_1 \pm l_2 = 0. \end{equation}
This is true, for example, for  $(hij) = (000)$,
 $(110)$,
 $(011)$,
 $(101)$ and
 $(121)$ (that correspond to
 $\varXi _{hij}$ involved in (4.7) and (4.8)), consistent with the two case studies. The five
 $\varXi$ integrals are therefore non-zero, and have approximatively the same norm. It can also be shown that they are maximal since
 $\text {d} [C(x)/x] / \text {d} x = 0$ for
 $x=0$. In this case, when the three radial wavenumbers are linked by a linear relation of the form
 $l_0 = \pm l_1 \pm l_2$, the nonlinear system of internal wave equations reduces to a system that no longer involves neither
 $\varXi _{hij}$ nor Bessel integrals, allowing for the same resolution method as in Cartesian geometry. Although the result is not exact (since it is derived from asymptotic expressions of the Bessel functions), this is an interesting finding that may contribute to the derivation of the resonance relation.
Disjunctive case study showing the values of  $l_0 \pm l_1 \pm l_2$ when a triadic relation between the radial wavenumbers is satisfied.

4.5. Degrees of freedom versus constraints
Let us now discuss the degrees of freedom of such a triadic interaction. The primary wave field being set, the triad is determined by the frequencies and wavenumbers of the sub-harmonic secondary waves, which means  $8$ parameters (
 $2\times 1$ frequencies and
 $2\times 3$ wavenumbers). The constraints can be listed as
 $2$ dispersion relations and
 $4$ resonance conditions. Therefore, the system has two degrees of freedom, which also means that it has a degeneracy in its solutions. The triad satisfies the following relations:
 $$\begin{gather} \omega_0 ={\pm} \omega_1 \pm \omega_2, \end{gather}$$
 $$\begin{gather}m_0 ={\pm} m_1 \pm m_2, \end{gather}$$
 $$\begin{gather}p_0 ={\pm} p_1 \pm p_2, \end{gather}$$
 $$\begin{gather}l_0 \simeq{\pm} l_1 \pm l_2, \end{gather}$$
in which we remind that the approximate equality for the radial wavenumbers  $l_0$,
 $l_1$ and
 $l_2$, comes from the geometry itself and properties of the Bessel functions (see figures 2 and 3, showing a finite (but non-zero) width peak for the resonance condition). Although, to our knowledge, no such observation has been reported, the triadic resonant relations should be similar for
 $3$-D Cartesian wave fields. Note that, for (quasi)
 $2$-D wave fields (i.e. Cartesian
 $2$-D or axisymmetric), there are only
 $6$ free parameters (
 $2\times 1$ frequencies and
 $2\times 2$ wavenumbers) for
 $5$ constraints (
 $2$ dispersion relations and
 $3$ resonance conditions), which means that the triadic system is mono-valued and only admits a unique solution once one of the free parameters is fixed. For example, in
 $2$-D, setting one of the sub-harmonic frequencies is enough to characterise the whole wave field and the sub-harmonic wavenumbers. Conversely, in
 $3$-D, the frequency and one of the wavenumbers of a sub-harmonic can be chosen independently to determine the whole wave field.
The present analysis has been performed for internal waves in a stratified, non-rotating fluid ( $f=0$), but a similar study can be undertaken in the rotating case (
 $f \neq 0$). We speculate that the coupling equations would then be modified with additional cross-terms adding more complexity to the nonlinear resonant forcing, but the resonance conditions would still be the same. In other words, since the base flow equations are identical in the rotating and in the non-rotating cases, the resonance conditions will be the same; however, the different coefficients, related to the growth rates, would likely be modified. The major differences would thus be on the selection of the modes (i.e. which modes would be the most unstable) rather than on the resonance conditions per se. We also note that adding rotation increases the wave instability and the 3-D effects, and is more likely to create symmetry breakings (such as, in our case, the creation of pure cylindrical modes with an azimuthal wavenumber
 $p \neq 0$ out of an axisymmetric forcing wave field) (Maurer, Joubaud & Odier Reference Maurer, Joubaud and Odier2016; Ha, Chomaz & Ortiz Reference Ha, Chomaz and Ortiz2021; Mora et al. Reference Mora, Monsalve, Brunet, Dauxois and Cortet2021).
4.6. Experimental observation
We conducted experiments in which we generated axisymmetric inertia-gravity waves in an unconfined domain with a density stratified and rotating fluid. The primary aim of these experiments is to trigger TRI with high sensitivity in the regime  $(\omega /f,\omega /N)$ in which it is the most likely to occur (Maurer et al. Reference Maurer, Joubaud and Odier2016). Some of these experiments show resonant triads in cylindrical geometry, with a symmetry breaking, as previously described in our study case
 $2$. This subsection focuses on the analysis of one of these experiments, run at buoyancy frequency
 $N=0.97\,{\rm rad}\,{\rm s}^{-1}$ and Coriolis frequency
 $f=0.294\,{\rm rad}\,{\rm s}^{-1}$. The forcing imposed at frequency
 $\omega _0 = 0.80\,{\rm rad}\,{\rm s}^{-1}$ is a truncated Bessel function with a wavenumber
 $l_0=42\,{\rm m}^{-1}$ and an amplitude
 $a=15\ \mathrm {mm}$.
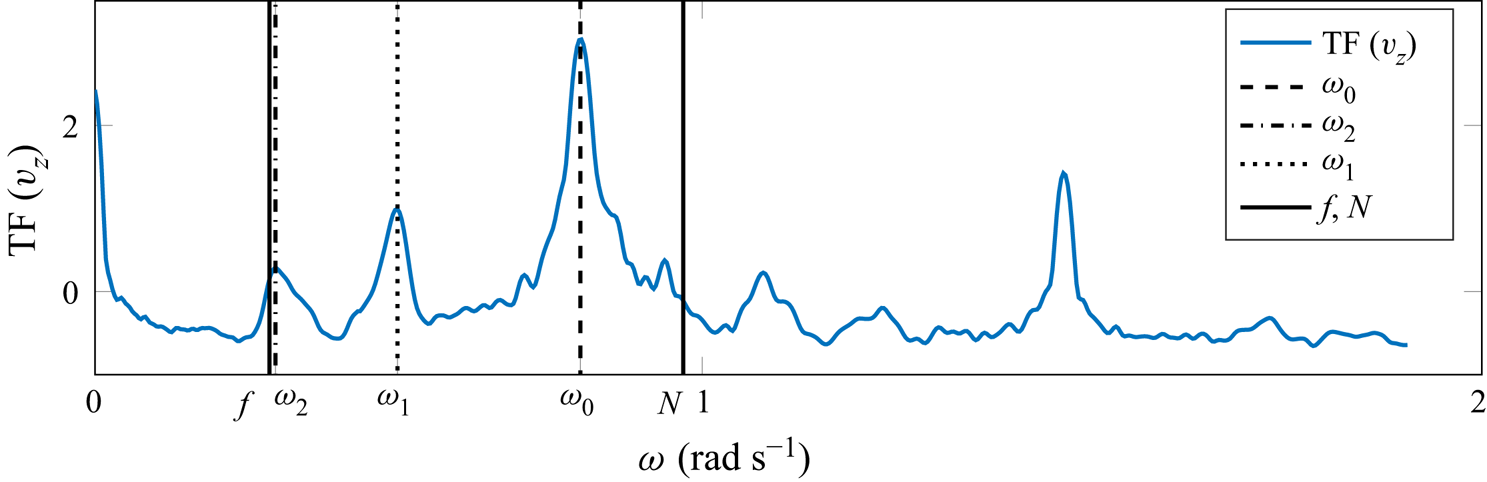
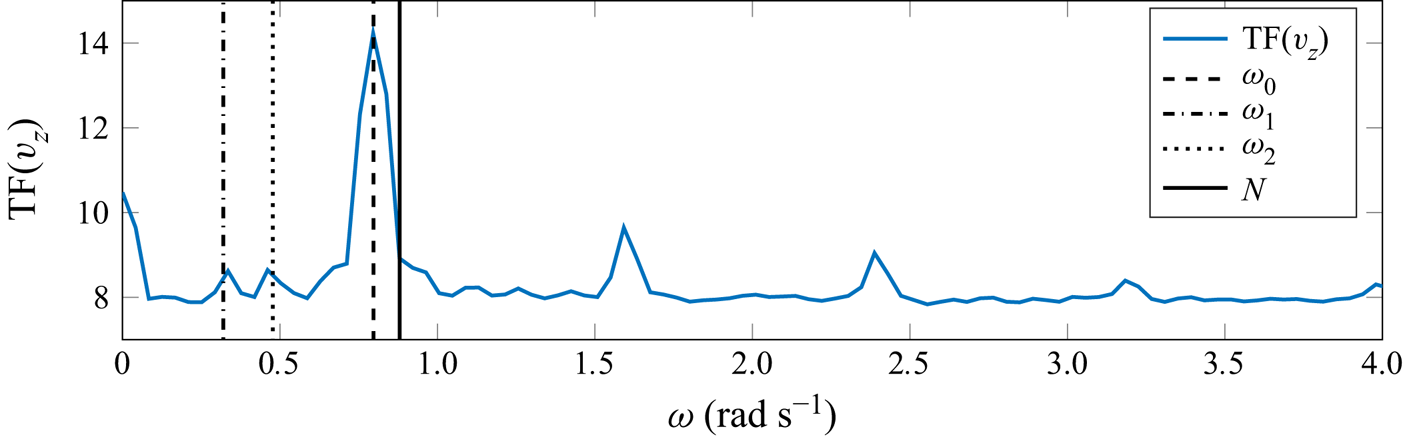
On the Fourier transform computed approximately  $300\ \mathrm {s}$ after the beginning of the experiment, presented in figure 5, we can see a peak at the forcing frequency
 $\omega _0 = 0.80\,{\rm rad}\,{\rm s}^{-1}$ accompanied by two peaks at smaller frequencies at
 $\omega _1 = 0.30$ and
 $\omega _2 = 0.50\,{\rm rad}\,{\rm s}^{-1}$. These three frequencies satisfy the triadic resonant condition
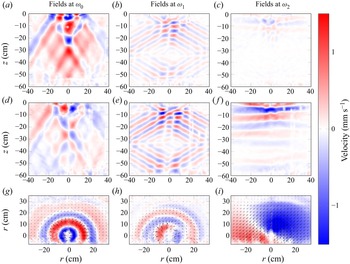
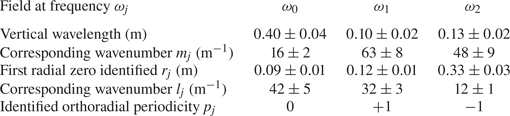
 $\omega _0 = \omega _1 + \omega _2$. Velocity fields filtered at the frequencies associated with the observed TRI satisfying the resonance condition are presented in figure 6. In the vertical cross-section, we can estimate the vertical wavelength and associated wavenumber
 $m_j$ for
 $j \in \lbrace 0,1,2 \rbrace$. These values are presented in table 3. From our estimates, we verify the resonance condition on the vertical wavenumber as we have
 $m_0 \simeq m_1 - m_2$.
Fourier transform performed approximately  $300\ \mathrm {s}$ after starting the experiment. The buoyancy frequency is
 $N=0.97\,{\rm rad}\,{\rm s}^{-1}$ and the Coriolis frequency
 $f=0.294\,{\rm rad}\,{\rm s}^{-1}$. Forcing was imposed at a frequency
 $\omega _0 = 0.80\,{\rm rad}\,{\rm s}^{-1}$.

Radial velocity fields, with no confining cylinder, buoyancy frequency  $N=0.97\,{\rm rad}\,{\rm s}^{-1}$ and Coriolis frequency
 $f=0.294\,{\rm rad}\,{\rm s}^{-1}$. From panels (a–i): primary forcing wave at
 $\omega _0=0.80\,{\rm rad}\,{\rm s}^{-1}$, and secondary waves at
 $\omega _1=0.50$ and
 $\omega _2=0.30\,{\rm rad}\,{\rm s}^{-1}$. The first two rows show the vertical and the radial velocities in the vertical cross-section, and the third row shows the radial velocity in the horizontal cross-section.

Wavenumbers extracted from the experiment for the radial velocity fields filtered at  $\omega _j$, with
 $j\in \lbrace 0,1,2 \rbrace$, showing from top to bottom: the vertical wavelengths and their corresponding vertical wavenumbers; the first zeros
 $r_j$ measured in the experiment and their corresponding radial wavenumber
 $l_j$; the identified orthoradial periodicity
 $p_j$.

The radial wave fields are described by Bessel functions of the first kind  $J_1$ and are therefore of the form
 $J_1 (l_j r)$ for
 $j \in \lbrace 0,1,2 \rbrace$. The first zero of this Bessel function is approximately equal to
 $3.83$ (Beattie Reference Beattie1958). For each value of
 $j$, the location
 $r_j$ of the first zero can be identified in these velocity fields (figure 6g–i), and the corresponding wavenumber
 $l_j$ can then be deduced (
 $l_j=3.83/r_j$). These numbers are presented in table 3 for the three frequencies identified in figure 5. The radial wavenumber
 $l_0=42\,{\rm m}^{-1}$ obtained for the primary wave is consistent with the imposed forcing. The two radial wavenumbers for the secondary waves are close to satisfy the resonance relation
 $l_0 \simeq l_1 + l_2$.
Furthermore, there is a clear symmetry breaking as the velocity fields for the secondary waves at  $\omega _1$ and
 $\omega _2$ start rotating clockwise and anti-clockwise, respectively, meaning that there is an azimuthal wavenumber
 $p_1= +1$ and
 $p_2=-1$ (see table 3). This verifies the orthoradial resonance condition as the excitation field has an azimuthal wavenumber
 $p_0 = 0 = p_1 + p_2$. This is also consistent with the fact that the primary wave is axisymmetric, i.e. can be described by
 $v_z \propto J_0 (l_0 r)$ and
 $v_r \propto J_1 (l_0 r)$ with non-zero vertical velocity and zero radial velocity at
 $r=0$, whereas the two secondary waves are cylindrical and non-axisymmetric, for example with non-zero radial velocity at
 $r=0$, as allowed for Kelvin modes.
5. Confined domains: coercion by boundary conditions
5.1. Boundary conditions and structure of the solutions
As detailed in table 4 (left column), confining the wave field in a cylinder of radius  $R$ and height
 $H$ reduces the accessible spatial domain, from
 $\mathbb {R}^+$ to
 $[0;\ R]$ in the radial direction, and from
 $\mathbb {R}$ to
 $[0;\ H]$ in the vertical direction. Such a change of geometry imposes a new set of constraints: in contrast to infinite domains, the wave field now has to satisfy boundary conditions, namely zero orthogonal velocity on top and bottom at depth
 $H$,
 \begin{equation} v_z(z=0) = 0 \quad \mathrm{and}\quad v_z(z=H) = 0, \end{equation}
as well as on the lateral cylindrical wall located at a radius  $R$,
 \begin{equation} v_r (r=R) = 0.\end{equation}
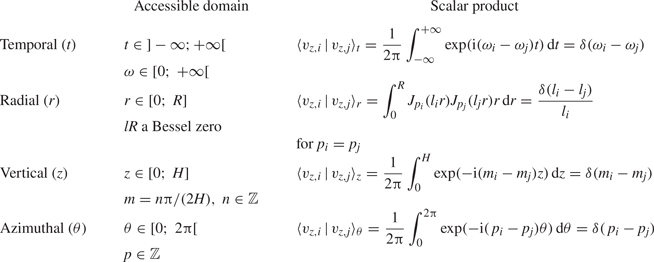
As opposed to the unbounded scenario detailed in the previous section, the full confinement induced by the lateral and horizontal boundary conditions leads to de-coupled vertical and horizontal dependence of the wave field as well as to a larger wave–wave interaction volume. The wavenumbers and, consequently, the modes allowed in such a confined geometry are now quantified: only a discrete collection of radial and vertical wavenumbers can be selected.
Scalar product to consider in a confined domain.

The first condition of (5.1a,b) is automatically fulfilled when writing the vertical dependence of the mode as a sine function with no phase shift, as previously assumed; the second condition can be solved analytically and, introducing  $z^\star =mH$, it leads to
 \begin{equation} m H = z^\star{=} \frac{n {\rm \pi}}{2} \quad \mathrm{with}\ n \in \mathbb{N}.\end{equation}
As discussed by Boury et al. (Reference Boury, Peacock and Odier2019), this vertical confinement and the condition stated by (5.3) produce a wave resonator through constructive and destructive interference, depending on the forcing wave frequency. While the forcing wave field might not fulfil this condition per se, additional wave fields generated through nonlinear interactions are compelled to satisfy it as soon as they fill the entire domain (see, e.g. generation of super-harmonics; Boury et al. Reference Boury, Peacock and Odier2021a).
The cylindrical boundary also constrains the allowed values of horizontal wavenumbers through the non-penetration condition (5.2) that can be written more explicitly as
 \begin{equation} (f-2\omega) J_{p-1} (l R) + (f+2\omega) J_{p+1} (l R) = 0. \end{equation}
In contrast to the vertical condition (5.3), this equation shows that the horizontal description of the wave field, contained in the wavenumbers  $l$ and
 $p$, depends on the frequency for inertia-gravity waves. In the peculiar case of stratified non-rotating fluids, this relation no longer depends on
 $\omega$ and simply writes
 \begin{equation} J_{p-1} (l R) - J_{p+1} (l R) = 0. \end{equation}
Note that, for axisymmetric modes ( $p=0$), this condition reduces to
 \begin{equation} J_1 (l R) = 0 \end{equation}
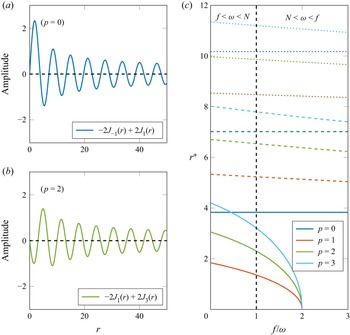
for both gravity and inertial waves. In a more general case, the zeros  $l R = r^\star$ of (5.4) can be determined numerically. We present, in figure 7, plots of the left-hand side of (5.4) for
 $p=0$ (a) and
 $p=2$ (b), both for
 $f=0$, and the three first non-zeros solutions
 $r^\star$ as a function of
 $f/\omega$ (c). The colours stand for the value of
 $p$ from
 $0$ through
 $4$, and the solid, dashed and dotted styles correspond to the first, second and third solutions, respectively. A vertical dashed line at
 $f/\omega = 1$ indicates the cut-off between the gravity-dominated region (
 $f<\omega < N$) and the inertia-dominated region (
 $N<\omega < f$). As expected from the calculus performed with the axisymmetric assumption, for
 $p=0$, the solutions of (5.5) do not depend on the frequency, but this is no longer the case as soon as
 $p\neq 0$.
Illustration of condition (5.4) imposed by the cylindrical boundary condition. (a,b) Plots of (5.4) for  $f=0$ with
 $p=0$ (a) and
 $p=2$ (b). (c) Locations
 $r^\star$ of the first (solid line), second (dashed line) and third (dotted line) non-zero nodes of (5.5), for
 $p$ from
 $1$ through
 $4$. The vertical dashed line helps distinguish the domains
 $f<\omega < N$ and
 $N<\omega < f$.

From now on, we should therefore consider box solutions, that we call modes, i.e. wave fields that comply both with the symmetry ( $2{\rm \pi}$-periodicity) and the geometry (
 $(r,z) \in [0;\ R] \times [0; H]$) of the system, leading to a discretisation of the allowed wavenumbers. As shown before, defining the vertical velocity field is sufficient to describe these modes, and we write again
 \begin{equation} v_{z,j}(r,\theta,z,t) = v_{v,j}^0 J_{p_j} (l_j r) \exp({{\rm i}(\omega_j t - m_j z - p_j \theta)}), \end{equation}
where the values taken by  $l_j$,
 $m_j$ and
 $p_j$ are now discrete. The scalar products on the radial and vertical coordinates defined in the previous section do not apply any longer for we have to take into account the finiteness of the domain and the discrete nature of the wavenumbers. We present in table 4 (right column) the relevant scalar products that we will use to discuss the resonance conditions of these modes.
5.2. Resonance in frequency
Similarly to the unconfined case, the temporal scalar product gives a resonance condition on the three wave frequencies that form a triad. In the absence of any additional constraint, this condition is always fulfilled and leads to the selection of two sub-harmonics of frequencies  $\omega _1$ and
 $\omega _2$ such that
 $\omega _0 = \pm \omega _1 \pm \omega _2$. Note that this process is similar to the generation of super-harmonics in confined domains (Boury et al. Reference Boury, Peacock and Odier2021a).
5.3. Azimuthal resonance
The scalar product on  $\theta$ is the same as in the unconfined case, and leads to the same resonance condition on the azimuthal wavenumbers
 $p_0 = \pm p_1 \pm p_2$. As in the unconfined case, the values of
 $p$ are integers, to comply with the
 $2{\rm \pi}$-periodicity of the system.
5.4. Vertical resonance
Due to the confinement, all of the vertical wavenumbers  $m$ can be expressed as
 ${m = n{\rm \pi} / (2 H)}$ with
 $n\in \mathbb {N}$. Recasting the scalar product from
 $z \in \mathbb {R}$ with
 $m\in \mathbb {R}$ into
 $z\in [0;\ H]$, with
 $m$ defined through integers, leads to the same resonance condition
 $m_0 = \pm m_1 \pm m_2$. Interestingly, although the vertical confinement of the wave field imposes a discrete set of vertical wavenumbers, the vertical resonance condition can still be exact: this is due to the constant discrete spacing between two consecutive vertical wavenumbers for modes in the confined domain, always distant of
 ${\rm \pi} /(2 H)$ (see (5.3)), that allows for vertical wavenumbers that satisfy both the boundary conditions and the resonance relation.
5.5. Radial resonance: asymptotic study
Along the radial direction, however, the difference is more significant. To discuss it, we will use a similar asymptotic study as we did in the unconfined case. The scalar product performed on the linear part of the system of equations is now reduced to an integral from  $0$ to
 $R$ (instead of
 $0$ to
 $+\infty$) where the wavenumbers
 $l$ are discrete (instead of continuous). This imposes a rewriting of the integral over three Bessel functions, now radially limited in space, as
 \begin{equation} \forall\ (h,i,j)\in\mathbb{N}^3,\quad \varXi_{hij} \simeq \frac{1}{R^2} \int_0^R \tilde{J}_h (l_0 r) \tilde{J}_i (l_1 r) \tilde{J}_j (l_2 r) r \,\text{d} r, \end{equation}
leading to a redefinition of the  $\varGamma$ functions, given
 $(a,b,c,d)\in \mathbb {Z}^4$ and the radial interaction wavenumber
 $l_{bcd}$ defined in (4.14), as
 \begin{equation} \varGamma (a,b,c,d) = \frac{1}{R^2} \int_0^R \frac{1}{2{\rm \pi}}\sqrt{\frac{l_{bcd}}{l_0 l_1 l_2}} \tilde{J}_{a+b+c+d} (l_{bcd}r)\,\text{d} r. \end{equation}
As for the unconfined case, these functions can be written as a sum
 \begin{equation} \varGamma(a,b,c,d) = \varGamma^{{\mathsf{C}}} (a,b,c,d) + \varGamma^{{\mathsf{S}}} (a,b,c,d), \end{equation}
with
 \begin{equation} \varGamma^{{\mathsf{C}}} (a,b,c,d) = \sqrt{\frac{2}{{\rm \pi}^3 l_0 l_1 l_2}} \cos \left(\frac{\rm \pi}{2}\left( a+b+c+d +\frac{1}{2}\right) \right) \frac{{\mathsf{C}}\left( l_{bcd}^\ast \right)}{l_{bcd}^\ast} \end{equation}
and
 \begin{equation} \varGamma^{{\mathsf{S}}} (a,b,c,d) = \sqrt{\frac{2}{{\rm \pi}^3 l_0 l_1 l_2}} \sin \left(\frac{\rm \pi}{2}\left( a+b+c+d +\frac{1}{2}\right) \right) \frac{{\mathsf{S}}\left( l_{bcd}^\ast \right)}{l_{bcd}^\ast}, \end{equation}
where, for the sake of clarity, we use the notation
 \begin{equation} l_{bcd}^\ast{=} \sqrt{\frac{2 R | l_{bcd} |}{\rm \pi}} \end{equation}
for the reduced interaction radial wavenumber. In contrast to the unconfined case, in which the reduced sine and cosine Fresnel integrals are only evaluated in  $0$ (if the resonance relation on
 $l$ is satisfied) or in
 $+\infty$ (if they are not), now they can be evaluated from
 $0$ to
 $l^\ast$, due to the finite size of the domain. Incidently, they are no longer equal to
 $0$ or to
 $1$, but to values that are continuously distributed in
 $[0;\ 1]$. This allows for the radial resonance to be ‘approximate’, i.e.
 $l_{bcd}\simeq 0$, without preventing the nonlinear terms to be a second-order forcing of the system.
5.6. Radial resonance: case studies in confined domain
We now consider the same two case studies as in the unconfined geometry, i.e. (1) a fully axisymmetric case  $p_0 = p_1 = p_2 = 0$, and (2) a non-axisymmetric case
 $p_0 = 0$,
 $p_1=1$ and
 $p_2=-1$. The numerical investigation presented here will help discuss the impact of the finite size of the domain, or confinement of the wave fields, on the resonance.
5.6.1. Axisymmetric case $p_0 = p_1 = p_2 = 0$

As already discussed, in the fully axisymmetric case  $p_0 = p_1 = p_2 = 0$, the radial scalar products of the nonlinear term are written as
 \begin{equation} \left\langle- (\boldsymbol{v} \boldsymbol{\cdot} \boldsymbol{\nabla}) v_z\right\rangle_r = A_{z} \left[ M_{01} \varXi_{110} + M_{10} \varXi_{000} \right]. \end{equation}
The normalised absolute values of the corresponding coefficients  $\varXi _{hij}$ are numerically computed and presented in figure 8 as a function of
 $l_1/l_0$ and
 $l_2/l_0$, with
 $l_1/l_0$ and
 $l_2/l_0$ going from
 $0$ to
 $2$. We can see that although
 $|\varXi _{110}|$ and
 $|\varXi _{000}|$ have different behaviours at a random location in the parameter space
 $(l_1/l_0,l_2/l_0)$, they generally show maximum values on the diagonals such that
 $\pm l_1 \pm l_2 = l_0$, shown by white dashed lines in figure 2. Their product is even more eloquent, as there is a clear maximum for
 $\pm l_1 \pm l_2 = l_0$, whereas the product is almost zero everywhere else. From these observations, we conjecture that the most likely values for radial wavenumbers in TRI, for which relation (4.7) has a non-zero right-hand side, satisfy the relation
 $l_0 = l_1+l_2$, as shown experimentally by Shmakova & Flór (Reference Shmakova and Flór2019) and as already observed for Cartesian plane waves where it can be analytically demonstrated that
 $\pm l_1 \pm l_2 = l_0$ is a necessary condition (Joubaud et al. Reference Joubaud, Munroe, Odier and Dauxois2012).
Colourmaps of the normalised coefficients  $|\varXi _{hij}|$ as a function of wavenumber ratios
 $l_1/l_0$ and
 $l_2/l_0$, in the case
 $p_0 = p_1 = p_2 = 0$, with (a)
 $|\varXi _{110}|$, (b)
 $|\varXi _{000}|$ and (c) product of the two previous quantities. Dashed lines show the locations of
 $l_0 \pm l_1 \pm l_2 = 0$. (d) Profile along the dotted line in panel (c).

For the sake of the demonstration, we shall clarify that having a non-zero product  $|\varXi _{110}\varXi _{000}|$ is neither the only way for (4.7) to be resonant (for example, it is resonant if
 $\varXi _{000}$ is null and if
 $\varXi _{110}$ is not), nor does it ensure that this equation is resonant (depending on the values of
 $M_{01}$ and
 $M_{10}$, this equation can be non-resonant even if the product
 $|\varXi _{110}\varXi _{000}|$ is not null). Our reasoning nonetheless points towards a high probability of the system to select ‘preferential’ configurations that correspond to the case of a high value of
 $|\varXi _{110}\varXi _{000}|$, equivalent to large resonant terms and therefore large and efficient energy transfer. We note that for the sub-harmonics to exist, the nonlinear characteristic time (related to the growth of the instability) should overcome the viscous characteristic time (related to dissipative effects and therefore preventing the growth of sub-harmonics). This condition depends on the signs and values of the coefficients
 $M_{01}$ and
 $M_{10}$ that set the growth rate of the sub-harmonics, but the cases for which such a condition is not satisfied are highly unlikely.
For a comparison, similar colourmaps to these presented in figure 8 could be plotted for the nonlinear terms in  $2$-D Cartesian geometry. In this case, the corresponding spatial integrals are associated to a product of three complex exponential functions (i.e. plane waves) instead of Bessel functions and, due to the properties of their scalar product, the colourmaps are exactly
 $1$ over the diagonals
 $\pm l_1 \pm l_2 = l_0$ and
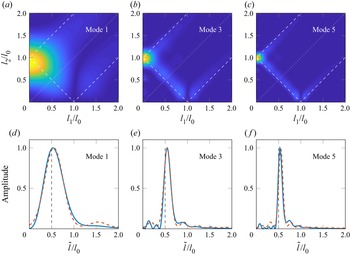
 $0$ everywhere else. Here, the finite size effect and approximate radial resonance (that can be seen through the more ‘diffuse’ branches in the product in figure 8(c), compared with the unconfined case in figure 2), is due to the geometry of the wave field.
5.6.2. Non-axisymmetric case $p_0 = 0$, $p_1=1$ and $p_2=-1$


In the second case study with  $p_0 = 0$,
 $p_1=1$ and
 $p_2=-1$, we have seen that the radial scalar product of the nonlinear term is written as
 \begin{equation} \left\langle- (\boldsymbol{v} \boldsymbol{\cdot} \boldsymbol{\nabla}) v_z\right\rangle_r = A_{z} \left[\frac{ M_{01}}{2}( \varXi_{101} - \varXi_{121}) - M_{10} \varXi_{011} \right]. \end{equation}
Figure 9 presents colourmaps of the normalised absolute value of the coefficients  $\varXi _{hij}$, plotted as a function of
 $l_1/l_0$ and
 $l_2/l_0$, with
 $l_1/l_0$ and
 $l_2/l_0$ going from
 $0$ to
 $2$. These coefficients have, in general, maximum values on the diagonals given by
 ${\pm }l_1 \pm l_2 = l_0$ and there is a clear maximum for
 ${\pm } l_1 \pm l_2 = l_0$ for their product whereas it is almost zero everywhere else, leading to the same conclusion as in the fully axisymmetric case. We perform the same measure on the mid-height width of the branches to quantify the equality of the resonance relation. The profile presented in figure 9( f) is taken along the bissectrix shown by the dotted line in the product plot 9(d).
Colourmaps of the normalised coefficients  $|\varXi _{hij}|$ as a function of wavenumber ratios
 $l_1/l_0$ and
 $l_2/l_0$, in the case
 $p_0 = 0$,
 $p_1 = 1$ and
 $p_2 = -1$, with (a)
 $|\varXi _{011}|$, (b)
 $|\varXi _{101}|$, (c)
 $|\varXi _{121}|$ and (d) the product of the three previous quantities. Dashed lines show the locations of
 $l_0 \pm l_1 \pm l_2 = 0$. (e) Schematic representation of the triad. ( f) Profile along the dotted line in panel (d).

5.7. Approximated triadic resonance
We have seen, with the two case studies, that the radial resonance is not exact since the branches corresponding to exact resonant triads  $l_0 \pm l_1 \pm l_2 = 0$ have a given spectral extension that we could quantify as a relative mid-height width
 $\Delta l / l_0$. This can be transduced as
 \begin{equation} l_0 \pm l_1 \pm l_2 = \varepsilon \end{equation}
when the triad is radially resonant, with  $\varepsilon \ll \Delta l$. The remaining question is to quantify this ‘approximate’ resonance. To do so, we focus on the first bissectrix, i.e. the case
 $l_1=l_2$, and we introduce a common variable
 $\tilde {l} = l_1 = l_2$ to describe it. With this notation, we can define a renormalised variable
 $l^\star$ as
 \begin{equation} l^\star{=} \sqrt{\frac{2 l_0 R}{\rm \pi} \left| 1 - \frac{2 \tilde{l}}{l_0}\right|}. \end{equation}
According to our model, close to the radial resonance (i.e. for  $l^\star$ close to
 $0$), the integrals
 $\varXi _{hij}$ are determined only by the reduced cosine Fresnel integral
 ${\mathsf{C}}(l^\star ) / l^\star$, which should therefore fix the relative mid-height width
 $\Delta l /l_0$. To confirm the validity of our development, we present in figure 10 the colourmaps of the product
 $\varXi _{110}\varXi _{000}$, corresponding to the first case study aforementioned, in three different cases: (a)
 $l_0=19\ \mathrm {m}^{-1}$ (mode
 $1$); (b)
 $l_0=51\ \mathrm {m}^{-1}$ (mode
 $3$); and (c)
 $l_0=82\ \mathrm {m}^{-1}$ (mode
 $5$). We also present a comparison between the normalised profiles measured along the bissectrix (dotted line in panels (a) to (c)) and the cosine Fresnel integral
 ${\mathsf{C}}(l^\star )/l^\star$ predicted by the theory, for the three different values of
 $l_0$, in panels (c,d, f), respectively. Since we are considering the product of two integrals
 $\varXi _{110}\varXi _{000}$, both behaving asymptotically as
 ${\mathsf{C}}(l^\star )/l^\star$, we plot the quadratic quantity
 $({\mathsf{C}}(l^\star )/l^\star )^2$. Thanks to figure 10(d–f), we note the very good agreement between the numerically computed profiles (blue solid lines) and the theory (orange dashed lines) to describe the behaviour close to the resonance located at
 $l_1/l_0 = l_2/l_0 = 0.5$. The mid-depth width,
 $\Delta l / l_0$, that can be extracted from the asymptotic theory is exactly the same as the one obtained from the numerics. As already discussed, these results can be extended to other configurations (e.g. second case study) and will lead to the same conclusions.
(a–c) Colourmaps of the normalised coefficients  $|\varXi _{110}\varXi _{000}|$ as a function of wavenumber ratios
 $l_1/l_0$ and
 $l_2/l_0$, with (a)
 $l_0=19\ \mathrm {m}^{-1}$ (mode
 $1$), (b)
 $l_0=51\ \mathrm {m}^{-1}$ (mode
 $3$) and (c)
 $l_0=82\ \mathrm {m}^{-1}$ (mode
 $5$). (d–f) Measured profiles along the bissectrix corresponding to the white dashed line in the top row (blue solid curve) and prediction by the asymptotic theory (orange dashed line), for the same modes in panels (a–c), respectively.

Our asymptotic theory predicts, in agreement with the exact computation of the resonant terms, that the radial resonance in such a cylindrical geometry is not exact and that we can quantitatively bound this approximativeness  $\varepsilon$ of the resonance by a known
 $\Delta l$. For the cosine Fresnel integral, the relative mid-depth width is obtained when
 $l^\star =1$, so
 \begin{equation} \frac{\Delta l}{l_0} = \frac{\rm \pi}{2 l_0 R}. \end{equation}
Therefore, the relative mid-height width evolves as  $(Rl_0)^{-1}$, i.e. a higher mode results in a thinner peak, exactly as observed in figure 10(d–f). The relative mid-height width goes to zero as the order of the mode goes to infinity, corresponding to an exact resonance. By comparison, horizontal resonances for Cartesian plane waves are always exact; this result is recovered when considering high order radial modes in cylindrical geometry, when the area close to
 $r=0$ can be neglected and when the wave field can therefore be approximated by radially decreasing plane waves (such as
 $r \mapsto \cos (r) / r$).
5.8. Degrees of freedom versus constraints
We proceed to a similar analysis as the one performed in unconfined domains. The sub-harmonics are, again, defined through  $8$ parameters (
 $2\times 1$ frequencies and
 $2\times 3$ wavenumbers). The constraints, however, are more numerous:
 $2$ dispersion relations;
 $4$ resonance conditions (TRI); and now
 $4$ additional constraints linked to boundary conditions (
 $2$ for each sub-harmonic). By analogy to the observations presented by Boury et al. (Reference Boury, Peacock and Odier2021a) for super-harmonics, we postulate that the constraints set by the boundary conditions prevail, and that the wave field always satisfies (5.3) and (5.4), preferably to forming an exact triad. The reason for that is still the topic of ongoing research. As a result, in addition to the internal wave dispersion relation, the frequencies and wavenumbers are defined through
 $$\begin{gather} \omega_0 ={\pm} \omega_1 \pm \omega_2, \end{gather}$$
 $$\begin{gather}J_{p_1-1} (l_1 R) = J_{p_1 + 1} (l_1 R) \quad \mathrm{and}\quad J_{p_2-1} (l_2 R) = J_{p_2 + 1} (l_2 R), \end{gather}$$
 $$\begin{gather}2 m_1 H = n_1 {\rm \pi}\quad \mathrm{and}\quad 2 m_2 H = n_2 {\rm \pi}. \end{gather}$$
5.9. Experimental observation
We performed experiments for values of  $\omega /N$ from
 $0.82$ to
 $0.92$, with a low amplitude (
 $a=2.5\ \mathrm {mm}$) mode
 $1$ configuration at the generator (Boury et al. Reference Boury, Peacock and Odier2019). In several experiments, towards the end of the
 $10$ minute forcing, one can observe the creation of sub-harmonics as presented in the spectrum in figure 11 computed using the last two minutes of the acquisition. Two secondary waves are created at frequencies smaller than the imposed forcing (
 $\omega _1/N =0.36$ and
 $\omega _2/N=0.55$) that satisfy the triadic resonant condition
 $\omega _1 + \omega _2 = \omega _0$, as
 $\omega _1 = 0.4\omega _0$ and
 $\omega _2=0.6\omega _0$.
Fourier transform performed over the last two minutes of the experiment with a forcing at  $\omega /N = 0.91$. From left to right: the dash–dotted line shows
 $\omega _1$, the dotted line shows
 $\omega _2$, both sub-harmonics, the dashed line shows the forcing frequency
 $\omega _0$ and the solid line shows the buoyancy frequency
 $N$.

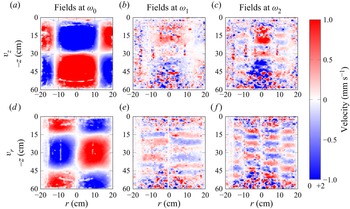
Filtered wave fields at the three frequencies  $\omega _0$,
 $\omega _1$ and
 $\omega _2$, are presented in figure 12, with the vertical velocity on top of the radial velocity. On the left, the primary wave shows a high amplitude of approximately
 $4\ \mathrm {mm}\,{\rm s}^{-1}$, and is close to be a cavity mode
 $(1,2)$. The centre and left columns are the two secondary waves identified from the spectrum in figure 11, at
 $\omega _1$ and
 $\omega _2$, respectively. We identify
 $1$ vertical wavelength in the fields at
 $\omega _0$,
 $5$ in the fields at
 $\omega _1$, and
 $5$ or 6 in the fields at
 $\omega _2$; and hence the resonance condition may not be satisfied for the vertical wavenumbers, as we could have
 $m_0 \pm m_2 \pm m_1 \neq 0$. Nevertheless, this is not observed in all our experiments with sub-harmonic generation as sometimes we clearly have
 $m_0 = m_1 + m_2$, consistent with the vertical resonance relation (5.3). With regards to the radial direction, we see different patterns in the filtered wave fields: the fields at
 $\omega _0$ and
 $\omega _1$ look like a radial mode
 $1$, but the field at
 $\omega _2$ looks like a radial mode
 $2$. This behaviour, however, is not a strong feature of the sub-harmonics generation via TRI, as some experiments only show radial mode
 $1$ patterns.
(a–c) Vertical velocity and (d–f) radial velocity after  $9$ minutes of forcing in the experiment. From left to right, fields are filtered at
 $\omega _0$,
 $\omega _1 = 0.4 \omega _0$ and
 $\omega _2 = 0.6\omega _0$.

In general, we observe that in this confined configuration, the resonant conditions are not satisfied. As explained previously, the reason is that the selected frequencies and wavelengths are constrained by the boundary conditions. This is supported by our experimental observations, as can be seen in figure 12, in the vertical plane, the sub-harmonics can be identified as cavity modes. Using the cavity mode formalism detailed by Boury et al. (Reference Boury, Peacock and Odier2021a), we see that, for example, in figure 12, the field at  $\omega _1$ is a mode
 $(1,10)$ and the field at
 $\omega _2$ is a mode
 $(2,10)$. Results already derived by Boury et al. (Reference Boury, Peacock and Odier2021a) on super-harmonic generation can be extended to this problem: the predicted frequencies associated with these cavity modes
 $(1,10)$ and
 $(2,10)$ are
 $\omega _{1,10}/N=0.34$ and
 $\omega _{2,12}/N=0.56$, close to the experimental values of
 $\omega _1/N=0.36$ and
 $\omega _2/N=0.55$.
In contrast to the observations of Maurer (Reference Maurer2017) in his focusing experiments, but in agreement with Shmakova & Flór (Reference Shmakova and Flór2019), we did not see any axisymmetry breaking in our experimental wave fields. Due to the poor visualisation in the horizontal plane, however, this statement could not be further explored. Our conjecture is that the presence of a cylindrical boundary at fixed radius might prevent the secondary waves from breaking the symmetry, in contrast to Maurer's observations in wave focusing experiments in which non-zero radial velocity was detected (Maurer Reference Maurer2017): such velocities, indeed, could not be described by the Bessel functions we used and could be contradictory to the condition of zero radial velocity at the cylindrical bound.
The primary and secondary waves are not always satisfying the TRI relations on the wavenumbers, particularly the radial wavenumber, which means that the boundary conditions that set the cavity mode are, in that sense, ‘stronger’ than the resonance conditions. In addition, part of the velocity fields are blurred, for example, the vertical velocity at  $\omega _1$ and
 $\omega _2$ close to
 $r=0\ \mathrm {cm}$ at the top and at the bottom of the tank (figure 12). This is likely due to the presence of other modes or to exchanges between the cavity mode and another wave field set by the TRI conditions. Similarly to super-harmonic generation, the existence of resonance conditions in TRI may prescribe the cavity modes allowed for nonlinear interaction.
6. Conclusions and discussion
The present study delves into the problematic triadic resonant instability (TRI) in the specific context of internal waves described by Kelvin modes. More precisely, we address the following questions: can we find resonance conditions for a triad of Kelvin modes? And what is the impact of the boundary conditions on such resonances?
By studying two specific configurations (‘unconfined’ and ‘confined’, as defined by the physical domain accessible to the waves, see table 5), we demonstrated that, in both cases, the sub-harmonic frequencies satisfy a resonance condition
 \begin{equation} \omega_0 ={\pm} \omega_1 \pm \omega_2. \end{equation}
The investigation of the spatial structure, however, yields different results depending on the confinement of the wave field. In the unconfined case, the 3-D spatial structure is prescribed by resonance conditions on the wavenumbers, as follows:
 $$\begin{gather} l_0 ={\pm} l_1 \pm l_2, \end{gather}$$
 $$\begin{gather}p_0 ={\pm} p_1 \pm p_2, \end{gather}$$
 $$\begin{gather}m_0 ={\pm} m_1 \pm m_2. \end{gather}$$
Conversely, in the confined case, the spatial structure is primarily constrained by boundary conditions, meaning that the wave numbers satisfy
 $$\begin{gather} J_{p_1-1} (l_1 R) = J_{p_1 + 1} (l_1 R) \quad \mathrm{and}\quad J_{p_2-1} (l_2 R) = J_{p_2 + 1} (l_2 R), \end{gather}$$
 $$\begin{gather}2 m_1 H = n_1 {\rm \pi}\quad \mathrm{and}\quad 2 m_2 H = n_2 {\rm \pi}. \end{gather}$$
The confined triad is therefore not necessarily spatially resonant. The existence of such triads may be related to quasi-resonances and viscous effects that allow for a larger resonance bandwidth (see, e.g. the case of capillary waves of Cazaubiel et al. Reference Cazaubiel, Haudin, Falcon and Berhanu2019). A similar discrimination between confined and unconfined domains is expected for  $2$-D and
 $3$-D spatially resonant triads or cavity modes in Cartesian geometry (and could be related to Cartesian studies such as Yalim et al. Reference Yalim, Lopez and Welfert2018; Grayer II et al. Reference Grayer II, Yalim, Welfert and Lopez2021). Nonetheless, the reason why boundary conditions prevail over triadic equations, and the exact process of modal selection within the cavity, remain unknown. A possible explanation is that TRI remains a local process occurring at the most energetic locations but, as the sub-harmonic field develops and fills the finite domain, it adjusts to the boundary conditions.
Comparison of the physical domains between the unconfined and the confined cases.

The difference between the confined and unconfined domain lies in the radial and vertical spatial directions, as stated in table 5. The boundary conditions on these two directions have very different implications. On the one hand, for vertical confinement, the resulting discretisation does not prevent the vertical wavenumbers to be resonant: if there exists an integer  $n_0$ such that
 $2 m_0 H = n_0 {\rm \pi}$, one can always find two integers
 $n_1$ and
 $n_2$ such that
 $2 m_1 H = n_1 {\rm \pi}$ and
 $2 m_2 H = n_2 {\rm \pi}$ (i.e. all vertical wavenumbers satisfy the boundary conditions) while fulfilling the resonance condition
 $m_0 = \pm m_1 \pm m_2$. On the other hand, for radial confinement, the discrete selection of wavenumbers is usually incompatible with an exact radial resonance: in a confined domain, it is unlikely to find radial wavenumbers satisfying both the boundary conditions (i.e.
 $l_i R$ is a zero of a Bessel function) and the resonance
 $l_0 = \pm l_1 \pm l_2$. As shown in § 5.5, mathematically, this issue arises while integrating the
 $\varXi _{hij}$ functions previously defined, since the upper integral bound is
 $R \times l_{bcd}$. In the unconfined case (domain size
 $R$ infinite), the product
 $R \times l_{bcd}$ is equal to
 $0$ only if
 $l_{bcd}=0$ (i.e. exact resonance is reached) and equal to
 $+\infty$ otherwise; this leads to integrated quantities (the Fresnel integrals, which are a proxy to quantify the nonlinear interaction between the waves) that are evaluated exactly in
 $0$ for resonant triads and in
 $+\infty$ for non-resonant triads. In confined domains (
 $R$ finite), the quantity
 $R \times l_{bcd}$ is close to
 $0$ if a quasi-resonance
 $l_{bcd}\simeq 0$ is reached, and takes high values otherwise; this allows for quasi-resonances, as the integrated quantities are evaluated close to
 $0$ for such triads – a situation not allowed in the case of an unconfined domain. We note that the bandwidth allowing for quasi-resonances goes as
 $1/R$: at fixed radial wavenumbers, a larger domain results in more exact resonances.
An important finding is the possibility of symmetry breaking: the secondary waves can have non-zero orthoradial wavenumbers although the primary wave is axisymmetric, leading to the generation of counter-rotating wave fields. These wavenumbers still have to satisfy a resonance condition. Our experiment shows  $2{\rm \pi}$-periodic cylindrical sub-harmonics, but higher periodicities could exist in such a nonlinear process.
Due to mathematical complexities, the cylindrical radial resonance condition is not analytically demonstrated over the whole domain, but only verified asymptotically, but it is consistent with our experimental data. A rigorous proof of the exact equality of this resonance condition is still a challenge for future research. In addition, we should point out that the explanation of symmetry breakings, such as identified by Maurer (Reference Maurer2017) in the case of high amplitude nonlinear interactions, could lie in the calculus of the growth rates of the triadic instability, which is beyond the scope of the present study.
Acknowledgments
Data processing has been done thanks to the PSMN at the ENS de Lyon. The authors acknowledge P. Meunier and L.R.R. Maas for fruitful discussions and inputs. S.B. thanks the labex iMust and the IDEX Lyon for additional support. The authors thank the reviewers who helped improve the clarity of this manuscript.
Funding
This work has been funded through ANR grant ANR-17-CE30-0003 (DisET) and ONR grant N00014-16-1-2450.
Declaration of interests
The authors report no conflict of interest.
Appendix A. Nonlinear terms
We present here the computation of the nonlinear advection terms. First of all, we perform a direct calculation of the advection term along  $z$, as follows:
 \begin{align} -\left( \boldsymbol{v} \boldsymbol{\cdot} \boldsymbol{\nabla} \right) v_{z} &={-} \sum_{i=1}^3 \sum_{j=1}^3 \left( \boldsymbol{v}_i \boldsymbol{\cdot} \boldsymbol{\nabla} \right) v_{z,j} ={-}\sum_{i=1}^3 \sum_{j=1}^3 \left[ v_{r,i}\partial_r v_{z,j} + \frac{v_{\theta,i}}{r}\partial_\theta v_{z,j} + v_{z,i}\partial_z v_{z,j} \right] \end{align}
 \begin{align} &={-}\sum_{i=1}^3 \sum_{j=1}^3 i v_{z,i}^0 v_{z,j}^0 \left[ -\frac{m_j l_i}{ l_j} J_{p_j}' J_{p_i}' + \frac{m_j p_j p_i}{ l_j^2 r^2} J_{p_j} J_{p_i} - m_i J_{p_i}J_{p_j}\right] \varPhi_{ij} \end{align}
 \begin{align} &={-}\sum_{i=1}^3 \sum_{j=1}^3 i \frac{v_{z,i}^0 v_{z,j}^0}{l_j} \left[ \frac{M_{ij}}{2} \left({\mathsf{J}}_{p_i -1}^{p_j+1} + {\mathsf{J}}_{p_i +1}^{p_j-1} \right) - M_{ji} {\mathsf{J}}_{p_i}^{p_j}\right] \varPhi_{ij}. \end{align}
We now compute the advection terms for the other components of the velocity field, and for the buoyancy. The radial velocity term needs to be integrated to recover the projection along  $z$ of the advection term, with an additional
 $\epsilon _{i,j}$ term that we will neglect,
 \begin{align} -\int \left(
\boldsymbol{v} \boldsymbol{\cdot} \boldsymbol{\nabla}
\right) v_{r} &={-}\sum_{i=1}^3 \sum_{j=1}^3 \int \left[
v_{r,i} \partial_r v_{r,j} + \frac{v_{\theta,i}}{r}
\partial_\theta v_{r,j} + v_{z,i} \partial_z v_{r,j} -
\frac{v_{\theta,i} v_{\theta,j}}{r}\right] \text{d}
r\\ &={-}\sum_{i=1}^3 \sum_{j=1}^3 -{\rm i}
\frac{m_j}{l_j^2} \int \left[v_{r,i} \partial^2_r v_{z,j} +
v_{z,i} \partial_z \partial_r v_{z,j}
\vphantom{\frac{v_{\theta,i}}{r} \partial_r \partial_\theta
v_{z,j} - \frac{v_{\theta,i} \partial_\theta
v_{z,j}}{r^2}}\right. \nonumber\\ &\quad \left.+\,
\frac{v_{\theta,i}}{r} \partial_r \partial_\theta v_{z,j} -
\frac{v_{\theta,i} \partial_\theta v_{z,j}}{r^2}
\right]\text{d} r\\ &={-}\sum_{i=1}^3 \sum_{j=1}^3 -{\rm i}
\frac{m_j}{l_j^2} \left( \boldsymbol{v}_i
\boldsymbol{\cdot} \boldsymbol{\nabla} \right) v_{z,j} -
\frac{1}{2} \left( v_{r,i} v_{r,j} + v_{\theta,i}
v_{\theta,j} \right) \nonumber\\ &\quad + {\rm i}
\frac{m_j}{l_j^2} \int \partial_r v_{z,i} \partial_z
v_{z,j}\,\text{d} r \end{align}
 \begin{align} &={-}\sum_{i=1}^3 \sum_{j=1}^3 -{\rm i} \frac{m_j}{l_j^2} \left( \boldsymbol{v}_i \boldsymbol{\cdot} \boldsymbol{\nabla} \right) v_{z,j} + \epsilon_{i,j}. \end{align}
The azimuthal velocity term has to be multiplied by  $r$ to cancel out the dependence in
 $1/r$, giving
 \begin{align} - r \left(\boldsymbol{v} \boldsymbol{\cdot} \boldsymbol{\nabla} \right) v_{\theta} &={-} \sum_{i=1}^3 \sum_{j=1}^3 r \left[ v_{r,i} \partial_r v_{\theta,j} + \frac{v_{\theta,i}}{r} \partial_\theta v_{\theta,j} + v_{j,i} \partial_z v_{\theta,j} + \frac{v_{r,i}v_{\theta,j}}{r} \right] \end{align}
 \begin{align} &={-} \sum_{i=1}^3 \sum_{j=1}^3 \left[ v_{r,i} \partial_r \left( r v_{\theta,j} \right) + \frac{v_{\theta,i}}{r} \partial_\theta \left( r v_{\theta,j} \right) + v_{z,i} \partial_z \left( r v_{\theta,j} \right) \right] \end{align}
 \begin{align} &={-} \sum_{i=1}^3 \sum_{j=1}^3 \frac{m_j p_j}{l_j^2} \left[ v_{r,i} \partial_r v_{z,j} + \frac{v_{\theta,i}}{r} \partial_\theta v_{z,j} + v_{z,i} \partial_z v_{z,j} \right] \end{align}
 \begin{align} &={-} \sum_{i=1}^3 \sum_{j=1}^3 \frac{m_j p_j}{l_j^2} \left( \boldsymbol{v}_i \boldsymbol{\cdot} \boldsymbol{\nabla} \right) v_{z,j}. \end{align}
Finally, the buoyancy term is directly proportional to the vertical velocity, so that
 \begin{equation} - \left(\boldsymbol{v} \boldsymbol{\cdot} \boldsymbol{\nabla} \right) b ={-} \sum_{i=1}^3 \sum_{j=1}^3 \left(\boldsymbol{v}_i \boldsymbol{\cdot} \boldsymbol{\nabla} \right) \left( {\rm i} \frac{N^2}{\omega_j} v_{z,j} \right) ={-} \sum_{i=1}^3 \sum_{j=1}^3 {\rm i} \frac{N^2}{\omega_j} \left( \boldsymbol{v}_i \boldsymbol{\cdot} \boldsymbol{\nabla} \right) v_{z,j}. \end{equation}
Appendix B. Fresnel integrals
For the sake of the discussion, we recall the definition of the cosine and sine Fresnel integrals,  $x \mapsto {\mathsf{C}}(x)$ and
 $x \mapsto {\mathsf{S}}(x)$, respectively, for
 $x \in \mathbb {R}$ (Olver et al. Reference Olver, Lozier, Boisvert and Clark2010),
 \begin{equation} {\mathsf{C}}(x) = \int_0^x \cos \left( \frac{1}{2} {\rm \pi}t^2 \right) \text{d} t \quad \mathrm{and}\quad {\mathsf{S}}(x) = \int_0^x \sin \left( \frac{1}{2} {\rm \pi}t^2 \right) \text{d} t. \end{equation}
The ‘modified’ cosine and sine Fresnel integrals, defined by  $x \mapsto {\mathsf{C}}(x) / x$ and
 $x \mapsto {\mathsf{S}}(x) / x$, respectively, for
 $x \in \mathbb {R}$, and used in the asymptotic developments aforementioned, are plotted in figure 13(a) for
 $x \in [0;\ 30]$ with a zoomed-in version in figure 13(b) for
 $x \in [0; 5]$. The values at
 $x=0$ (
 $0$ and
 $1$ for the modified cosine and sine Fresnel integrals) can be seen, as well as the rapid decay towards zero for larger values of
 $x$.
Plots of the modified cosine and sine Fresnel integrals.