INTRODUCTION
Accurate estimates of ruminally undegraded (RU) protein and its intestinal digestibility in feeds are basic parameters in the actual systems for protein nutrition in ruminants (NRC 2001; INRA 2007). In addition, these estimates should be extended to the amino acids (AA) to improve the efficiency of N use and to reduce the contamination associated with N inefficiency.
Dehydrated sugar beet pulp (DBP) is a bulky raw material rich in digestible fibre as a consequence of its high pectin content and low lignification. Because of its high energy content, DBP is usually included in total mixed rations for productive ruminants (especially dairy animals) to reduce the inclusion of cereal grains and, therefore, to diminish the digestive problems associated with an excess of starch. Previous research (Madsen & Hvelplund Reference Madsen and Hvelplund1985; Pereira & González Reference Pereira and González2004), in addition to library values reported by protein nutrition systems or feed tables (Vérité Reference Vérité, Jarrige and Alderman1987; NRC 2001; Sauvant et al. Reference Sauvant, Perez and Tran2002), indicated that the ruminal degradability of crude protein (CP) in DBP is relatively low (c. 0·35–0·50). However, there are several factors that may affect the accuracy of these estimates. In fact, most values for DBP have been obtained without correcting the contamination of rumen-incubated residues with adherent microorganisms, in spite of the fact that high contamination rates lead to large underestimations of degradability (Bernard et al. Reference Bernard, Marvalin, Yang and Poncet1988; Rodríguez & González Reference Rodríguez and González2006). Another cause of underestimation is that usual values have been obtained considering only the rumen residence time derived from the outflow rate of feed particles (k p) and not the time spent in the process of particle conditioning necessary for this escape, represented by the particle comminution rate (k c). This last underestimation varies as a function of the k c value and the feed degradative characteristics (González et al. Reference González, Ouarti, Rodríguez and Alvir2006, Reference González, Faría-Marmol, Arroyo, Centeno and Martínez2010; Arroyo & González Reference Arroyo and González2013). Pereira & González (Reference Pereira and González2004) and Rodríguez & González (Reference Rodríguez and González2006) observed sigmoid degradation kinetics of CP in DBP, which should be also taken into account to assure accuracy. As ruminal degradation determines the digestion site, errors in degradability also affect the accuracy of the intestinal digestibility estimates. Studies on intestinal digestibility of CP on DBP, as well as those on degradability and intestinal digestibility of AA, are scarce. In addition, it should be stressed that accurate estimates of intestinal digestion should be performed as intestinal effective digestibility (IED), namely considering the entire flow of undegraded feed. The objectives of the current study were to establish, under accurate conditions, the RU fraction and IED of CP and AA in DBP to clarify its protein value.
MATERIALS AND METHODS
Dehydrated sugar beet pulp sample, animals and feeding
A sample without addition of urea or molasses, provided by an extraction plant, was tested on three wethers fitted with rumen cannulae (internal diameter 60 mm) and T-type duodenal cannulae (internal diameter 12 mm). Wethers were fed with a 2 : 1 (fresh weight basis) chopped oat hay-to-concentrate diet containing 136 and 402 g/kg dry matter (DM) of CP and neutral detergent fibre (NDF), respectively. The diet was started 10 days before the experimental period, at 40 g DM/kg BW0·75 in six equal meals (every 4 h), starting at 09.00 h. Wethers were housed in individual pens and handled according to the animal care principles as published in the Spanish Royal Decree 1201/2005 (BOE 2007). The DBP sample was ground to pass a 2-mm screen for in situ studies and to pass a 1-mm screen for chemical composition, including AA contents.
Experimental procedures
The experimental schedule to evaluate DBP included: (i) its incubation in nylon bags in the rumen, labelling micro-organisms with 15N to correct the microbial contamination of these residues, (ii) a transit study of the dietary concentrate particles, (iii) the isolation from rumen contents of solid adherent bacteria (SAB) to be used as a reference to correct microbial contamination and (iv) a study of the intestinal digestion of rumen undegraded feed.
A solution of 15N enriched ammonium sulphate (98 atoms%, i.e. 98 of 100 atoms correspond to the 15N isotope) was continuously infused into the rumen (25 mg N15/wether/day) to label micro-organisms, beginning 5 days before the start of the ruminal incubations and continuing till the end. Before suppressing this infusion, representative samples of rumen content were obtained for SAB isolation as described by Rodríguez et al. (Reference Rodríguez, González, Alvir, Repetto, Centeno and Lamrani2000). These isolates were lyophilized and analysed for DM, organic matter (OM), CP, 15N/N and AA.
Ruminal incubations were performed using nylon bags (internal dimensions 110×70 mm) with a pore size of 46 μm (Saatilon, SAATI Serigrafia Iberica S.A., Almazora, Castellón, Spain) filled with c. 3 g (air-dry basis) of DBP. A total of 12 bags were incubated in the rumen of each animal in two incubation series for 2, 4, 8, 16, 24 and 48 h. All bags were placed in the rumen simultaneously in each series, just before the wethers were offered their first meal in the morning (i.e. at 09.00 h). Bags were washed with tap water and stored at −20 °C after collection from the rumen. After thawing, bags were washed three times for 5 min each in a turbine washing machine (Jata 580; JATA, Zubibitarte, 8 - 48220 Abadiano, Bizkaia, Spain). The same procedure was applied to two series of two bags to obtain the water insoluble fraction (0 h value). Afterwards, the bags were again stored at −20 °C, freeze-dried and immediately weighed to establish the degradation kinetics of DM. As these kinetics had a sigmoid behaviour in all wethers, DM disappearance (d) with rumen residence time (t, h) was fitted by the model of Van Milgen & Baumont (Reference Van Milgen and Baumont1995):
 $$d = a + b \times \displaystyle{{(1 - {\rm e}^{k_\infty t} )} \over {[1 + ({{(k_\infty - k_0 )} / {k_0}} ) \times {\rm e}^{ - k_\infty t} ]}}$$
In this model, the constants a and b represent, respectively, the proportions of the soluble fraction and the non-soluble but degradable component, which disappears at a fractional rate per unit time which varies from k 0 to k ∞. The undegradable fraction (r) was estimated as 1−(a+b). The RUDM was determined as the complementary value of that proposed by Gómez (Reference Gómez1997) to determine the effective degradability when ruminal degradation kinetics showed a sigmoid behaviour. Values of RUDM were estimated when only k p was used (RUDMp) and when k c and k p were used jointly (RUDMc,p) as:
 $${\rm RUDM}_{\rm p} = 1 - \left[ {a + bk_0 k_\infty ^2 \int_0^\infty {\displaystyle{{{\rm e}^{( - k_{\rm p} - k_\infty )t}} \over {(k_0 (k_\infty - k_0 ){\rm e}^{ - k_\infty t} )^2}} {\rm d}t}} \right]$$
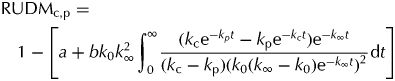 $$\eqalign{{\rm RUDM}_{{\rm c,p}}} =1 - \left[{a + bk_0 k_\infty ^2 \int_0^\infty {\displaystyle{{(k_{\rm c} {\rm e}^{ - k_p t} - k_{\rm p} {\rm e}^{ - k_c t} ){\rm e}^{ - k_\infty t}} \over {(k_{\rm c} - k_{\rm p} )(k_0 (k_\infty - k_0 ){\rm e}^{ - k_\infty t} )^2}} {\rm d}t}} \right]$$
The primitive functions of these integrals were not found and therefore RUDM values were determined by mathematical approximation using the mathematical calculation software Derive 2 (Soft Warehouse Inc., Honolulu, USA).
Values of k p and k c were derived from the study of particle transit in the rumen-reticulum. This was performed between both incubation series by pulse dosing each animal with 50 g of the dietary concentrate labelled with ytterbium (Yb) before the first morning meal (i.e. at 09.00 h), which was normally consumed in 20 min. This concentrate had previously been washed with a commercial detergent in an automatic washing machine to eliminate its soluble components (Udén et al. Reference Udén, Colucci and Van Soest1980) and labelled by immersion for 24 h in a solution at pH 2·2 of YbCl3 (10 mg Yb/g of feed) and citric acid (0·7 mol/mol of YbCl3) to avoid marker fixation in sites with low affinity. Finally, the residue was carefully washed with water and oven-dried at 65 °C for 48 h. A total of 21 samples were obtained from the duodenal cannulae, the first sample before supplying the marker and the remainder between 1 and 96 h afterwards. These samples were oven-dried at 60 °C, milled (through 1 mm screen) and analysed for Yb. The pattern of Yb concentrations in duodenal digesta over time was described for each animal using the model of Dhanoa et al. (Reference Dhanoa, Siddons, France and Gale1985). In agreement with Ellis et al. (Reference Ellis, Matis and Lascano1979) and González et al. (Reference González, Ouarti, Rodríguez and Alvir2006), primary and secondary rate constants of this model were assumed as k p and k c values, respectively.
Values of RU of DM, CP, OM and AA non-corrected or corrected by microbial contamination were determined considering both k p and k c transit rates with the method proposed by Arroyo & González (Reference Arroyo and González2013). This method is based on generating composite samples representative of the chemical composition of the RUDM. For this purpose, the residues obtained at each incubation time were pooled in equal quantities for each animal. The resultant residues for 0, 2, 4, 8, 16, 24 and 48 h of incubation were considered representative of the composition of the rumen outflow of undegraded feed in the intervals 0–1, 1–3, 3–6, 6–12, 12–20, 20–36 and 36–72 h, respectively. Then the rumen outflow of undegraded feed in these intervals was established by the function proposed by Arroyo & González (Reference Arroyo and González2013). The proportions in which the different residues were mixed were calculated by the quotient of the flow in each interval and the total flow. The flow function cited above was established by considering single exponential kinetics. For this reason, single exponential kinetics equivalent to previous sigmoid kinetics were established using the previous values of a, b and r, and a constant degradation rate (0·058±0·0079 (standard deviation (s.d.)) providing the same RUDMc,p values. The composite samples were analysed for CP, OM, AA and 15N/total N. The respective RU values were determined from the concentrations of the tested fraction in the composite samples (Y) and in the whole feed (X) and the RUDMc,p values, as follows:
 $${\rm RU} = Y \times {\rm RUDM}_{{\rm c,p}} /X$$
After a 10-day resting period to eliminate the 15N enrichment from the digesta, the IED of DM, CP and AA were determined. For this purpose, eight sub-samples (c. 200 mg) from the composite samples of each wether were weighed into mobile nylon bags with an approximately round shape (diameter c. 30 mm). These bags were introduced through the duodenal cannula and recovered in the faeces. Bags were inserted randomly at a rate of one bag every 15 min (8 bags/wether/day). The bags were subsequently processed by same methods as for rumen incubations, dried at 70 °C for 48 h and weighed. The IED of DM was calculated as the disappearance of DM from the bag during the intestinal incubation. Finally, the undigested residues obtained in each wether were pooled prior to CP, AA and 15N/total N analysis. The IED of each fraction was determined from its concentration in the composite samples (Y) and in the intestinal incubated residues (Z), and the values of IED of DM:
 $${\rm IED} = {\rm 1}-[Z \times ({\rm 1}-{\rm IED}\,{\rm of}\,{\rm DM})/Y]$$
The microbial proportions of N and DM in the composite samples and in the intestinal incubated residues were determined using SAB as a reference as indicated by Rodríguez & González (Reference Rodríguez and González2006). The microbial proportions of OM were established as microbial DM×(OM in SAB/OM in the tested residue). The microbial contribution to a specific AA was determined as the microbial DM content of these samples×AA concentration in SAB expressed on DM.
Chemical analyses
Analyses of DBP, incubated residues or SAB were performed by the methods of AOAC (2000) for DM (procedure 934·01), ash (procedure 967·05), ether extract (procedure 920·39) and CP (N×6·25; procedure 968·06). Analyses of NDF (Van Soest et al. Reference Van Soest, Robertson and Lewis1991), acid detergent fibre (ADF) and acid detergent lignin (ADL) (Robertson & Van Soest Reference Robertson, Van Soest, James and Theander1981) were also performed in DBP. The insoluble nitrogen in neutral detergent (NDIN) and in acid detergent (ADIN) solutions was determined by N analysis of the respective residues. Ytterbium in duodenal contents was analysed in nitric acid extracts (Rodríguez et al. Reference Rodríguez, González, Alvir, Repetto, Centeno and Lamrani2000) by inductively coupled plasma emission spectroscopy (Perkin Elmer, ICP 5000). Nitrogen isotopic proportions were analysed by mass spectrometry (Barrie et al. Reference Barrie, Brookes, Prosser and Debney1995). Amino acids were determined after acid hydrolysis using alpha-aminobutyric acid as the internal standard. Therefore, tryptophan was not measured in the current study. This hydrolysis was preceded by an oxidation with performic acid to obtain methionine and cysteine values. These analyses were performed by using the HPLC system, after derivatizing AA with AQC (6-aminoquinolyl-N-hydroxysuccinimidyl carbamate) in accordance with Liu et al. (Reference Liu, Chang, Yan, Yu and Liu1995).
Statistical methods
The kinetics associated with the models used were fitted using non-linear regression models. The effects of the transit model (t: to use k pv. to use k c, k p) on the value of RUDM as well as those of microbial contamination correction (c) in RU, IED and intestinal digested fractions (IDF) of DM, OM, CP and AA were studied by variance analyses by taking into account this primary factor (t or c) as well as the wethers (w) in the model (y ij = μ+t i (or c i)+w j+εij). Considering AA as the primary factor, this same design was also used to compare microbial corrected results of RU, IED and IDF of individual AA v. total analysed AA (TAA) by protected least square differences. Differences between CP and TAA values for these last cited parameters were studied with a split-plot arrangement of treatments considering microbial correction (c) as the whole-plot and the nitrogenous fraction (f) as the sub-plot (y ijk = μ+c i+f j+w k+c i × f j+c i × w k+εijk). All statistical analyses were performed using the GLM procedure of SAS (SAS Institute 1990).
RESULTS
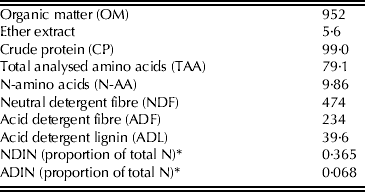
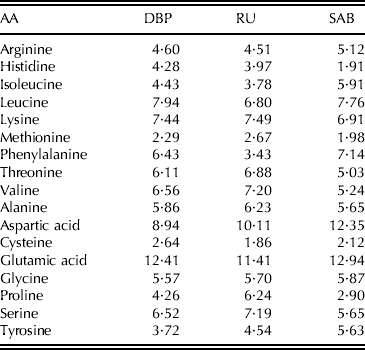
The chemical composition of the DBP sample is shown in Table 1 and AA contents of the original sample and its RU fraction are shown in Table 2.
Chemical composition of tested dehydrated sugar beet pulp (g/kg DM)
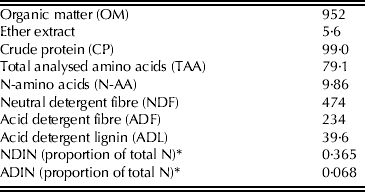
* NDIN and ADIN: insoluble N in NDF and ADF solutions, respectively.
Amino acid proportions (g/100 g of analysed amino acids) of dehydrated sugar beet pulp (DBP), its ruminally undegraded fraction (RU) and solid associated bacteria of the rumen content (SAB)

The k c and k p rates of concentrate particles (±s.d.) used to determine RUDM values and to make up the composite samples were 0·734±0·0354 per h and 0·045±0·0010 per h, respectively.
Mean concentrations (±s.d.) of OM and CP in SAB (g/kg DM) were 803±18·6 and 468±4·5, respectively. The 15N enrichment (atoms%) of these bacteria was 0·101±0·0054. Their AA profile is shown in Table 2 to facilitate its comparison with the profile of both original and RU DBP.
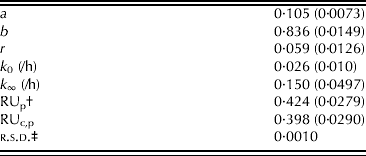
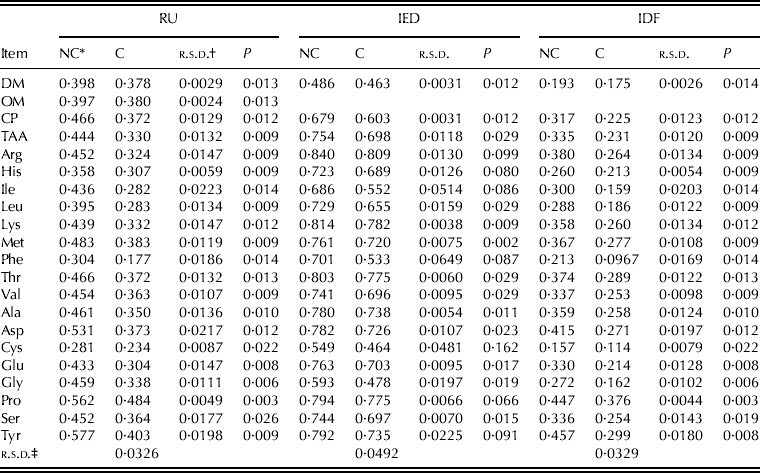
The DM degradation of DBP showed sigmoid kinetics (Table 3) increasing the fractional degradation rate from time 0 (k 0) to ∞ (k ∞) by 5·8 times. A low proportion of undegradable DM (0·059) was another characteristic of this sample. Estimates of RUDM were reduced from 0·424 to 0·398 when k c was taken into account. The composite samples representative of the chemical composition of the RU fraction showed a large microbial contamination (g/kg; ±s.d.) although varying among wethers: 50·1±7·06 in DM and 201±20·3 in CP. Microbial non-corrected or corrected values of RU, IED and IDF of DM, OM (only RU), CP and AA are shown in Table 4. In general, the lack of the microbial correction led to consistent overestimations of all these parameters (P<0·05), although as a result of the high variability recorded, differences for IED in some AA were only shown as a tendency (P<0·1) or did not reach significance such as for cysteine. The RU values of TAA showed a tendency to be lower than those of CP (0·387 v. 0·419 as an average of microbial non-corrected and corrected values of Table 4; residual standard deviation (r.s.d.)=0·022; degrees of freedom (d.f.)=4; P=0·070) and the inverse effect was shown in IED (0·726 v. 0·641; r.s.d.=0·040; d.f.=4; P=0·021). Both compensatory effects resulted in similar IDF estimates (0·283 v. 0·271; r.s.d.=0·029; d.f.=4; P=0·521). The digestive use varied greatly among AA. Thus, corrected results for the RU and its IED ranged from 0·177 to 0·484 and from 0·464 to 0·809, respectively. As a consequence, the digestive process altered the AA profile of the intestinal digested protein. Differences for IDF between the individual AA and TAA (Table 4) allowed identification of these changes. Significant increases were seen for proline (P<0·001), tyrosine and threonine (P<0·05), while methionine showed only a tendency to increase and decreases were recorded in phenylalanine and cysteine (P<0·001) and in isoleucine and glycine (P<0·05).
Apparent rumen degradation kinetics* of dry matter (DM) and calculated ruminally undegraded fraction (RU) according to the used transit model of dehydrated sugar beet pulp
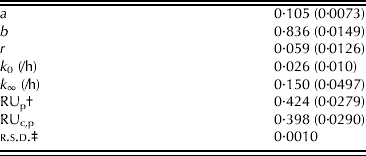
* a, b and r, soluble, non-soluble degradable and undegradable fractions, respectively. k 0–k ∞, fractional degradation rate of b fraction variable from 0 to ∞ time. RUp and RUc,p: based on the particle outflow rate from the rumen (RUp) or on both this rate and that of particle comminution (RUc,p), respectively. Values in brackets are s.d.
† RUp and RUc,p differ at P < 0·001.
‡ r.s.d., residual standard deviation for BP; degrees of freedom (d.f.) = 2.
Effects of correction of microbial contamination on in situ estimates of the ruminally undegraded fraction (RU), intestinal effective digestibility (IED) and intestinal digested fractions (IDF) of dry matter (DM), organic matter (OM), crude protein (CP) and total analyzed (TAA) and individual amino acids of dehydrated sugar beet pulp (values are expressed as proportions of the original feed (RU and IDF) or of RU (IED))
* NC and C non-corrected and corrected values.
† r.s.d.: residual standard deviation; degrees of freedom (d.f.) = 2.
‡ d.f. = 4. Significant differences between corrected values of individual amino acids and TAA: RU: P < 0·1: : Ile, Leu, Met; P < 0·01: Tyr; P < 0·001: Phe, Cys, Pro. IED: P < 0·1: Thr, Pro; P < 0·05: Lys; P < 0·01: Arg, Phe; P < 0·001: Ile, Cys, Gly. IDF: P < 0·1: Met; P < 0·05: Ile, Thr, Gly, Tyr; P < 0·001: Phe, Cys, Pro.
DISCUSSION
Sample characteristics and DM degradation
The chemical composition of the sample tested was in the range defined by most common tables for DBP without additions of urea or molasses (NRC 2001; Sauvant et al. Reference Sauvant, Perez and Tran2002; INRA 2007). Its low content of ash and moderate soluble DM fraction confirm the lack of additives. Its NDIN and ADIN proportions were at the bottom of the range recorded by Pereira & González (Reference Pereira and González2004), indicating that condensations between proteins and carbohydrates resulting from the thermal impact of the industrial process were probably moderate. The present sample showed a good AA profile with a proportion of essential AA higher than 0·50 and high contents of lysine and S-containing AA. Thus, concentrations of essential AA and cysteine were similar or higher than in SAB. However, it was difficult to compare this with the AA composition recorded in feed tables, because bibliography data show a large variability (NRC 2001; CVB 2002; Sauvant et al. Reference Sauvant, Perez and Tran2002; Redshaw et al. Reference Redshaw, Flicker, Fontaine, Heimbeck and Hess2010).
The DM fractioning providing for ruminal availability was similar to that obtained by Alcaide et al. (Reference Alcaide, García and Aguilera2000). Parameters of DM degradation were also within the ranges observed by Pereira & González (Reference Pereira and González2004) for eight DBP without additives. Similarly, the present RUDMp value was identical to the prediction based on the NDF feed content indicated by Pereira & González (Reference Pereira and González2004).
Accuracy of in situ estimates
Accurate degradation models are necessary to obtain precise in situ feed estimates. The fit of a sigmoid model adds difficulty to this evaluation, but increases its accuracy. Sigmoid evolutions have also been observed for the apparent CP degradation of DBP (Pereira & González Reference Pereira and González2004; Rodríguez & González Reference Rodríguez and González2006). Hypotheses have been offered to explain this sigmoid pattern, based on an initial resistance or limitations to degradation of feed tissues (Van Milgen et al. Reference Van Milgen, Murphy and Berger1991; Van Soest Reference Van Soest1994) or on a different compensation of the effects of feed disappearance and microbial contamination over time in largely colonized feeds (González et al. Reference González, Faría-Marmol, Arroyo, Centeno and Martínez2010).
The model considered for feed transit through rumen-reticulum also affects in situ estimates. Usually, k c is not considered in spite of the fact that it represents a non-negligible proportion of the total mean retention time of particles in these compartments (5·74%). The overestimation for the RUDM resulting from this lack (6·53%) increases when the contamination of incubated residues with ruminal adherent micro-organisms is not corrected. Thus, the accumulative overestimation of RUDM caused by the lack of both k c rate and microbial correction was 12·2%. The high contamination values of the current study agree with those shown in DBP by Rodríguez & González (Reference Rodríguez and González2006) and led to large errors in all parameters tested because this contamination is also associated with IED over-evaluations due to the large proportion of adherent ruminal-micro-organisms digested in the intestine (0·914±0·0026 (s.d.) of the ruminal DM biomass, as mean). Errors in ruminal and intestinal incubations were mitigated when the total digestive tract was considered. Nevertheless, the digestion site has great importance for the nutritive value of feed for ruminants through its effects on the nutrient supply to the animal, especially for protein and AA. Thus, the lack of correction led to overestimations of the IDF as large as 40·9% for CP and even more for TAA (45·0%). The recorded IED of CP (0·603) was considerably lower than intestinal digestibility values assumed for this feed by the intestinal digestible protein (PDI; 0·85; Vérité Reference Vérité, Jarrige and Alderman1987) and NRC systems (0·80; NRC 2001). However, these systems omitted k c and the microbial contamination correction, which overestimates the intestinal digestibility (González et al. Reference González, Ouarti, Rodríguez and Alvir2006; Arroyo & González Reference Arroyo and González2013).
The effects of the correction of ruminal microbial contamination were large but variable among AA. A large part of this variation may be due to the differences in the content of individual AA between DBP and SAB. Thus, a direct correlation between the ratio SAB/DBP in each AA and the RU over-evaluation by omitting microbial correction was shown (n=17; r=0·732; P<0·001). The large contamination with microbial AA implies unacceptable errors for the estimates of intestinal digested AA, which makes this correction imperative.
Although only intestinally absorbed AA are of nutritional interest for animal metabolism, feed protein values are usually studied based on CP due to the scarce data available based on AA. However, the present results show lower RU values in TAA than in CP and the opposite effect for IED. These differences may be explained considering that estimates for CP include all N-compounds, whereas those of AA only include chemically hydrolysable proteins and not other compounds with N such as lignin, protein–polyphenol complexes or proteins altered by heat which may be undegradable or highly resistant to ruminal degradation but, in contrast, have a null or low intestinal digestibility. Nevertheless, digestion differences in rumen and intestine were almost compensated. Therefore, the under-evaluation of the IDF by using CP values was not significant, reaching only 2·60%.
Protein value and AA digestion
The protein value of a feed depends on the AA digested in the small intestine from both the microbial protein synthesized from its fermentation in the rumen and its RU protein. Based on the present corrected values for CP and OM and the parameters assumed in the PDI system for the synthesis and digestion of the microbial protein (Vérité Reference Vérité, Jarrige and Alderman1987), both sources represent 54·8 and 22·2 g of intestinal digested AA/kg of DM. The predominance of the first source (c. 2·5 times) shows the interest in reducing the thermal impact in the DBP manufacturing process and, therefore, the level of condensations between proteins and carbohydrates which reduce the feed ruminal degradability. A low NDIN proportion is a good indicator of this quality (Pereira & González Reference Pereira and González2004).
The digestion process led to large changes for the AA proportions in the intestinal digested protein. Evidently, for RU protein these changes are linked to differences among feed proteins in both degradability and AA composition. Degradability differences among DBP proteins are affected, in turn, by several factors. Among these, the location of protein in the cell (protoplasm or cell wall) and in root tissues (parenchyma, phloem or xylem) plays a main role. Cell wall proteins are increased in DBP as a consequence of the industrial extraction process. The hydropathy profile of proteins also may affect the AA degradability (González et al. Reference González, Ouarti, Rodríguez and Centeno2009). Thus, AA included in insoluble proteins which were rich in non-polar and hydrophobic AA (branched-chain AA, cystine, methionine, phenylaalnine) are expected to be degraded to a lesser extent than those of proteins rich in polar and/or hydrophilic AA (acid and basic AA, threonine, tyrosine, glycine and serine). The present RU results provide support mainly to the former cited factor. Thus, most cell wall proteins are hydroxiproline-rich glycoproteins (mainly extensins but also proline-rich proteins and arabinogalactans proteins). This fact agrees with the large RU proline (46·7% higher than that of TAA) and tyrosine, which is also abundant in extensins of sugar beet (Li et al. Reference Li, Kieliszewski and Lamport1990) as well as in proline-rich proteins (Showalter Reference Showalter1993). The high IED shown for proline suggests a large intestinal availability for these cell wall proteins in DBP. The low IED recorded for glycine or cysteine shows that this should not be the case for other cell wall proteins such as glycine-rich proteins or cysteine-rich thionins. A low intestinal digestibility may be suspected for glycine-rich proteins because they are located in the xylem, which showed high degradation resistance (Grenet & Barry Reference Grenet and Barry1990). In spite of its polar character, cysteine is usually one of the most degradation-resistant AA because it is normally present as cystine in proteins and the di-sulphur bond gives it a strong hydrophobic character and high degradation resistance (Mahadevan et al. Reference Mahadevan, Erfle and Sauer1980). The low RU cysteine suggests that a large part is not included in di-sulphur bonds in DBP. Cysteine (together with glycine) provided the lowest IED values in all feeds tested in the experiment of González et al. (Reference González, Ouarti, Rodríguez and Centeno2009), increasing the inefficiency of their intestinal digestion with the increased feed fibre content. This suggests that the inefficiency is associated mainly with the digestion of cell wall proteins. The digestion worsened the absorbed AA profile of DBP as a consequence of the decrease in some essential AA and cysteine. The large reduction observed for this AA due to its high degradability and its low IED is only partially compensated by the increase in methionine. Thus, the proportion of sulphur-containing AA in the intestinal digested protein decreased in relation with the original protein by 17·9%. For lysine, the numerical increase in the intestinal digested protein was 12·6%.
CONCLUSIONS
Using sigmoid degradation models, as well as considering the effect of the particle comminution rate and correcting for the microbial contamination taking place in the rumen, are required to attain accurate estimates of ruminal and intestinal digestion of DBP. The digestion changes the essential AA (plus cysteine) profile with increases for threonine and methionine and decreases for phenylalanine, isoleucine and cysteine. However, the practical impact of these reductions is limited because the microbial protein synthesized from DBP fermentation in the rumen is largely predominant in the AA supply from this feed to the ruminant. Therefore, a high degradability is of interest in order to improve the protein value of this feed.
This work was supported by the CICYT-funded Project AGL 2006-08300. Analyses of 15N isotope ratios were performed at the Servicio Interdepartamental de Investigación, Universidad Autónoma de Madrid. Spain.