1. Introduction
Active continental margins record the evolutionary history of subduction-related magmatic events (Murphy, Reference Murphy2006; Xiao et al. Reference Xiao, Niu, Wang, Lee and Iizuka2016; Lallemand & Heuret, Reference Lallemand and Heuret2017) and can be considered the central region of continental crustal growth (Franz et al. Reference Franz, Lucassen, Kramer, Trumbull, Romer, Wilke, Viramonte, Becchio, Siebel, Oncken, Chong, Franz, Giese, Götze, Ramos, Strecker and Wigger2006; Vogt et al. Reference Vogt, Gerya and Castro2012) in continental collision zones. The Karakoram terrane forms the southern margin of the Asian plate (Jain & Singh, Reference Jain and Singh2008; Searle & Hacker, Reference Searle, Hacker, Treloar and Searle2018), which has witnessed periodic episodes of continental arc magmatism since Early Cretaceous time (Weinberg et al. Reference Weinberg, Dunlap, Whitehouse, Asif Khan, Treloar, Searle and Qasim Jan2000; Fraser et al. Reference Fraser, Searle, Parrish and Noble2001; Heuberger et al. Reference Heuberger, Schaltegger, Burg, Villa, Frank, Dawood, Hussain and Zanchi2007; Upadhyay, Reference Upadhyay2008; Jain & Singh, Reference Jain and Singh2009; Ravikant et al. Reference Ravikant, Wu and Ji2009; Kumar et al. Reference Kumar, Bora, Sharma, Yi and Kim2017). The accretion of the Karakoram with Asia was the result of the separation and northward drifting of the Karakoram from Gondwana that occurred during Permian time (Boulin, Reference Boulin1981; Tapponnier et al. Reference Tapponnier, Mattauer, Proust and Cassaigneau1981). Further, the closure of the Tethys ocean between the Indian and Asian plates along two suture zones, the Indus Tsangpo Suture Zone (ITSZ) in the south and Shyok Suture Zone (SSZ)/Main Karakoram Thrust (MKT) in the north, led to the formation of magmatic arcs during Mesozoic–early Tertiary times (Fig. 1a) (Windley, Reference Windley1988; Jain & Singh, Reference Jain and Singh2008).
Overview map of the Himalayan–Tibetan orogenic belt and geologic map across the Karakoram and Ladakh. (a) Map showing the main tectonic structures and sutures in the Himalaya, Tibet and the Karakoram region. (b) Simplified map showing the regional geology of the eastern Karakoram region (after Phillips, Reference Phillips2008) with the location of the study area in the rectangle. (c) Geological map of the SE Karakoram with the locations of collected samples from the Karakoram Batholith. The Longmu–Ghoza Co fault (LGF) and Angmong fault (AF) are from van Buer et al. (Reference van Buer, Jagoutz, Upadhyay and Guillong2015) (modified after Phillips et al. Reference Phillips, Parrish and Searle2004; Jain & Singh Reference Jain and Singh2008; Ravikant et al. Reference Ravikant, Wu and Ji2009). (Sample location SM 9 includes both SM 9A and SM 9B).

A significant amount of data have been published to constrain the magmatic evolution of the Ladakh and Karakoram regions, which has helped to understand the geodynamic evolution of the India–Asia collision zone (e.g. Searle et al. Reference Searle, Windley, Coward, Cooper, Rex, Rex, Tingdong, Xuchang, Jan, Thakur and Kumar1987; Klootwijk et al. Reference Klootwijk, Gee, Peirce, Smith and McFadden1992; Rowley, Reference Rowley1996; Najman et al. Reference Najman, Appel, Boudagher-Fadel, Bown, Carter, Garzanti, Godin, Han, Liebke, Oliver and Parrish2010; Hu et al. Reference Hu, Garzanti, Wang, Huang, An and Webb2016). However, the timing of suturing along the SSZ is still not well constrained as the existing chronological data provide a wide bracket ranging from ~110 Ma to ~75 Ma for the suturing event (Petterson & Windley, Reference Petterson and Windley1985; Treloar et al. Reference Treloar, Petterson, Jan and Sullivan1996; Rolland et al. Reference Rolland, Pêcher and Picard2000; Heuberger et al. Reference Heuberger, Schaltegger, Burg, Villa, Frank, Dawood, Hussain and Zanchi2007; Ravikant et al. Reference Ravikant, Wu and Ji2009; Borneman et al. Reference Borneman, Hodges, Soest, Bohon, Wartho, Cronk and Ahmad2015; Kumar et al. Reference Kumar, Bora, Sharma, Yi and Kim2017). In this paper, we present new whole-rock geochemical data along with laser ablation multi-collector inductively coupled plasma mass spectrometry (LA-MC-ICP-MS) zircon U–Pb ages on the rhyolite and granites exposed in an unexplored remote region of the Karakoram Batholith that crops out along the upper Shyok Valley. The present paper provides a viable model for the timing and process of suturing along the SSZ. The fundamental basis for our proposed model is the evolution of rhyolite as a result of assimilation fractional crystallization (AFC), i.e. fractional crystallization of calc-alkaline subduction-derived melt accompanying the assimilation of thickened Asian continental margin in the Karakoram basement owing to the collision of the Kohistan–Ladakh arc (KLA) orogen (for example, Manikyamba et al. Reference Manikyamba, Saha, Santosh, Ganguly, Singh, Rao and Lingadevaru2014).
2. Background
2.a. Geological setting
The Karakoram terrane juxtaposes the SSZ on its southern margins (Coward et al. Reference Coward, Jan, Rex, Tarney, Thirlwall and Windley1982, Reference Coward, Rex, Khan, Windley, Broughton, Luff, Petterson, Pudsey, Coward and Ries1986; Pudsey et al. Reference Pudsey, Coward, Luff, Shackleton, Windley and Jan1985) and the Rushan–Pshart Suture (RPS) zone to the north (Shvolman, Reference Shvolman1978; Rex et al. Reference Rex, Searle, Tirrul, Crawford, Prior, Rex and Barnicoat1988) (Fig. 1a, b). This terrane can be divided from south to north into four litho-domains, viz. (a) the Karakoram Fault Zone (KFZ); (b) the Karakoram Metamorphic Complex (KMC), which includes the Shyok Metamorphic Complex (SMC), Tangtse Metamorphic Complex (TMC), Pangong Metamorphic Complex (PMC) and Arganglas Metamorphics; (c) the Karakoram Batholith (KB); and (d) the Karakoram Tethys Sequence (KTS) (Rai, Reference Rai1995; Searle et al. Reference Searle, Weinberg, Dunlap, Holdsworth, Strachan and Dewey1998; Jain & Singh, Reference Jain and Singh2008) (Fig. 1b, c).
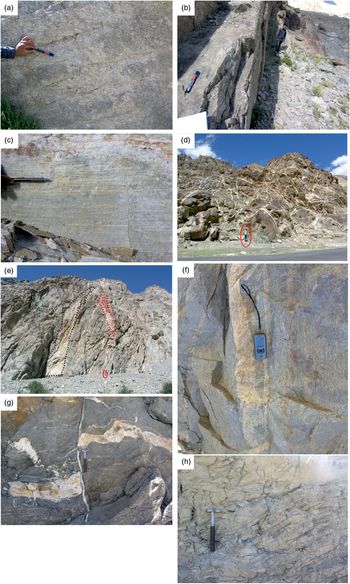
The KFZ is characterized by the presence of ductile deformed rocks in the north of the SSZ that formed as a result of dextral deformation along the Karakoram Fault (KF). In the eastern Karakoram region, the KF passes through the Nubra Valley (Fig. 1b, c) with a major restraining bend that splays into two strands, viz. the Tangtse strand and Muglib strand, as shown in Figure 1c. The Tangtse strand passes through Darbuk and Tangtse villages, while the Muglib strand passes through Shyok and Muglib villages (Fig. 1c). These two strands bound a transpressional uplifted metamorphic complex that is mainly dominated by high-grade metamorphic rocks intruded by foliation-parallel and cross-cutting leucocratic dykes (Searle et al. Reference Searle, Weinberg, Dunlap, Holdsworth, Strachan and Dewey1998; Phillips et al. Reference Phillips, Parrish and Searle2004; Rolland et al. Reference Rolland, Mahéo, Pecher and Villa2009; Boutonnet et al. Reference Boutonnet, Leloup, Arnaud, Paquette, Davis and Hattori2012). The KF exposes well-deformed rocks in a ~1–8 km wide zone that mainly comprise mylonitic granite gneiss with steep vertical foliations, having nearly horizontal stretching lineations (Figs 1c, 2a–c). The KFZ is primarily composed of mylonitic granite gneiss, volcanic rocks, slate, phyllite and amphibolite (e.g. Boutonnet et al. Reference Boutonnet, Leloup, Arnaud, Paquette, Davis and Hattori2012; Sen et al. Reference Sen, Mukherjee and Collins2014). The ductile deformation along the KF in this region was initiated at ~23 Ma or probably during ~18–15 Ma (Weinberg et al. Reference Weinberg, Dunlap, Whitehouse, Asif Khan, Treloar, Searle and Qasim Jan2000; Phillips et al. Reference Phillips, Parrish and Searle2004; Boutonnet et al. Reference Boutonnet, Leloup, Arnaud, Paquette, Davis and Hattori2012). Tectono-metamorphic studies (Rolland & Pêcher, Reference Rolland and Pêcher2001), teleseismic studies using receiver functions (Hazarika et al. Reference Hazarika, Sen and Kumar2014; Hazarika et al. Reference Hazarika, Paul, Wadhawan, Kumar, Sen and Pant2017) and He-isotopic investigations in geothermal springs (Klemperer et al. Reference Klemperer, Kennedy, Sastry, Makovsky, Arinarayana and Leech2013) suggest the nature of the KF as lithospheric.
Outcrop-scale structures from the KFZ and upstream Shyok Valley. (a) Horizontal lineations representing the Tangtse strand of the KFZ. (b) Vertical foliation near the Tangtse strand of the KFZ. (c) Horizontal lineations representing the Muglib strand of the KFZ. Pen for scale is ~ 13 cm long. (d) Migmatization in the TMC of the KFZ. (e) Foliation-parallel (black) and cross-cutting (red) leucocratic dyke intrusions within the SMC. (f) Leucocratic dyke intrusions parallel to the foliation plane within the SMC. GPS for scale is ~30 cm long. (g) Normal faulting showing extensional feature in the north of the Shyok–Muglib strand. (h) Well-exposed marble near the Pangong Tso region in the Tangtse Valley. Geological hammer for scale is ~33 cm long.

The KMC extends all along the southern margin of the Asian plate and provides records of pre- to post India–Asia collisional high-grade metamorphic rocks (e.g. ~108 Ma: Streule et al. Reference Streule, Phillips, Searle, Waters and Horstwood2009; ~32–8 Ma: Rolland et al. Reference Rolland, Mahéo, Pecher and Villa2009; Boutonnet et al. Reference Boutonnet, Leloup, Arnaud, Paquette, Davis and Hattori2012). Pre- to syn-collisional metamorphism has been reported from the western Karakoram (e.g. from the Hunza region) (Fraser et al. Reference Fraser, Searle, Parrish and Noble2001) and the Pangong region of the eastern Karakoram as well (Rolland et al. Reference Rolland, Mahéo, Pecher and Villa2009; Streule et al. Reference Streule, Phillips, Searle, Waters and Horstwood2009; Wallis et al. Reference Wallis, Phillips and Lloyd2014). This metamorphism has been attributed to pre-collisional magmatism, the accretion of the KLA with the Asian plate, and the subsequent collision of India and Asia (Fraser et al. Reference Fraser, Searle, Parrish and Noble2001; Rolland et al. Reference Rolland, Mahéo, Pecher and Villa2009; Streule et al. Reference Streule, Phillips, Searle, Waters and Horstwood2009; Wallis et al. Reference Wallis, Phillips and Lloyd2014). However, the post-collisional metamorphism has been attributed either to ductile deformation along the KF that has exposed greenschist- to granulite-grade metamorphic rocks along the KFZ (e.g. Weinberg et al. Reference Weinberg, Mark and Reichardt2009; Rolland et al. Reference Rolland, Mahéo, Pecher and Villa2009) or to compression and crustal thickening led by India–Asia continental collision (Searle et al. Reference Searle, Weinberg, Dunlap, Holdsworth, Strachan and Dewey1998; Phillips et al. Reference Phillips, Parrish and Searle2004; Phillips & Searle, Reference Phillips and Searle2007; Searle & Phillips, Reference Searle and Phillips2007).
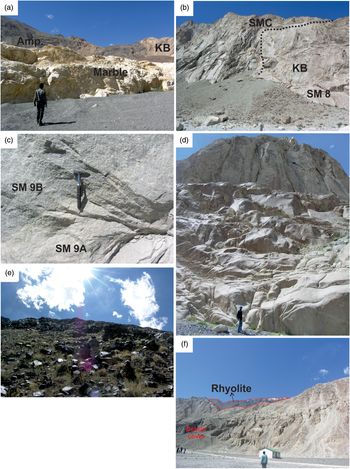
In the eastern Karakoram, the highly metamorphosed and migmatized rocks of the KMC are best exposed near the Darbuk, Shyok and Tangtse regions of Ladakh, NW India (Fig. 1c). The Tangtse and Muglib strands of the KF bound the TMC or Pangong Injection Complex (PIC) (Figs 1c, 2d) (Weinberg & Searle, Reference Weinberg and Searle1998; Jain & Singh, Reference Jain and Singh2008). The TMC mainly consists of high-grade metamorphic rocks such as amphibolites, orthogneisses and migmatites that are intruded by several foliation-parallel and cross-cutting leucogranite-pegmatite dykes (Searle et al. Reference Searle, Weinberg, Dunlap, Holdsworth, Strachan and Dewey1998; Phillips et al. Reference Phillips, Parrish and Searle2004; Rolland et al. Reference Rolland, Mahéo, Pecher and Villa2009; Boutonnet et al. Reference Boutonnet, Leloup, Arnaud, Paquette, Davis and Hattori2012). The age of metamorphism in this region has been reported to be 32–11 Ma (Rolland et al. Reference Rolland, Mahéo, Pecher and Villa2009). Similar high-grade metamorphic rocks have also been observed in the present study even to the north of the Shyok–Muglib strand of the KF, upstream along the Shyok Valley, and referred to herein as the SMC (Figs 1c, 2e, f). The KF system forms a junction with the left-lateral Longmu–Ghoza Co fault in the region of the SMC (Fig. 1c). This intersection has resulted in the formation of an extensional detachment system (Fig. 1c) (van Buer et al. Reference van Buer, Jagoutz, Upadhyay and Guillong2015; Bohon et al. Reference Bohon, Hodges, Tripathy-Lang, Arrowsmith and Edwards2018). One can observe the extensional and strike-slip deformation-related features of these fault systems in the field only within a narrow zone of 5–10 km in the vicinity of the Muglib strand of the KF (Figs 1c, 2g). Medium-to-low-grade metamorphic rocks that mainly consist of schists, slates, marble and amphibolites are exposed to the northeast of the Muglib strand and are locally named the PMC, which forms part of the KMC (Fig. 1c). These rocks are well exposed near the Pangong Tso region in the Tangtse Valley (Figs 1c, 2h) and as thin patches in the Shyok Valley upstream (Fig. 3a).
Outcrop-scale structures from the upstream Shyok Valley. (a) Marble and amphibolite schist of the PMC mapped along the Shyok river in the NE of the Shyok–Muglib strand of the KF. (b) Contact of the SMC with the KB. (c) Porphyritic granites with large laths of K-feldspar and plagioclase feldspar. Geological hammer for scale is ~33 cm long. (d) Undeformed granite body of the KB. (e, f) Contact of the Murgo Volcanics (rhyolites) with the KB.

The KB that forms the litho-unit to the north of the KMC (Fig. 1b) extends from northern Pakistan to southwestern Tibet through the Ladakh region of the eastern Karakoram, India (Rai, Reference Rai1995). Two types of granites, metaluminous (I-type) and peraluminous (S-type) granites (Chappell & White, Reference Chappell and White1974), have been reported from the KB, and intrude the Karakoram Tethyan Zone (Srimal et al. Reference Srimal, Basu and Kyser1987; Rai, Reference Rai1995; Jain & Singh, Reference Jain and Singh2008; Ravikant et al. Reference Ravikant, Wu and Ji2009). The pre-collisional I-type suite comprises mainly quartz monzonite, granodiorite and tonalite, while the post-collisional S-type suite is composed mainly of two-mica leucogranites (Phillips et al. Reference Phillips, Parrish and Searle2004; Ravikant, Reference Ravikant2006; Jain & Singh, Reference Jain and Singh2008; Leloup et al. Reference Leloup, Boutonnet, Davis and Hattori2011).
The unexplored undeformed region of the KB lying to the north of the SMC and PMC forms the site of the present investigation (Fig. 1c). The intrusive contact of the KB with the SMC (Fig. 3b) and PMC is sharp (Fig. 3a). The KB is mainly composed of massive porphyritic granites that are devoid of any foliation or lineations (Figs 1c, 3c, d), unlike the rocks of the TMC and SMC, which are strongly foliated (Fig. 2b, f). Field relationships indicate that the northern (undeformed) domain of the KB did not experience metamorphism or deformation during the collisional or post-collisional regimes (Fig. 3c, d). Modally, the granitoids range in composition from granite to granodiorite. Texturally, the porphyritic granites of the KB consist of randomly oriented ~2–5 cm long plagioclase and K-feldspar crystals embedded in a fine-grained felsic matrix (Fig. 3c). The undeformed extrusive felsic volcanic rocks (rhyolite), referred to herein as the Murgo Volcanics (MV), can be observed exposed within the KB (Figs 1c, 3e, f). The contact of the rhyolite with the granite is poorly exposed and not assessed owing to inaccessible topography and debris cover. However, it appears that the rhyolite rests over the regionally exposed KB (Fig. 3f). Texturally, the rhyolite is mainly aphanitic and consists of tiny (up to 1 mm long) crystals of quartz and K-feldspar.
The rocks of the KB are in juxtaposition with the KTS of Permo-Carboniferous to Middle Jurassic age to the north. This block of the Karakoram terrane is equivalent to the Qiangtang Block of Tibet (Fig. 1b) (Searle, Reference Searle and Shubert2015). The KTS consists of limestone, shale, slate, sandstone and quartzite to the north of the KB along the upper Shyok Valley (Gergan & Pant, Reference Gergan, Pant, Thakur and Sharma1983) (Fig. 1b), but the burial and exhumation history of these sediments is still unknown.
2.b. Previous geochronological record
The SSZ represents the region of the initial subduction phase of the Neo-Tethyan oceanic lithosphere beneath the southern margin of the Asian plate (Crawford & Searle, Reference Crawford and Searle1992; Searle et al. Reference Searle, Weinberg, Dunlap, Holdsworth, Strachan and Dewey1998; Heuberger et al. Reference Heuberger, Schaltegger, Burg, Villa, Frank, Dawood, Hussain and Zanchi2007; Kumar et al. Reference Kumar, Bora, Sharma, Yi and Kim2017). The subduction of Neo-Tethyan oceanic lithosphere produced the large-scale NW–SE-striking KB, which mainly comprises pre-collisional subduction-related calc-alkaline granites emplaced during Cretaceous time or earlier (Fig. 1c) (Debon et al. Reference Debon, Le Fort, Dautel, Sonet and Zimmermann1987; Crawford & Searle, Reference Crawford and Searle1992; Searle et al. Reference Searle, Weinberg, Dunlap, Holdsworth, Strachan and Dewey1998; Heuberger et al. Reference Heuberger, Schaltegger, Burg, Villa, Frank, Dawood, Hussain and Zanchi2007; Kumar et al. Reference Kumar, Bora, Sharma, Yi and Kim2017). In the NW region of the Karakoram, these granites include the Hunza plutonic unit (~105 Ma; Fraser et al. Reference Fraser, Searle, Parrish and Noble2001), K2 gneiss (~120–115 Ma; Searle et al. Reference Searle, Parrish, Tirrul and Rex1990), Tirich Mir granite (~121–115 Ma; Desio et al. Reference Desio, Tongiorgl and Ferrara1964; Heuberger et al. Reference Heuberger, Schaltegger, Burg, Villa, Frank, Dawood, Hussain and Zanchi2007), Muztag Tower unit (~82 Ma; Searle et al. Reference Searle, Cooper, Rex and Colchen1988) and Hushe gneiss (~145 Ma; Searle et al. Reference Searle, Rex, Tirrul, Rex, Barnicoat, Windley, Malinconico and Lillie1989). In the eastern Karakoram, these are recognized as the Tirit granites (~110–68 Ma; Weinberg et al. Reference Weinberg, Dunlap, Whitehouse, Asif Khan, Treloar, Searle and Qasim Jan2000; Jain & Singh, Reference Jain and Singh2008; Upadhyay, Reference Upadhyay2008; Kumar et al. Reference Kumar, Bora, Sharma, Yi and Kim2017) and Panamik granite in the Khalsar–Panamik region (~105 Ma) (Rao & Rai, Reference Rao and Rai2009; Ravikant et al. Reference Ravikant, Wu and Ji2009) exposed in the Nubra Valley, Ladakh region of NW India (Fig. 1c).
The SSZ exposes calc-alkaline volcanic rocks in the Khardung and Shyok formations in the Ladakh region (Thakur et al. Reference Thakur, Virdhi, Rai and Gupta1981; Srimal et al. Reference Srimal, Basu and Kyser1987; Dunlap & Wysoczanski, Reference Dunlap and Wysoczanski2002; Borneman et al. Reference Borneman, Hodges, Soest, Bohon, Wartho, Cronk and Ahmad2015) (Fig. 1c). The Khardung Formation includes felsic and intermediate volcanic rocks, tuffs and sediments (Thakur et al. Reference Thakur, Virdhi, Rai and Gupta1981; Srimal et al. Reference Srimal, Basu and Kyser1987; Kumar et al. Reference Kumar, Bora and Sharma2016). Geochemically, the Khardung Volcanics are calc-alkaline and are considered to be the volcanic counterpart of the Ladakh Batholith (Srimal et al. Reference Srimal, Basu and Kyser1987; Weinberg & Dunlap, Reference Weinberg and Dunlap2000; Thanh et al. Reference Thanh, Itaya, Ahmad, Kojima, Ohtani and Ehiro2010; Kumar et al. Reference Kumar, Bora, Sharma, Yi and Kim2017). Dunlap & Wysoczanski (Reference Dunlap and Wysoczanski2002) reported a zircon U–Pb age of ~67 Ma for the rhyolite and an intrusion age of ~60 Ma for a porphyritic sill from the Khardung Volcanics, defining Late Cretaceous – early Tertiary ages for the eruption of the volcanic rocks. The Shyok Formation includes sediments and volcanic mafic to ultramafic rocks (Thakur et al. Reference Thakur, Virdhi, Rai and Gupta1981). The minimum age of volcanism in the Shyok Formation has been reported to be ~125 Ma, based on an 40Ar–39Ar hornblende age from a hypabyssal dyke from the eastern Karakoram (Borneman et al. Reference Borneman, Hodges, Soest, Bohon, Wartho, Cronk and Ahmad2015), and older than c. 110 Ma, inferred from the intrusive relationship of the Tirit granites (c. 110–104 Ma) with the Shyok Volcanics (Kumar et al. Reference Kumar, Bora, Sharma, Yi and Kim2017).
Records of post-India–Asia collision-related two-mica (S-type) granites within the KB have also been found, which were emplaced during Miocene time as a result of either crustal rejuvenation due to compressional heating or dextral shearing along the KF (Searle et al. Reference Searle, Rex, Tirrul, Rex, Barnicoat, Windley, Malinconico and Lillie1989; Phillips et al. Reference Phillips, Parrish and Searle2004; Ravikant, Reference Ravikant2006; Boutonnet et al. Reference Boutonnet, Leloup, Arnaud, Paquette, Davis and Hattori2012). The two-mica (S-type) granites extend from the NW to SE regions of the Karakoram, and include the Baltoro plutonic unit (~21 Ma; Searle et al. Reference Searle, Cooper, Rex and Colchen1988; Parrish & Tirrul, Reference Parrish and Tirrul1989; Fraser et al. Reference Fraser, Searle, Parrish and Noble2001) and leucogranite intrusions within the TMC (21–14 Ma; Searle et al. Reference Searle, Weinberg, Dunlap, Holdsworth, Strachan and Dewey1998; Phillips et al. Reference Phillips, Parrish and Searle2004; Jain & Singh, Reference Jain and Singh2008; Ravikant et al. Reference Ravikant, Wu and Ji2009; Reichardt et al. Reference Reichardt, Weinberg, Andersson and Fanning2010; Leloup et al. Reference Leloup, Boutonnet, Davis and Hattori2011; Phillips et al. Reference Phillips, Searle and Parrish2013; Sen et al. Reference Sen, Mukherjee and Collins2014). These two-mica granites and leucogranites are considered to be of crustal origin.
2.c. Sample selections as per field relationships
We collected ten samples of granite and three samples of rhyolite based on observed field relationships between the SMC and the KB. The granite samples SM 8 and SM 9A/B were collected from the SMC and KB contact (Figs 1c, 3a). These samples may preserve the features of partial melting within the SMC in the form of dissolution, overgrowth or recrystallization of zircon that can lead to perturbation, and possibly the resetting of zircon, which can constrain the thermal events that operated in this region. The remaining seven granite samples (SM 10, SM 11, SM 13, SM 14, SM 16, SM 17 and SM 20) along with the three rhyolite samples (SM 21, SM 22 and SM 23) were collected from further north along the upper Shyok Valley region (Fig. 1c) where the effect of partial melting within the SMC becomes negligible. The sample locations with coordinates are given in online Supplementary Material Table S1.
3. Methodology
Whole-rock geochemical analysis was carried out on ten granite (SM 8, SM 9A, SM 9B, SM 10, SM 11, SM 13, SM 14, SM 16, SM 17, SM 20) and three rhyolite (SM 21, SM 22, SM 23) samples, the locations of which are shown in Figure 1c. The samples were crushed using a jaw crusher and then powdered in an agate mill to sizes <200 mesh. Whole-rock major and trace elements were determined using wavelength dispersive X-ray fluorescence (WD-XRF) (Bruker S8 Tiger) on pressed-powder pellets at the Wadia Institute of Himalayan Geology (WIHG), Dehradun, India.
The methodology adopted in this paper is similar to that described by Singhal et al. (Reference Singhal, Mukherjee, Saini, Dutt and Kumar2019). The accuracy (% RDS) and precision of the results for major oxides are within 5 % and 1.5 %, respectively (Saini, Reference Saini1998). The geochemical data processing and plotting were carried out using Geochemical Data Toolkit (Janoušek et al. Reference Janoušek, Farrow and Erban2006).
The rare earth element (REE) concentrations were measured using ICP-MS (Perkin-Elmer SCIEX ELAN DRC-e) at WIHG, Dehradun. We used an open-system digestion method to prepare the samples. A sample of 0.1 g of rock powder was mixed with (2:1) HF + HNO3 solution of 20 ml in Teflon™ crucibles for the complete digestion of the sample. The digested samples were then extracted using 20 % HNO3 and diluted to 100 ml volume. We used rock standards (JG-2 and MB-H) for calibration.
The zircon separates were obtained using conventional heavy liquid separation techniques. The zircon mounts were polished up to 0.25 micron using a diamond lapping compound. Backscattered electron (BSE) and cathodoluminescence (CL) images were taken using a scanning electron microscope (SEM-Zeiss EVO 40 EP) using Zeiss Everhart-Thornley SE and Chroma UV CL2 detectors. Zircon U–Pb ages were measured using an LA-MC-ICP-MS Neptune plus instrument (Thermofisher Scientific) coupled with an Analyte G2 193 nm ArF excimer laser ablation system (Teledyne) at WIHG, Dehradun, India. Zircon standard Harvard 91500 (TIMS reference age 1062.4 ± 0.4 Ma) (Wiedenbeck et al. Reference Wiedenbeck, Alle, Corfu, Griffin, Meier, Oberli, Quadt, Roddick and Spiegel1995) was used as a primary standard for correcting the instrumental mass bias and downhole fractionation. However, we used Plesovice (TIMS reference age 337.13 ± 0.37 Ma) (Sláma et al. Reference Sláma, Košler, Condon, Crowley, Gerdes, Hanchar, Horstwood, Morris, Nasdala, Norberg and Schaltegger2008) as a secondary standard for U–Pb geochronology. The complete methodology adopted in this paper is similar to that described by Mukherjee et al. (Reference Mukherjee, Singhal, Adlakha, Rai, Dutt, Kharya and Gupta2017). Off-line processing of the data obtained from the mass spectrometer was done using Iolite version 2.5 (Paton et al. Reference Paton, Hellstrom, Paul, Woodhead and Hergt2011). Concordia and histogram plotting was carried out using IsoplotR (Vermeesch, Reference Vermeesch2018). We used histograms to demonstrate and identify the peaks of the analysed zircon spots. We selected the highest peak to calculate the weighted mean age of the studied samples. We used IsoplotR (Vermeesch, Reference Vermeesch2018) for the calculation of weighted mean ages, which accounts for the analytical uncertainties in heteroscedastic datasets. IsoplotR provides three different calculated uncertainties with lower to upper bounds. We considered the upper uncertainty bound to exclude any error.
4. Petrography and geochemistry
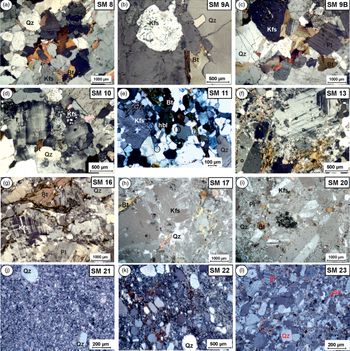
The studied undeformed granites (SM 8, SM 9A, SM 9B, SM 10, SM 11, SM 13, SM 14, SM 16, SM 17, SM 20) of the pluton from the KB are medium to coarse grained, equigranular to porphyritic in nature, and mainly consist of quartz (Qz), K-feldspar (Kfs), plagioclase (Pl) and biotite (Bt) as the major rock-forming minerals (mineral symbols after Whitney & Evans, Reference Whitney and Evans2010) (Fig. 4a–i). The granites SM 9A and SM 9B are porphyritic with phenocrysts of K-feldspar and plagioclase (Fig. 4b, c). Hornblende (Hbl) can be observed only in one sample, SM 11 (Fig. 4e), while in all other samples, biotite is the mafic phase (Fig. 4a–i). Extrusive rhyolites (SM 21, SM 22, SM 23) that rest on the granite pluton (Fig. 3f) exhibit a porphyritic texture in which euhedral phenocrysts of sanidine (Sa), plagioclase and quartz are embedded within a felsic groundmass mainly composed of fine crystals of quartz, orthoclase and plagioclase. Features such as flow structures are not apparent, but phenocrysts of quartz and K-feldspar are present in the quenched glassy groundmass (Fig. 4j–l).
Photomicrographs of the studied rock samples from the SMC and KB. (a–i) Granites showing medium- to coarse-grained porphyritic texture with phenocrysts of quartz (Qz), K-feldspar (Kfs), plagioclase (Pl) and biotite (Bt). (j–l) Porphyritic texture and exhibition of euhedral phenocrysts of sanidine (Sa), plagioclase and quartz. hbl – hornblende.

Table 1 presents the results of the whole-rock geochemical analysis. All granites exhibit a relatively wide range of SiO2 (66.92–73.85 wt %) and K2O (2.48–5.33 wt %) contents, belonging to the medium to high potassium calc-alkaline series (Fig. 5) (Peccerillo & Taylor, Reference Peccerillo and Taylor1976). The granites are largely peraluminous, except the metaluminous granite samples SM 8 and SM 11; the A/CNK (molar Al2O3/CaO + Na2O + K2O, i.e. alumina saturation index of Shand, Reference Shand1947) ratios range from 0.95 to 1.14. The rhyolites (SM 21, SM 22, SM 23) are strongly peraluminous (A/CNK = 1.42–1.81) (Fig. 6a). The nature of the differentiation series of silicic magma can be determined through (FeOt)/(FeOt + MgO) (Frost et al. Reference Frost, Barnes, Collins, Arculus, Ellis and Frost2001), while the modified alkali lime index (Peacock, Reference Peacock1931) of a silicic magmatic suite can be used to decipher the nature and source of the magma (Frost et al. Reference Frost, Barnes, Collins, Arculus, Ellis and Frost2001). The granites and rhyolites follow the calc-alkali series, being magnesian (Fig. 6b, c). On the A/CNK versus SiO2 plot (Chappell & White, Reference Chappell and White1974), the granites show I-type affinity, while the rhyolites lie in the S-type granite field (Fig. 6d). The granites and rhyolites do not show much compositional difference, plotting in the field of granite and granodiorite in terms of Na2O versus SiO2 (Middlemost, Reference Middlemost1994) (Fig. 7). The contents of TiO2, MgO, CaO, FeOt and Al2O3 show a decreasing trend with increasing SiO2 for both the granites and rhyolites (Fig. 8). On the Nb versus Y tectonic discrimination diagram (Pearce et al. Reference Pearce, Harris and Tindle1984), all the studied samples plot in the volcanic arc granite (VAG) plus syn-collisional granite (syn-COLG) fields (Fig. 9a), and on the Rb versus Y + Nb diagram they plot in the VAG field (Fig. 9b). The granites SM 8 and SM 9 most likely originated from metapelite, as evident from the observed low to moderate Mg no. (11.7–57.6), and high Na2O (3.63–4.62), TbN/YbN (3.0–9.1), Al2O3/(MgO + FeOt) (7.0–35.5) and K2O/Na2O (0.5–1.4), as typically suggested elsewhere for melts generated from metapelites (Altherr et al. Reference Altherr, Holl, Hegner, Langer and Kreuzer2000).
Major- (wt %) and trace-element (ppm) contents of the analysed samples from the Karakoram Batholith, eastern Karakoram, India

Fe2O3t – total iron; LOI – loss on ignition; A/CNK – molar Al2O3/CaO + Na2O + K2O; ∑REE – sum of the total REE; Eu* – √(SmN) × (GdN); BDL – below detection limit; REE normalization based on Taylor & McLennan (Reference Taylor and McLennan1985).
K2O versus SiO2 plot for the studied granites and rhyolites (fields are shown after Peccerillo & Taylor, Reference Peccerillo and Taylor1976).

Major element-based geochemical classification plots for granites and rhyolites. (a) Molar A/NK (Al2O3/Na2O + K2O) versus molar A/CNK (Al2O3/CaO + Na2O + K2O) plot (discrimination fields after Maniar & Piccoli, Reference Maniar and Piccoli1989). (b) Plot of Na2O + K2O–CaO against SiO2 showing the approximate ranges for the alkalic, alkali–calcic, calc-alkalic and calcic rock series (after Frost et al. Reference Frost, Barnes, Collins, Arculus, Ellis and Frost2001). (c) FeO/(FeOt + MgO) versus wt % SiO2 diagram showing the boundary between ferroan plutons and magnesian plutons (after Frost et al. Reference Frost, Barnes, Collins, Arculus, Ellis and Frost2001). (d) Molar A/CNK (Al2O3/CaO + Na2O + K2O) versus SiO2 plot (fields after Chappell & White, Reference Chappell and White1974).

Total alkali silica (TAS) plot (fields after Cox et al. Reference Cox, Bell and Pankhurst1979).

Harker variation plots as major oxides (wt %) versus SiO2 (wt %) for the granites and rhyolites.

Tectonic discrimination diagrams to identify the tectonic setting of the analysed samples. (a) Nb versus Y tectonic discrimination diagram (Pearce et al. Reference Pearce, Harris and Tindle1984), and (b) Rb versus Y + Nb tectonic discrimination diagram (Pearce et al. Reference Pearce, Harris and Tindle1984). VAG – volcanic arc granite; syn-COLG – syn-collisional granite; WPG – within-plate granite; ORG – ocean ridge granite.

The total sum of REEs for the granites varies from 50.43 to 299.47 ppm and for the rhyolites from 115.9 to 167.7 ppm. The rhyolites exhibit almost similar chondrite-normalized (Taylor & McLennan, Reference Taylor and McLennan1985) REE patterns to those observed for the granites, with moderate negative europium anomalies (EuN/Eu* =0.75–0.84) compared to the granites, which show a wide range of negative to positive europium anomalies (EuN/Eu* = 0.25–1.13) (Fig. 10a; Table 1). The light rare earth element (LREE) patterns are inclined, whereas the heavy rare earth elements (HREEs) exhibit almost flat patterns, suggesting moderate LREE to HREE fractionation (LaN/LuN = 11.29 to 177.1) for the studied granites and rhyolites. However, the LREE to HREE fractionation (LaN/LuN = 11.29 to 177.1) of the granites is slightly more than that observed for the rhyolites (LaN/LuN = 15.68–16.60).
(a) Chondrite-normalized (Taylor & McLennan, Reference Taylor and McLennan1985) rare earth element diagram plotted for the analysed samples. (b) Primitive mantle-normalized (Taylor & McLennan, Reference Taylor and McLennan1985) trace-element spider diagram plotted for the analysed samples.

The primitive mantle-normalized (Taylor & McLennan, Reference Taylor and McLennan1985) trace-element patterns of the granites and rhyolites show enriched large ion lithophile element (LILE) patterns relative to the high field strength elements (HFSE). The observed negative Nb, Sr, Ti and V anomalies for the granites suggest subduction-related calc-alkaline magmatism (Kelemen et al. Reference Kelemen, Shimizu and Dunn1993). The rhyolites also show negative Nb–Sr anomalies, but a slight enrichment in Ti, V and Ni contents compared to those observed for the granites (Fig. 10b).
5. Zircon U–Pb geochronology
We selected five granite samples (SM 8, SM 9, SM 16, SM 17, SM 20) and one rhyolite sample (SM 22) from the KB for zircon U–Pb geochronology to constrain the timing of magmatic events. Online Supplementary Material Table S2 presents the LA-MC-ICP-MS analysed zircon U–Pb geochronological database for the granites and rhyolite. The details are as follows.
5.a. SM 8 (granite)
The zircons from SM 8 are euhedral, showing oscillatory zoning patterns with bright cores (Fig. 11a). We analysed 25 zircon spots on 17 zircon grains. The Th/U ratio of 13 zircon cores and rims varies from 0.02 to 0.07, while ten analyses show a relatively high Th/U ratio of 0.17–0.57, and two zircon cores show a very high Th/U ratio of 27.2 and 30.5 (online Supplementary Material Table S2). Although low Th/U (<0.2) and high Th/U (>0.2) ratios have been suggested for zircons of metamorphic and magmatic origins, respectively (Rubatto & Gebauer, Reference Rubatto, Gebauer, Pagel, Barbin, Blanc and Ohnenstetter2000; Hoskin & Schaltegger, Reference Hoskin and Schaltegger2003), no clear distinction regarding the mode of origin of zircons can be made on the basis of Th/U ratio alone. However, the sharp contacts between the oscillatory zoned rims and cores with a high Th/U ratio (>0.2) observed for most of the zircon grains indicates a magmatic origin. The data for all the zircon spot analyses were plotted on a concordia diagram, on which the analyses from the rims suggest an age range of middle to late Miocene (18.2–10.22 Ma), while the ages from the cores vary from Palaeoproterozoic to Late Cretaceous (2028–80 Ma), suggesting their inheritance from the Karakoram basement (Fig. 12a). The seven most concordant analyses from the zircon rims yield a 206Pb–238U weighted mean age of 15.029 ± 0.01 Ma (MSWD = 1.34), which can be interpreted as the crystallization age of the zircons in the granite (Fig. 12b). Inherited zircon grains yield ages of 80, 787, 1170, 1830 and 2028 Ma, which indicate the involvement of heterogeneous sources in the genesis of the granite.
Cathodoluminescence images of representative zircons from the analysed samples. (a) SM 8; (b) SM 9A; (c) SM 16; (d) SM 17; (e) SM 20; (f) SM 22.

206Pb–238U ages and concordia diagrams for LA-MC-ICP-MS zircon data plots. (a) SM 8, all data analyses; (b) SM 8, most concordant ages showing crystallization age. (c) SM 9A, all data analyses; (d) SM 9A, most concordant ages showing crystallization age. (e) SM 16, all data analyses; (f) SM 16, most concordant ages showing crystallization age.

5.b. SM 9 (granite)
The zircons from SM 9 are mostly euhedral and oscillatory zoned with weakly zoned rims having some homogeneous domains. The cores are bright with sharp to transgressive contacts, but the rims show features of recrystallization (Fig. 11b). Thirty-one analyses on 19 zircon grains were carried out. The data for all analyses were plotted on a concordia diagram, on which all 12 analyses from the rims suggest an age of middle to late Miocene (14.96–11.62 Ma), except two analyses with Late Cretaceous and early Palaeogene ages (67 Ma and 57 Ma), while the other ten analyses from the cores vary from Mesoproterozoic to Late Cretaceous (1969–65 Ma) in age, suggesting inheritance from the Karakoram basement (Fig. 12c). The five most concordant analyses from the zircon rims yield a 206Pb–238U weighted mean age of 12.680 ± 0.26 Ma (MSWD = 2.62), which is interpreted as the zircon crystallization age in the granite (Fig. 12d). Inherited zircon ages from the cores cluster in the groups 57–70 Ma, 95.6–205 Ma, 418.8–696 Ma, 1382 Ma and 1969 Ma, which strongly points to the recycling of heterogeneous older sources in the genesis of the granite.
5.c. SM 16 (granite)
The zircons from sample SM 16 are subhedral to euhedral, showing oscillatory zoning developed over the bright cores (Fig. 11c). Thirty spots on 18 zircon grains were analysed. Twenty-three zircon analyses have high measured Th/U ratios (0.20–1.99), which indicate a magmatic origin (Rubatto & Gebauer, Reference Rubatto, Gebauer, Pagel, Barbin, Blanc and Ohnenstetter2000). Seven analyses from the zircon rims and cores have measured Th/U ratios of between 0.05 and 0.18, indicating a metamorphic or recrystallized origin for the zircon grains (online Supplementary Material Table S2). Data for all of the 30 analyses were plotted on a concordia diagram, on which 26 analyses suggest Early to Late Cretaceous ages (86.3–45.4 Ma), while three analyses from the inherited cores show Palaeozoic ages (379 Ma, 349 Ma and 579 Ma), with a single rim analysis showing an Eocene age (52.6 Ma) (Fig. 12e). The seven most concordant zircon analyses yield a 206Pb–238U weighted mean age of 99.38 ± 0.89 Ma (MSWD = 0.75), whereas six zircon analyses yield a 206Pb–238U weighted mean age of 105.62 ± 1.75 (MSWD = 2.94). These ages at least indicate two episodes of granite magmatism in Middle Cretaceous time (Fig. 12f). Inherited zircon core ages vary from 349 to 519 Ma, which probably indicates the involvement of juvenile and Gondwana components in the origin of the granite.
5.d. SM 17 (granite)
The zircons from SM 17 are mostly subhedral, having oscillatory zoned to weakly zoned rims (Fig. 11d). Thirty analyses on 20 grains were carried out. The Th/U ratio for all the analyses is >0.2 (0.22–0.90), indicating a magmatic origin for the zircons, except a single analysis from a rim (Th/U = 0.13). All the 30 analyses were plotted on a concordia diagram, on which 27 analyses suggest an age of Early to Late Cretaceous (130–86.2 Ma), while three inherited zircon cores show Palaeozoic to Neoproterozoic ages (405, 536 and 741 Ma) (Fig. 13a). The six most concordant analyses yield a 206Pb–238U weighted mean age of 104.52 ± 0.75 Ma (MSWD = 2.03), interpreted as the zircon crystallization age in the granite (Fig. 13b). Inherited ages from the zircon cores vary from 405.3 to 741 Ma, which suggests their source is Gondwanaland.
206Pb–238U ages and concordia diagrams for LA-MC-ICP-MS zircon data plots. (a) SM 17, all data analyses; (b) SM 17, most concordant ages showing crystallization age. (c) SM 20, all data analyses; (d) SM 20, most concordant ages showing crystallization age. (e) SM 22, all data analyses; (f) SM 22, most concordant ages showing crystallization age.

5.e. SM 20 (granite)
The zircons from SM 20 are euhedral and oscillatory zoned. Inherited zircon cores can be seen with sharp to somewhat diffusive contacts (Fig. 11e). Thirty analyses on 18 zircon grains were carried out. Th/U ratios for most of the analyses are higher than 0.2 (0.20–1.0), indicating a magmatic origin, while some zircon cores and rims have measured Th/U ratios of between 0.09 and 0.19 (online Supplementary Material Table S2). All the 30 analyses were plotted on a concordia diagram, on which 18 analyses suggest an age of Early to Late Cretaceous (142–92.1 Ma), while the nine inherited zircon cores suggest Palaeoproterozoic to Palaeozoic ages (1601–328 Ma) (Fig. 13c). The five most concordant zircon analyses yield a 206Pb–238U weighted mean age of 108.03 ± 0.61 Ma (MSWD = 2.52), interpreted as the zircon crystallization age in the granite (Fig. 13d). Inherited zircon ages from this sample vary in the age groups 328–702 Ma and 1193–1601 Ma, which suggests the involvement of Meso- to Neoproterozoic and some younger crustal components in the genesis of this granite.
5.f. SM 22 (rhyolite)
The zircon grains from SM 22 are mostly homogeneous with some faint oscillatory zoning patterns (Fig. 11f). Thirty analyses on 24 zircon grains were carried out, mostly on the cores because the rims were too thin to perform the analysis. Th/U ratios for most of the zircon analyses are >0.2 (0.20–2.1), indicating a magmatic origin, while some analyses have Th/U ratios of between 0.11 and 0.19 (online Supplementary Material Table S2). All the 30 analyses were plotted on a concordia diagram, on which 17 analyses suggest an age of Early to Late Cretaceous (~136.6–65.8 Ma), three analyses an age of Early to Middle Jurassic (192–175 Ma) and 11 analyses a Permian age (782–284 Ma) (Fig. 13e). The ages from the rhyolite can be divided into three groups: Coniacian to Santonian within the Late Cretaceous (89.7–84.7 Ma with Th/U = 0.73–2.1), Early to Late Cretaceous (136.6–98.4 Ma with Th/U = 0.405–0.893) and Neoproterozoic to Middle Jurassic (782–175 Ma with Th/U = 0.11–1.3).
The four most concordant zircon analyses yield a 206Pb–238U weighted mean age of 103.52 ± 2.17 (MSWD = 1.01), while a cluster of another four zircon analyses (Th/U = 0.73–2.1) yield a 206Pb–238U weighted mean age of 84.79 ± 1.87 (MSWD = 3.64) (Fig. 13f). These two age peaks corresponding to the Late Cretaceous are observed on the Kernel density estimate (KDE) plot (Fig. 13f). Inherited zircon ages from this sample vary in the age groups 175–284 Ma and 343–782 Ma, which indicates the contribution of Permian to Middle Jurassic and Neoproterozoic to Late Palaeozoic components in the evolution of the rhyolite.
6. Discussion
6.a. Process diagnosis and likely tectonic settings of the granites and Murgo Volcanics
The studied granites and rhyolites from the Shyok Valley region are undeformed and do not show evidence of mylonitization and migmatization, as commonly observed near the KFZ. The granites are metaluminous to weakly peraluminous (S-type; molar A/CNK = 0.95–1.14), which might be due to evolution through fractional crystallization of calc-alkaline, metaluminous (I-type) parental magma giving rise to a mildly peraluminous residual melt. However, the rhyolites are strongly peraluminous (S-type) in nature (molar A/CNK = 1.42–1.81), which could have been formed by AFC. TiO2, MgO, CaO, FeOt and Al2O3 behave as compatible elements in both granites and rhyolites, which equivocally dictates that their evolution is dominantly controlled by fractionation of biotite, plagioclase, K-feldspar and sphene (Fig. 8) from calc-alkaline, magnesian-type felsic parental melts (Fig. 6).
Slab dehydration during subduction leads to the release of fluids that carry mobile elements into the overlying mantle wedge, which is a common feature of arc environments (Keppler, Reference Keppler1996; Xiao et al. Reference Xiao, Niu, Wang, Lee and Iizuka2016). These fluids from the subduction zone interact with the fluids of the mantle wedge, and form hydrous minerals (e.g. hornblende, biotite), which are present in the studied granites (Fig. 4) (e.g. Murphy, Reference Murphy2006). Enrichment of the LILEs in the granites suggests that the mobile elements (e.g. K, Rb, Ba, Sr, U, Th) extracted from the subducted slab through supercritical fluid have enriched the overlying mantle wedge, and this is recorded in the contents of trace elements in the samples (Fig. 10b; Table 1) (e.g. Spandler et al. Reference Spandler, Hermann, Arculus and Mavrogenes2003; Murphy, Reference Murphy2006). The enrichment of LREEs relative to HREEs with moderately negative to mildly positive Eu anomalies (EuN/Eu* = 0.25–1.13) in the granites (Fig. 10a; Table 1) would have been controlled mainly by plagioclase fractionation and little plagioclase accumulation, respectively, during the evolution of the parental granite magma. The presence of negative Eu anomalies (EuN/Eu* = 0.75–0.84) in the rhyolites suggests plagioclase fractionation during their evolution. The total sum of REEs for the granites (172.2 ppm; n = 10; SiO2 = 66.92–73.85 wt %) and rhyolites (137.6 ppm; n = 3; SiO2 = 65.88–71.49 wt %) and the average LREE/HREE fractionation (LaN/LuN = 44.10 for the granites and LaN/LuN = 16.28 for the rhyolites) points to the relatively more evolved nature of the granites compared to the rhyolites (Table 1). Both the granites and rhyolites exhibit LILE enrichment (e.g. Th, K, Ba) and HFSE depletion (e.g. Nb, Ti, Zr) with negative Nb, Ti and Zr and positive Th anomalies with respect to primitive mantle values (Fig. 10b), which are mostly sourced from the subducting lithosphere, which induced melting of the mantle wedge. Tectonic discrimination via major oxides (Maniar & Piccoli, Reference Maniar and Piccoli1989) also shows that the granites and rhyolites belong to continental arc granitoids (CAG) of the orogenic field. The granites (SM 10–SM 20) and the rhyolites bear high Mg nos. (100Mg/Mg + Fe) ranging from 27.3 to 69.4 and from 51.4 to 62.6, respectively. We observed low Na2O contents for the granites (2.84–4.26 wt %) and rhyolites (2.19–2.90 wt %) and high abundances of incompatible elements, and (Tb/Yb)N = 1.29–3.3 and 1.73–1.87, respectively, for the granites and rhyolites. These characteristics suggest an origin from enriched lithospheric mantle sources (Altherr et al. Reference Altherr, Holl, Hegner, Langer and Kreuzer2000). The rhyolites are calc-alkaline with low HFSEs and high Zr/Y (10.4–15.6) and LaN/YbN (16.7–17.3), which corresponds to the FI group of rhyolites typically formed in subduction settings (Lesher et al. Reference Lesher, Goodwin, Campbell and Gorton1986).
In the eastern Karakoram, the exposed felsic magmatic rocks in the Nubra–Shyok Valley are represented by calc-alkaline metaluminous (I-type) Tirit granites (Rao & Rai, Reference Rao and Rai2009; Kumar et al. Reference Kumar, Bora, Sharma, Yi and Kim2017), while the Panamik granites exposed in the Khalsar–Panamik (Fig. 1c) area are weakly peraluminous (Rao & Rai, Reference Rao and Rai2009), similar to those noted for the studied granites from the Shyok–Murgo section (Fig. 1c). In contrast, the rhyolites exhibit elevated molar A/CNK (with enriched LILEs and LREEs), which may suggest derivation from pelitic sources present in the accretionary wedge or the crustal basement (e.g. Thorpe, Reference Thorpe1982). The observed moderate to high K2O (2.48–5.33 wt %) and K2O > Na2O with enrichment of Rb content (95–240 ppm) for the granites; and K2O (2.83–3.37 wt %) and K2O > Na2O with high Rb content (94–118 ppm) for the rhyolites also advocates for varying amounts of crustal contribution in their genesis. The Th/Nb versus Zr plot (Fig. 14) for the granites shows a continuously increasing Zr trend with slight enrichment in Th/Nb that suggests fractional crystallization as the dominant process in the evolution of the granites (e.g. Nicolae & Saccani, Reference Nicolae and Saccani2003). On the other hand, the rhyolites demonstrate an increasing trend of Th/Nb with Zr that suggests the dominant role of AFC during magmatic differentiation (Fig. 14).
Th/Nb versus Zr plot for the studied samples. Trends reflect increasing fractional crystallization (FC), assimilation fractional crystallization (AFC) and bulk assimilation (BA) (after Nicolae & Saccani, Reference Nicolae and Saccani2003).

On the Rb versus Y + Nb plot (Fig. 9b), the granites and rhyolites lie within an ellipse approaching a triple point formed by the intersection of the boundary lines separating the VAG, syn-COLG and within-plate granite (WPG) fields, which is the region of post-collisional granites (Pearce, Reference Pearce1996). The observed enrichment of Rb and K2O, and high A/CNK ratios in the granites and rhyolites can be most likely achieved through AFC. However, the major oxide contents demonstrate the continental arc nature of the rhyolites (Fig. 6b).
6.b. Quantitative modelling of fractional crystallization and assimilation
During fractional crystallization, the magma simultaneously assimilates the surrounding rocks of the crust because of heat transfer from the hot magma to the more cold surroundings (Kuritani et al. Reference Kuritani, Kitagawa and Nakamura2005). The deep lower crustal rocks in the Karakoram terrane are mainly igneous and high-grade metamorphic rocks (Searle, Reference Searle and Shubert2015). In the study area, the main bedrock is highly evolved Late Cretaceous granites that contain older crustal components such as Palaeozoic and Proterozoic zircons, as recorded in the present work and elsewhere (Kumar et al. Reference Kumar, Bora, Sharma, Yi and Kim2017 and references therein). Geochemically, these granites are slightly peraluminous to metaluminous, and enriched in the LILEs (e.g. Sr, Rb, Ba). The rhyolites are strongly peraluminous and exhibit xenocrystic magmatic zircons derived from the KB pluton, which can be explained based on the trace-element (U, Th) composition of the zircons. The zircons from the rhyolite sample SM 22 have Late Cretaceous ages (84.7 to 89.7 Ma) with high Th/U ratios (0.73–2.1), while the other xenocrystic zircons of Early to Late Cretaceous and Neoproterozoic to Middle Jurassic ages have Th/U ratios of between 0.40–0.9 and 0.11–1.3, which correlates well with the observed Th/U ratios (0.06–1.1) of the zircons from the granites (SM 16–SM 20). Hence, we prefer these granites as the potential candidates for contaminants during synchronous fractional crystallization. We suggest that the rhyolite magma was formed by fractional crystallization of a more primitive magma at depth accompanied by assimilation of the KB.
An attempt was made to quantitatively constrain the likely processes of assimilation of the pre-existing granites by the rhyolites accompanied by fractional crystallization using trace elements, including the REEs of the rhyolite and assimilant granite, and the Microsoft Excel-based Petromodeler program containing partitioning coefficients (Kds) of the Geochemical Earth Reference Model (GERM) database (Ersoy, Reference Ersoy2013). To quantitatively model the fractional crystallization forming the cogenetic granites, we assumed the least fractionated sample SM 13 as the starting parental magma composition (Cof). An increasing degree of F, i.e. the fraction of remaining melt, was used to test the fractionation of this parental magma. The REE content of the highly evolved SM 10 granite as a residual melt with SiO2 = 72.29 wt % can be achieved at F = 37 %, which at least constrains the evolved nature of the granite melt through 63 % fractional differentiation (Fig. 15).
Plots demonstrating the quantitative models of fractional crystallization (FC) using the Petromodeler program (after Ersoy, Reference Ersoy2013).

For modelling the AFC, we considered the rhyolite sample SM 23 to be the least contaminated or uncontaminated sample, because of its extremely low content of incompatible elements (e.g. Sr, U, La,), and granite sample SM 14 of the KB as the assimilant (Fig. 16a, b). The average of the pre-collision granites (SM 10 and SM 20) was also used as a possible contaminant (Fig. 16c, d). The obtained results dictate that rhyolite SM 21 can be achieved by assimilation of ~34.5 % (r = 0.13; the ratio of assimilation rate and fractional crystallization rate) of granite SM 14 by rhyolite SM 23 (Fig. 16a). Rhyolite SM 22 can be produced by ~13.8 % (r = 0.40) assimilation of rhyolite SM 23 with granite SM 14 (Fig. 16b). The rhyolites SM 21 and SM 22 can also be achieved by ~34.5 % (r = 0.10) and ~13.8 % (r = 0.15) assimilation of the average pre-collisional granites as contaminants (Fig. 16c, d). The likely higher degree of assimilation might have occurred owing to a second boiling prevailing in the chamber (Sisson & Bacon, Reference Sisson and Bacon1999). Further, the latent heat of crystallization of the anhydrous groundmass minerals may induce the effect of a second boiling (Kumar, Reference Kumar, Kumar and Singh2014). The obtained quantitative models at least constrain the evolution of the rhyolites through AFC. The future work on whole-rock Sr–Nd isotopes of the granites and rhyolites can strengthen our proposed model of AFC.
Plots demonstrating the quantitative models of assimilation accompanied by fractional crystallization (AFC). (a) Assimilation of rhyolite SM 23 and granite SM 14 producing rhyolite sample SM 21; (b) assimilation of rhyolite SM 23 and granite SM 14 producing rhyolite sample SM 22; (c) assimilation of rhyolite SM 23 and the average of KB granites producing rhyolite sample SM 21; (d) assimilation of rhyolite SM 23 and the average of KB granites producing rhyolite sample SM 22 using the Petromodeler program (after Ersoy, Reference Ersoy2013).

6.c. Episodic magmatism in the evolution of the Karakoram Batholith
Several earlier attempts have been made to understand the contribution of magmatism in the evolution of the KB. Weinberg et al. (Reference Weinberg, Dunlap, Whitehouse, Asif Khan, Treloar, Searle and Qasim Jan2000) reported the U–Pb zircon crystallization age of ~68 Ma as the emplacement age for the Tirit granites exposed along the Nubra–Shyok Valley and correlated this part with an equivalent magmatic episode of the Ladakh Batholith. Upadhyay (Reference Upadhyay2008) reported a more or less similar emplacement age of ~71 Ma for the Tirit granites. However, Kumar et al. (Reference Kumar, Bora, Sharma, Yi and Kim2017) reported ~109–105 Ma ages for the calc-alkaline Tirit granites and opined that subduction along the SSZ started much earlier in Early Cretaceous time. Our results are similar to the observations of Ravikant et al. (Reference Ravikant, Wu and Ji2009), who reported ~103–100 Ma ages for zircon crystallization in enclaves from the Skyangpoche region and concluded that the subduction along the SSZ might have initiated at ~103 Ma, i.e. much earlier than along the ITSZ. However, studies from the western Karakoram by Heuberger et al. (Reference Heuberger, Schaltegger, Burg, Villa, Frank, Dawood, Hussain and Zanchi2007) suggested that the subduction started still earlier again at ~121 Ma, as evident from the U–Pb zircon crystallization age of the Tirich Mir pluton. In the present study, zircon dating from three granite samples (SM 16, SM 17 and SM 20) points to episodic magmatism spanning ~108 to 100 Ma (Figs 12e, f, 13a–d).
Zircon U–Pb geochronological data from previous and present studies on the volcano-plutonic magmatic rocks of the KLA and Karakoram Block have been compiled and processed in order to plot an age probability diagram (Fig. 17). Two main pre-collisional magmatic episodes in the Karakoram Block during Early Cretaceous time (125–99 Ma) and Late Cretaceous to Palaeogene times (85–50 Ma) can be recognized (Fig. 17a). However, there is a significant magmatic gap observed between ~99 Ma and ~85 Ma. It appears that the KLA has grown continuously through magmatism spanning from ~85 Ma to 40 Ma, with sparse magmatic pulses at ~102–91 Ma (Fig. 17b) to the south of the SSZ. Most importantly, the quiescent period of magmatism in the Karakoram is apparent during ~99–85 Ma, and the lower age limit of this quiescent period matches well with the timing of initiation of the most pronounced magmatic episode at ~85 Ma in the Kohistan–Ladakh block (Fig. 17b).
Zircon 206Pb–238U age probability diagram for rocks from (a) the Karakoram Batholith; and (b) the Kohistan-Ladakh Arc. Data from present study and: a – Desio et al. (Reference Desio, Tongiorgl and Ferrara1964); b – Honegger et al. (Reference Honegger, Dietrich, Frank, Gansser, Thöni and Trommsdorff1982); c – Parrish & Tirrul (Reference Parrish and Tirrul1989); d – Schärer et al. (Reference Schärer, Xu and Allègre1984); e – Khan et al. (Reference Khan, Asif Khan, Qasim Jan and Naseem1996); f – Krol et al. (Reference Krol, Zeitler and Copeland1996); g – Searle et al. (Reference Searle, Weinberg, Dunlap, Holdsworth, Strachan and Dewey1998); h – Weinberg & Dunlap (Reference Weinberg and Dunlap2000); i – Weinberg et al. (Reference Weinberg, Dunlap, Whitehouse, Asif Khan, Treloar, Searle and Qasim Jan2000); j – Fraser et al. (Reference Fraser, Searle, Parrish and Noble2001); k – Hildebrand et al. (Reference Hildebrand, Searle, Khan, Van Heijst, Asif Khan, Treloar, Searle and Qasim Jan2000); l – Dunlap & Wysoczanski (Reference Dunlap and Wysoczanski2002); m – Schaltegger et al. (Reference Schaltegger, Zeilinger, Frank and Burg2002); n – Phillips et al. (Reference Phillips, Parrish and Searle2004); o – Heuberger et al. (Reference Heuberger, Schaltegger, Burg, Villa, Frank, Dawood, Hussain and Zanchi2007); p – Singh et al. (Reference Singh, Kumar, Barley and Jain2007); q – Jain & Singh (Reference Jain and Singh2008); r – Upadhyay (Reference Upadhyay2008); s – Jagoutz et al. (Reference Jagoutz, Burg, Hussain, Dawood, Pettke, Iizuka and Maruyama2009); t – Ravikant et al. (Reference Ravikant, Wu and Ji2009); u – Boutonnet et al. (Reference Boutonnet, Leloup, Arnaud, Paquette, Davis and Hattori2012); v – Phillips et al. (Reference Phillips, Searle and Parrish2013); w – Borneman et al. (Reference Borneman, Hodges, Soest, Bohon, Wartho, Cronk and Ahmad2015); x – van Buer et al. (Reference van Buer, Jagoutz, Upadhyay and Guillong2015); y – Kumar et al. (Reference Kumar, Bora, Sharma, Yi and Kim2017); z – Sen et al. (Reference Sen, Adlakha, Singhal and Chaudhury2018). India–Asia collision data from: a – Searle et al. (Reference Searle, Windley, Coward, Cooper, Rex, Rex, Tingdong, Xuchang, Jan, Thakur and Kumar1987); b – Klootwijk et al. (Reference Klootwijk, Gee, Peirce, Smith and McFadden1992); c – Rowley (Reference Rowley1996); d – Najman et al. (Reference Najman, Appel, Boudagher-Fadel, Bown, Carter, Garzanti, Godin, Han, Liebke, Oliver and Parrish2010); e – Bouilhol et al. (Reference Bouilhol, Jagoutz, Hanchar and Dudas2013); f – Hu et al. (Reference Hu, Garzanti, Wang, Huang, An and Webb2016); g – Sen et al. (Reference Sen, Adlakha, Singhal and Chaudhury2018). SSZ closure data from: a – Petterson & Windley (Reference Petterson and Windley1985); b – Treloar et al. (Reference Treloar, Petterson, Jan and Sullivan1996); c – Rolland et al. (Reference Rolland, Pêcher and Picard2000); d – Heuberger et al. (Reference Heuberger, Schaltegger, Burg, Villa, Frank, Dawood, Hussain and Zanchi2007); e – Ravikant et al. (Reference Ravikant, Wu and Ji2009); f – Borneman et al. (Reference Borneman, Hodges, Soest, Bohon, Wartho, Cronk and Ahmad2015); g – Kumar et al. (Reference Kumar, Bora, Sharma, Yi and Kim2017); h – Searle & Hacker (Reference Searle, Hacker, Treloar and Searle2018).

The timing of suturing along the SSZ and collision of the KLA and Karakoram terrane has been suggested as ~110–75 Ma (Petterson & Windley, Reference Petterson and Windley1985; Treloar et al. Reference Treloar, Petterson, Jan and Sullivan1996; Rolland et al. Reference Rolland, Pêcher and Picard2000; Heuberger et al. Reference Heuberger, Schaltegger, Burg, Villa, Frank, Dawood, Hussain and Zanchi2007; Ravikant et al. Reference Ravikant, Wu and Ji2009; Borneman et al. Reference Borneman, Hodges, Soest, Bohon, Wartho, Cronk and Ahmad2015; Kumar et al. Reference Kumar, Bora, Sharma, Yi and Kim2017) based on several lines of chronological evidence. These include: (1) ~75 Ma Jutal dykes (Treloar et al. Reference Treloar, Rex, Coward, Petterson, Windley, Lun and Jan1989) that cross-cut the ~102 Ma Matum das Karakoram pluton and ~113–100 Ma Chalt Volcanics (Petterson & Windley, Reference Petterson and Windley1992); (2) an ~85 Ma aplite dyke from the Nubra Valley that cross-cuts the unconformity between the Shyok Volcanics and the Saltoro molasse in the SSZ; (3) ~86–84 Ma granites (Borneman et al. Reference Borneman, Hodges, Soest, Bohon, Wartho, Cronk and Ahmad2015) and ~109–104 Ma granites (Kumar et al. Reference Kumar, Bora, Sharma, Yi and Kim2017) that intrude the Shyok Volcanics; (4) a detrital zircon U–Pb age of 92.43 ± 0.24 Ma from the Saltoro molasse that contains zircons from both the Kohistan–Ladakh and Karakoram blocks (Borneman et al. Reference Borneman, Hodges, Soest, Bohon, Wartho, Cronk and Ahmad2015).
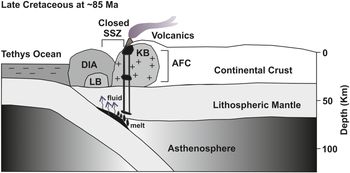
Extrusive Murgo rhyolite (SM 22) can be seen within the KB and provides a zircon U–Pb age of 84.86 ± 1.87 Ma (Th/U = 0.4–0.8), with some zircon inheritance from Neoproterozoic to Early Cretaceous (782–103 Ma) components (Fig. 13e, f). Interestingly, this sample records the Late Cretaceous event of ~85 Ma (Th/U = 0.7–2.1) (Fig. 13e, f) that is not present in the granites of the KB. We interpret the Late Cretaceous (~85 Ma) age as the eruptive age of the rhyolites, while the observed Early Cretaceous, Neoproterozoic and Late Palaeozoic inherited zircons are xenocrysts most likely entrapped into the melt during the partial assimilation of thickened Karakoram crust formed as a result of the collision of the KLA and Karakoram Block. This proposed model gives an insight into the AFC processes responsible for the evolution of the MV, which possibly originated owing to the partial melting of the mantle wedge, and subsequently experienced AFC at the active continental margin of the Karakoram during the ascent of the magma (Fig. 18).
Configuration of the Shyok suture closure (SSZ) and subsequent collision of the Dras Island Arc (DIA) and Karakoram terrane showing the generation of the Murgo rhyolites at the active continental margin of the Karakoram at ~85 Ma (modified after Jain, Reference Jain2014; Manikyamba et al. Reference Manikyamba, Saha, Santosh, Ganguly, Singh, Rao and Lingadevaru2014). KB – Karakoram Batholith; LB – Ladakh Batholith.

Based on the above discussion, we suggest that, in the Karakoram terrane, the Albian (~110–100 Ma) was the time period when the eastern and western regions of the KB began evolving owing to the subduction of Tethys oceanic lithosphere along the SSZ. The Karakoram Block then collided with the KLA (Dras island arc) in Late Cretaceous time, before ~85 Ma (Fig. 17). Afterwards, the KLA and Karakoram Block evolved as a single block following the closure of the SSZ in Santonian time, most clearly demonstrated through the observed southward migration of calc-alkaline subduction-related magmatism (Fig. 17b).
Also, the two undeformed granite samples (SM 8 and SM 9A) provide evidence of post-India–Asia collisional magmatic events at ~12 and 15 Ma. Two primary mechanisms are well known for the generation of post-collisional granites in this region. First, the melting of the pelitic source in the upper crust during Miocene time, which is arguably explained by crustal thickening due to the collision of the Indian and Asian plates during Early Eocene time that resulted in this stage of magmatic rocks (Searle et al. Reference Searle, Cooper, Rex and Colchen1988; Searle, Reference Searle1991; Fraser et al. Reference Fraser, Searle, Parrish and Noble2001; Brookfield et al. Reference Brookfield, Chung and Shellnutt2017), or second, due to shearing along the lithospheric-scale KF zone (Murphy et al. Reference Murphy, Yin, Kapp, Harrison, Lin and Jinghui2000; Weinberg & Dunlap, Reference Weinberg and Dunlap2000; Lacassin et al. Reference Lacassin, Valli, Arnaud, Leloup, Paquette, Haibing, Tapponnier, Chevalier, Guillot, Maheo and Zhiqin2004; Valli et al. Reference Valli, Leloup, Paquette, Arnaud, Li, Tapponnier, Lacassin, Guillot, Liu, Deloule, Xu and Mahéo2008; Leloup et al. Reference Leloup, Boutonnet, Davis and Hattori2011; Boutonnet et al. Reference Boutonnet, Leloup, Arnaud, Paquette, Davis and Hattori2012; Horton & Leech, Reference Horton and Leech2013; Sen et al. Reference Sen, Mukherjee and Collins2014). In the present case, no deformation related to the KF is seen, and these granites are undeformed (Fig. 3c, d) and lie near to the contact of the SMC and KB. Therefore, we infer the two most plausible models for the generation of post-collisional granite melts. First, these were formed as a result of dehydration melting of a metapelitic source due to high thermal gradients associated with crustal thickening, which served as a significant heat source required for crustal melting (e.g. Parrish & Tirrul, Reference Parrish and Tirrul1989; Schärer et al. Reference Schärer, Copeland, Harrison and Searle1990; Searle et al. Reference Searle, Parrish, Thow, Noble, Phillips and Waters2010). Second, these granites represent accumulated melts and were possibly migrated from the pool of magmas formed in batches at depth as a result of shear heating during deformation along the KF.
7. Conclusions
Field, petrographic, geochemical and zircon U–Pb geochronological data from the granites and rhyolites of an unexplored domain of the Karakoram Block exposed along the Shyok Valley have been presented and interpreted, and combined with the previously published zircon U–Pb age data for the magmatic rocks of the Karakoram Block. The main magmatic episode in the Karakoram Block took place during ~110–100 Ma in the western as well as the eastern Karakoram. This study provides a new model for the closure of the SSZ based on the emplacement of calc-alkaline rhyolite that has dominant continental signatures, which most likely resulted from synchronous AFC within the thickened continental margin during the ascent of magma from the mantle wedge. Our results suggest that the closure of the SSZ took place before ~85 Ma. The KLA and the Karakoram Block evolved as a single block after the closure of the SSZ, i.e. after the Late Cretaceous period. After that, the magmatic pulse shifted southwards towards the Ladakh Batholith region, with sparse magmatic events in the Karakoram Block.
Acknowledgements
VA has received funds from the Science and Engineering Research Board grant (EMR/2014/000555) to carry out this work. Authors thank the director, Wadia Institute of Himalayan Geology, Dehradun, for generous support during present work. Manoranjan Mohanty and Rajwant, DST and SERB, New Delhi thanked for their continuous encouragement. N. K. Juyal thanked for their help during CL imaging, and Chandra Shekhar helped during ICP-MS and XRF analyses. We thank C P. Dorjey, Skalzang Namgyal and Thinless Gyachho for field assistance. We highly acknowledge the Indo-Tibetan Border Police (ITBP) for help and support during fieldwork in the border area of Ladakh Himalaya. We thank two anonymous reviewers and the handling editor Kathryn Goodenough for their constructive and generous scientific comments on the earlier versions of the manuscript that improved the paper substantially.
Supplementary material
To view supplementary material for this article, please visit https://doi.org/10.1017/S0016756819001547