

Among politicians, the public, the media, and social scientists, the Supreme Court holding in Citizens United v. F.E.C. (2010) launched a renewed interest in the role of corporations in American politics. Many have feared that an influx of corporate money poses a significant threat to the health of American democracy, and Americans fear the perceived power of corporations and their lobbyists.Footnote 1 The potential for any shift, which would lead to greater influence for corporate interests, could have a significant impact on inequality as a growing concern in public discourse that further heightens the awareness of corporate interests and the implications for American democracy.Footnote 2 However, with a presidential election and two midterm elections having passed, the widely anticipated effect has yet to be realized.Footnote 3 At the same time, observers have noted a significant increase over the previous decade in lobbying expenditures among corporations.Footnote 4 What accounts for this increase? And conversely, under what conditions might we observe a similar stark increase in campaign spending among corporations newly freed from many of the constraints of previous campaign finance laws? This paper proposes a theory of corporate political engagement that is conditional on the political decisions of the firms that a company is connected to through trade association membership. While I do not make causal claims, this study finds that trade association ties are positively associated with similar political behavior by connected firms.
This study argues that to understand corporate political activity it is important to comprehend the role of corporate networks within which all modern firms are now, to various degrees, embedded. In this study, I explore the relationship between firms that are developed and maintained through the trade association network, which this paper introduces for the first time.
Scholars have long puzzled over why firms engage in corporate political activity. The less than certain effectiveness of campaign contributions in influencing electoral outcomes or of lobbying in influencing policy changes raises doubts regarding the sensibility of such expendituresFootnote 5 or lobbying.Footnote 6 The proffered answers vary, but most often center on firm level factors. Others argue that campaign giving is a consumptive good, and that giving among firms is actually undervalued.Footnote 7 When they do explore social influences, scholars tend to center on the role of interlocking directorates.Footnote 8 However, more recently it has been noted that interlocking directorates have declined,Footnote 9 and with this decline has come a decrease in cooperation among firms and elites.Footnote 10 This paper argues that to understand corporate political behavior, scholars should take into account the network of relationships in which this activity takes places. The trade association network, and not the board interlock, should be placed at the center of the effort to understand corporate political activity.
We may begin by asking what leads to the increasing involvement of corporations in politics, and perhaps even more fundamentally, what leads corporations to engage in politics? Evidence suggests that firm size, revenue, and industry are all important for determining corporate lobbying expenditures and campaign donations. These individual level factors are undoubtedly important, but mounting evidence from political science, sociology, and other fields has demonstrated that decisions are not made in a vacuum, and that social networks which link individuals, groups, and even nations play a role in shaping behavior. Social networks can affect whether an individual votes,Footnote 11 which candidates for Congress Political Action Committees (PACs) support,Footnote 12 collaboration in the U.S. Senate,Footnote 13 or even how network ties lead to alliances between nations.Footnote 14 More importantly for scholars of business and politics, some have applied these techniques to the study of business. This literature on social networks is often overlooked in studying corporate political activity. Scholars have noted that social network analysis and the study of corporate political activity have often been disparate fieldsFootnote 15 , and the potential to unite the two may yield significant dividends in the understanding of political economy. Despite significant recent research in political science on how social networks influence political behavior, there is a dearth of literature examining the ways in which networks impact corporate political behavior. Interlocking directorates are perhaps the best-cited example of social networks in corporate political activity (CPA). The most prominent study of interlocking directorates comes from MizruchiFootnote 16 , but results are mixed to support this theory (first-degree ties appear not to matter, and only second and third degree ties exert marginal influence). This lack of direct influence seems puzzling.
Recent work by Scott suggests that lobbying may be conditional upon the choices made by others in the policy environment.Footnote 17 We know that legislators leverage social ties and work over time to build coalitions to achieve legislative success.Footnote 18 I argue that businesses, like legislators, build and utilize network ties in helping to decide when and to what degree to engage in political activity. This study takes the position that corporate political decisions are conditional and dependent in part on the decisions of others firms they are tied to through the trade association network.
Lobbying, campaign donations, and politics in general, can all be, and very often are, social activities. The decision to engage in politics, and the degree of involvement to seek, are not choices that are undertaken in a vacuum, but are based on decisions made by human actors that are keenly aware and cognizant of the actions of others involved in the process. This includes not only the actions of members of the Congress and the Executive Branch, but also those around them. Interest groups, lobbyists, and business entities take notice of how those around them act in regards to politics. Scholars have found that weak ties can influence lobbyist access to elected officials.Footnote 19 Indeed, Baumgartner et al. note that “people inside and outside government are constantly monitoring their peers.”Footnote 20 Lobbyists are more likely to share information with those who have similar policy concerns.Footnote 21 Baumgartner and Leech state, “the social nature of lobbying with its sensitivity to context, can therefore be characterized by mimicry, cue-taking, and bandwagon effects.”Footnote 22 Others build upon this, saying “processes like bandwagon and influence can only occur in a social environment. That is, these effects can only occur if people know each other and can communicate with each other.”Footnote 23
I argue that is in fact the case, and demonstrate empirically that firms engage in similar behavior in their decisions regarding which issues they should retain lobbyists to address and which campaigns merit making donations to. With regard to the prior observation that decisions regarding political engagement are not made in vacuums, firms have a mechanism for interacting with one another, trade associations. These trade associations, through meetings, conferences, and shared interaction, allow for the creation of social ties and perhaps even social capital among those involved in corporate government affairs. Associations also actively recruit and encourage participation by corporate entities in political and regulatory affairs. While some have examined how lobbying is a social activity where lobbyists pay attention and gain information from one another (e.g., Scott), to my knowledge no studies have taken on a wide cross-section of firms and political issues in an effort to demonstrate how decisions are made vis a vis what to lobby and when to make campaign contributions. Some have examined how lobbying is a social activity where lobbyists pay attention and gain information from one another (e.g., ScottFootnote 24 ).
Trade associations and corporate political activity
Some research has suggested that trade association membership is a factor in determining lobbying activity in a comparative context. Research regarding trade associations has either taken the association as the unit of analysis, or scholars have looked at the decision to lobby alone or through the association.Footnote 25 These studies do not examine the association as a source of influence or as a conduit for collaboration among members. Indeed, the majority of lobbying by firms is done independently.Footnote 26 Trade associations may help to bring about some collective action, but they also face competitive pressures that may limit similarity of behavior.Footnote 27 Others examine the incentives to lobby jointly.Footnote 28 WeymouthFootnote 29 has suggested that firms that belong to trade associations are more likely to engage in lobbying. The reasons for this may be threefold. First, firms that belong to trade associations have access to more information on the costs and benefits of specific policies; second, firms may be held accountable through these associations; and third (and perhaps most importantly), trade associations have direct input on when, how, and on what bills and issues firms should be lobbying on. Most recently, Drutman has provided perhaps the most comprehensive theory to date of what drives corporate lobbying.Footnote 30 Drutman argues in part that lobbyists help to drive firm lobbying, with their efforts leading to greater degrees of lobbying activity by firms. These lobbyists act as entrepreneurs to create more political activity by firms, and trade associations may play a critical role in this entrepreneurship.
Trade associations provide the leadership for members to maximize and coordinate collective responses in hopes of maximizing return on investment. Having better information allows firms to assess the stakes of legislation and regulation and act accordingly. On the second point, Young et al.Footnote 31 argues that associations may hold members accountable through the use of sanctions against their members for failure to act in the interest of the group, leading to self-policing of the industry. Industries such as chemical, textile, pulp, and paper industries use self-enforcement of norms as a method of holding members accountable.Footnote 32 Many in the public, and within the public policy community, tie together the reputation of an industry in its entirety, not simply members.Footnote 33 Because this collective reputation is at stake, associations as well as individual members have a stake in ensuring compliance with dominant industry standards and norms. I argue that this can also include holding the line on public policy and on contributions to lobbying on public policies, which will promote the common good for association members. It is not inconceivable that this type of behavior can also extend to choosing which candidates to support, since campaign donations are highly visible and easily accessed. The ability to sanction may be a key factor in helping to overcome collective action problems among firms.
Trade associations function as an exchange mechanism for information,Footnote 34 and aggregate and distribute information to members. As early as 1968, scholars argued that trade associations use political means to achieve objectives.Footnote 35 Trade associations lobby and initiate government action. Scholars have argued that conventions and trade association meetings allow for networking of ideas and techniques.Footnote 36 Conventions can build ties around common interests, and build social ties that may be useful in gathering information related to political decisions. For example, at a risk-management trade association meeting, that hosted a “Brown Bag Lunch, which combines networking and education in a structured but informal atmosphere, was added to the conference schedule […] to allow attendees to participate in a wider range of group discussions.”Footnote 37 Trade associations also sponsor activities like lobbying trips by members to congressional offices. The American Seed Trade Association, (including members Dow, Monsanto, and DuPont) holds an annual convention where “[e]ducation, debate and advocacy are on the agenda.”Footnote 38 Indeed, meetings such as these allow for the integration of political and policy strategy with the facilitation of social ties, which can be used to build corporate political strategy.
Several issues underlie the creation of trade associations and the potential decisions to engage in collective versus individual behavior by firms. Scholars have argued that the decisions for interest groups to work together or collectively depend upon the type of issue they seek to address.Footnote 39 For interest groups that seek generalized influence, it may be more rational to create an alliance; however these costs may be outweighed when an interest group (or firm) attempts to influence a more specific policy. In this way, it may be more rational for a firm to invest the time and effort to work together only when seeking a more generalized policy issue. Trade associations may provide a more durable mechanism for maintaining coalitions, as a formalized structure may already be in place. This formalized structure can provide a benefit, but the institutionalization may lead to involving a firm in other issues they may not be as interested in initially. This presents an opportunity for collective action, but may in fact pose a burden (although potentially a small one) on firms that would not otherwise be involved. In addition, scholars have noted that lobbyists may in fact perpetuate lobbying.Footnote 40 Lobbyists within an association, or the lobbyists of individual firms, drive additional lobbying. It is possible that the professionalization of the association may drive staff to become bureaucratic entrepreneurs, who seek to advance their own goals.Footnote 41 However, this is most likely moderated by the need to maintain support by member firms and the need to maintain the association's members.
Previous research regarding the role of trade associations on political activity can be advanced in several significant ways. First, my work improves on measures of association. WeymouthFootnote 42 uses a very coarse measure of trade association membership by employing a dummy variable indicating whether a firm is a member of any business association, similar to MizruchiFootnote 43 and his usage of Business Roundtable membership within his models. In contrast, I employ a measure based on a weighted-network of the ties between firms based upon these associations. This weighted-network of ties includes the number of ties existing between any two firms through trade associations. Firms with a greater number of ties between them are considered to have a greater weight to their ties, also known as edges, and are therefore considered to be more connected.
Trade associations provide the capacity to foster relationships among corporate leaders, government affairs professionals, lobbyists, and public officials. They do this through hosting conferences, seminars, and other activities, which contribute to the formation of ties among individuals. These ties, in turn, promote the exchange of information and the kind of social pressure that leads to common political activity. Associations, in fact, tout these very characteristics to their members. The Retail Industry Leaders Association (RILA), for example, touts its ability to help members connect, claiming on their website that “RILA's educational and networking events are widely recognized for providing world-class forums for sharing ideas and expertise among peers and industry experts. Attending these events provides access to the latest industry information and unmatched networking opportunities.”Footnote 44 The RILA offers events such as the annual leadership forum, which is an invitation only event for retail CEOs. This event is billed on their website as a forum for interaction, as “[n]o other retail event brings more relevant CEOs together for dialogue and discussion around the critical business issues of consumer-facing companies.”Footnote 45 Aside from more formal panels and meetings, the event may build real social connections, through such activities as a golf tournament and a biking adventure at the 2015 meeting.Footnote 46 These social interactions intersect with panels such as “An Insider's Look at Politics 2015” where
[v]eteran journalist Chris Wallace leads a discussion between two political insiders, one Democrat and one Republican, on the state of Washington in the post-election world and the outlook for 2015. What are the issues most likely to be tackled, and how will they affect the retail industry? Is gridlock and partisan polarization here to stay? How should the business community participate in the process? These questions and more will be addressed in this candid exchange.Footnote 47
A sampling of attendees includes the CEOs of companies such as Coca-Cola, Walgreens, and Whole Foods. These are supplemented by annual government affairs meetings. The emphasis on civic affairs in the marketing of the event, such as how businesses should participate in politics, indicates the concept that associations are driving member behavior in this arena, providing advice about what is and is not important, and how best to achieve the desired results.
Importantly, trade associations may be used as a mechanism to enforce collective action, applying social pressure for firms to pull their weight and eliminate the free-rider problem.Footnote 48 Associations will provide explicit reminders of the need to participate, for example one anonymous association stated about association meetings with Congress “we see one company not able to make it for a couple of weeks, we give ‘em a call and ask, how's everything going? How are you doing? What are you struggling with on government relations that we can push for you, what can we do less of?”Footnote 49 This explicit effort to ensure firm participation may be critical in corporate political decisions.
Associations may act as forces of political cohesion, spurring companies to work together, and increasing competition among firms for control of these associations.Footnote 50 This can lead to an “arms race” effect, in which firms attempt to gain greater influence over associations and their policy positions by participating at ever-greater levels. Indeed, almost all firms belong to trade associations, with one study of 250 large companies showing they all belong to trade associations.Footnote 51 According to one interview by Drutman of a lobbyist representing a firm, it was stated of the corporation's membership to various associations that, “[w]e belong to them all. They're a very, very useful and important tool in the process, just incredibly important.”Footnote 52 An essential function of trade associations is that they are legal forums for companies to share information and coordinate on issues related to the political process.Footnote 53
Other group meetings highlight the importance of politics for business professionals. The Association of National Advertisers (ANA) hosts an annual Advertising Law and Public Policy Conference for corporate lawyers and executives. The event features panels such as “What the New Political Reality Means for Advertisers” and “Laboratories of Democracy: State Privacy and Security Interests.”Footnote 54 The Securities and Financial Markets Association's 2014 Foreign Account Tax Compliance Act (FATCA) Policy Symposium featured networking breaks and receptions along with a panel titled “View from the Hill: The Future of FATCA.”Footnote 55 The American Bankers Association's 2015 Government Relations Summit had sessions such as “Orientation for Capitol Hill Visits,” “Talking Data Breaches With Congress,” and receptions for both emerging leaders and for women's leadership.Footnote 56
Other organizations, such as Business Forward, provide opportunities for business leaders to interact with high-level administration officials and political leaders, which are then able to disseminate this information to their business and policy networks. According to Bert Kaufman, executive director of Business Forward, “[t]he idea was to invite these [executives] back in town and get a sense of what's at stake with the fiscal cliff. They go back home and talk to their colleagues, their clients and their networks. They write op-eds, talk to reporters and talk about the need for a balanced approach…The idea is to have a robust engagement here”.Footnote 57 These associations offer an opportunity for business leaders to gain information and connections, and then transfer that into political activity.
At this point, it is important to note that while trade association networks may provide an important network, it is but one of many. Firms interact in a number of ways, including board interlocks, informal relationships, and any number of other venues. While this study takes the position that trade associations may facilitate political behavior and help with the dissemination of political information, it is entirely possible that some other unobserved network may be at work. I attempt to account for this by including as a comparison with the board interlock network. However, it is entirely possibly that some other possible network is at play. Like many other types of research, omitted variables may bias analysis. This study cannot control for every type of corporate network, but does attempt to include the possibility that board interlocks may be important to determining corporate political behavior.
Data and methods
This study examines lobbying and campaign finance spending on congressional races in 2012 and lobbying in the U.S. Congress in 2012 and 2013 by Fortune 500 firms.Footnote 58 Lobbying and campaign finance data have the advantage of being highly visible and are required to be publicly disclosed each year or for each election cycle. Lobbyists must register and disclose their clients on a regular basis. Any person with at least one client, who spends at least 20 percent of their time engaged in lobbying activity and services is required to register as a lobbyist. Lobbying disclosures must be filed with the clerk of the House of Representatives and the secretary of the senate, with a fine of up to $50,000 for failure to comply.Footnote 59 Lobbyist registration data is publicly available from the websites of both the House and Senate, and is usually filed on an annual and semi-annual basis. In this study, I obtained data on all registered lobbyist disclosures from the Sunlight Foundation.Footnote 60 This data contain information on the lobbying firm, the client and the parent company, or a group of those hiring the firm. In addition, this data includes information about the amount of any contract between the lobbyist and client, as well as information on the issues and bills on which they are lobbying. Similarly, all candidates for federal office must disclose all expenditures as well as contributions received, and all Political Action Committees must disclose contributions and expenditures related to federal elections.Footnote 61 Such data is easily obtained from the Federal Election Commission or from various outside groups such as the Center for Responsive Politics. All lobbying expenditures must be reported to the clerks of the U.S. House of Representatives and the U.S. Senate on a quarterly basis. This information is available publicly and in easily downloadable form from several sources. I then went through all the records of lobbying in 2012 and 2013 and subset this data to Fortune 500 firms in each year. This was then merged in with the individual level and network data I obtained.
Fortune 500 corporations were the focus of this study for several reasons. First, many previous studies of CPA have focused on small subsets of the universe of corporations, such as only manufacturersFootnote 62 or the retirement industry,Footnote 63 while others concentrate on the very largest firms.Footnote 64 Since 1994, the Fortune 500 has included service companies along with manufacturers, thus presenting a much broader swath of corporations in a variety of industries and sectors, and making it a more representative sample of the largest corporations. Secondly, the Fortune 500 presents a listing of the 500 largest American corporations by revenue. As such, it is possible to measure the activity of those corporations with the largest potential for impacting politics through large donations. Third, the Fortune 500 provides a useful limiting point for an analysis of this type. While a sample of all corporations may be ideal, much of the data for many smaller companies is simply not publicly available. The Fortune 500 represents many of the largest and most well documented, and most widely watched companies in the world, making it the natural starting place for this study.
For each Fortune 500 firm in 2012 and 2013, I gathered a number of covariates. First, I gathered information on industry sector, revenue and profit, and number of employees. I obtained revenue and profit directly from the Fortune rankings, while industry and number of employees were obtained from the database Corporate Affiliations. This permits accounting for factors that have been associated with firm spending on lobbying,Footnote 65 as these individual level factors have been demonstrated to determine lobbying spending. However, these factors do not account for external, network level measures including revenue, profit, and industry. Revenue, profit, and number of employees were all transformed into natural log measures. For each industry, a series of dummy variables were created from the two-digit NAICS code, that allow for testing factors specific to defined market sectors.
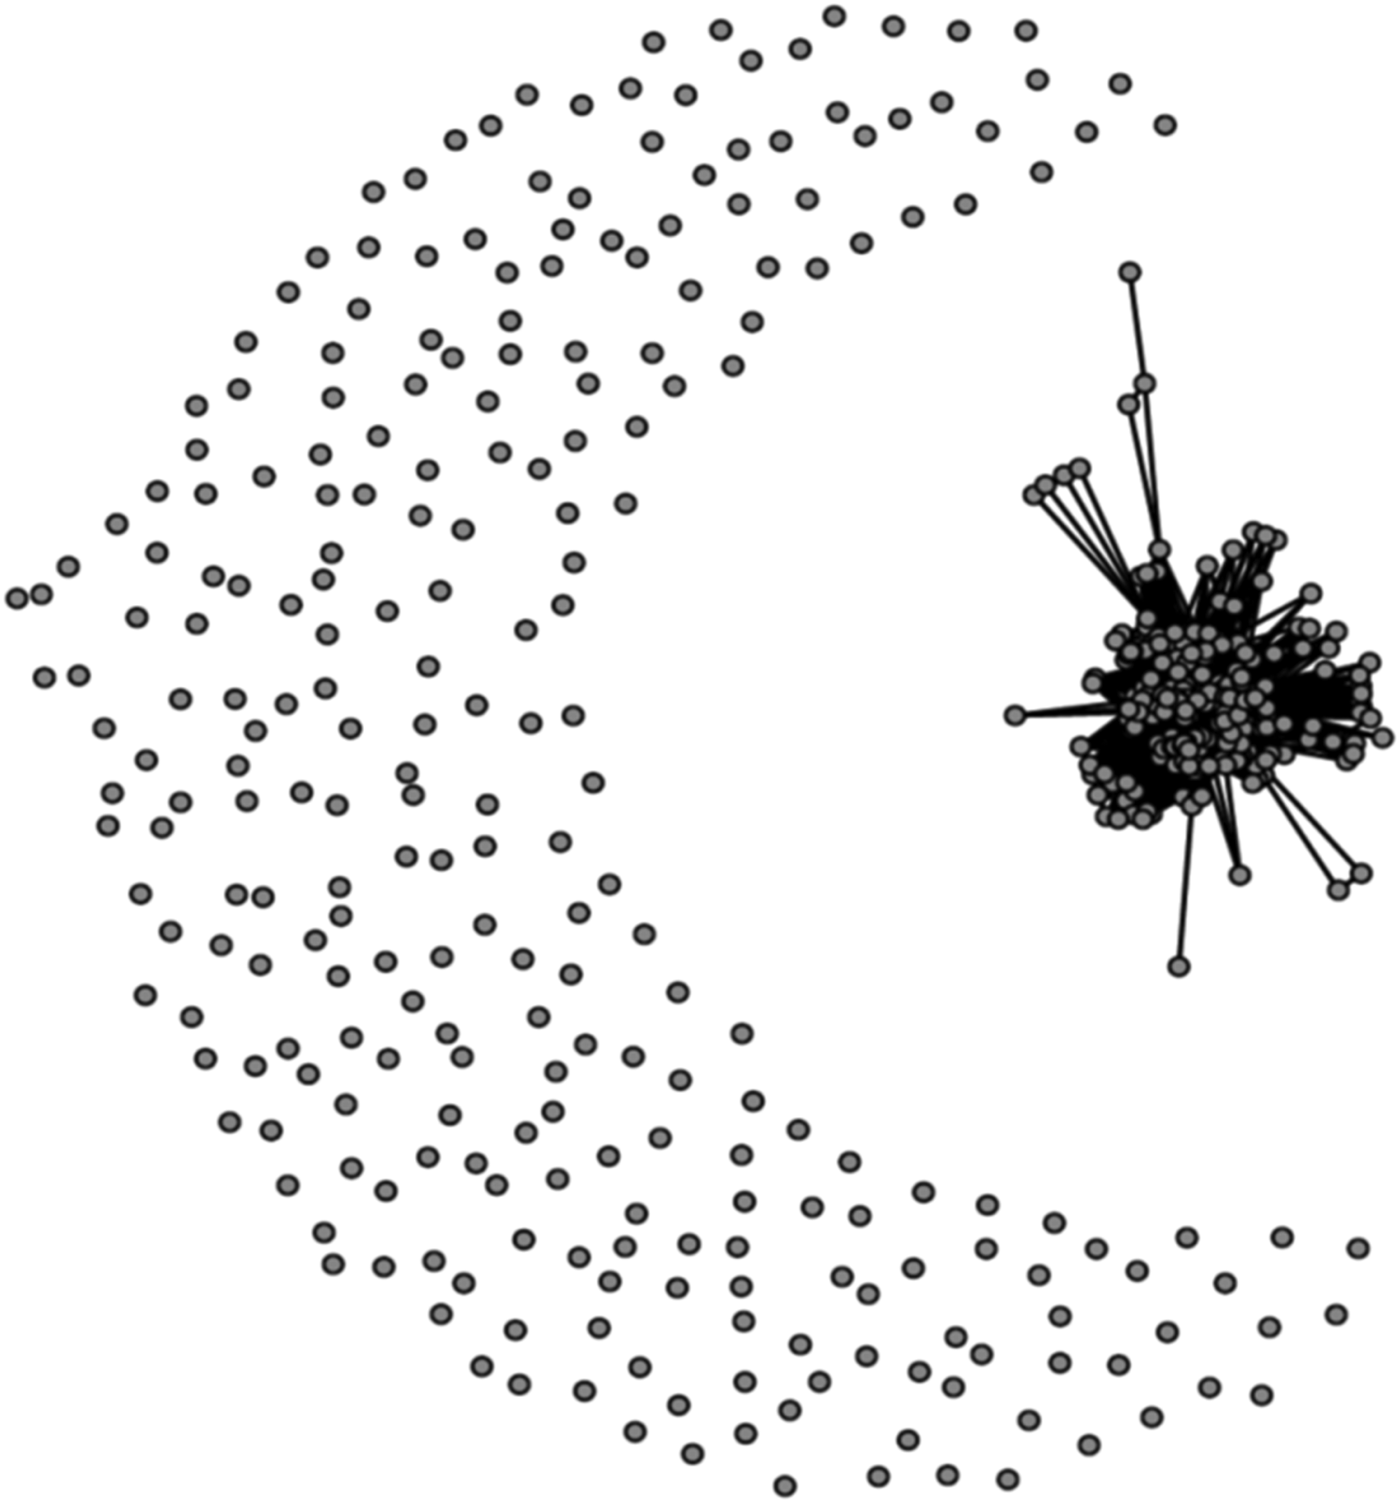
To operationalize the trade association network, I turn to the trade associations themselves. Many trade associations publicly disclose their member list. Some of these, such as the American Petroleum Institute, have one of the largest budgets among Washington interest groups. Most of these members provide their membership lists on their websites. It is from this source that I gathered data on membership for thirty-one of the largest trade associations. To conduct the temporal models, it was necessary to gather historical data. Projects such as the Internet Archive have stored large portions of the worldwide web in an online database. This tool allows users to view previous versions of countless websites. Through this tool, it was possible to find data on eighteen trade associations in the years 2010, 2012, and 2014. This cross-sectional network data can allow for understanding the spread of behavior through the network. Based on this information, I created a weighted, single-mode network (depicted in figure 1) of trade association ties based upon the number of ties between firms.
2012 Fortune 500 Trade Association network, minimum of two ties.

To better capture the factors associated with lobbying spending, I utilized several different networks in the models. First, corporate interlocks, or the common membership of Fortune 500 boards of directors, have been suggested as a critical piece of determining corporate political behavior.Footnote 66 Indeed, interlocking directorates are often the default method of thinking about corporate networks in the political context. Because of the significance of corporate interlocks on political behavior in previous work, it is essential to include this in this study. In order to do this, I obtained board of director membership from Fortune 500 members from the Corporate Affiliations database. This data is also freely and publicly available through corporate Securities and Exchange Commission (SEC) filings, particularly 10-K annual reports. I then created a weighted matrix in which the weights are the number of common board members shared between any two companies. In this way, a single-mode, weighted matrix was created connecting firms with one another.
2012 Board of Directors Network: Fortune 500.

Network autocorrelation models allow for understanding how the transmission of behavior can spread throughout a network.Footnote 67 Among other areas of research, network autocorrelation models have been used to predict the spread of campaign donations in ethnic neighborhoodsFootnote 68 and student success in school.Footnote 69 These models are commonly implemented in standard statistical software programs, including R. Various packages, including “sna”Footnote 70 and “tnam” provide the necessary functions to undertake such analysis.Footnote 71 Perhaps most relevant, MizruchiFootnote 72 uses the method to investigate the role of board interlocks on corporate giving in the 1980s. Network autocorrelation allows for incorporating network effects along with individual level covariates.Footnote 73 This ability to incorporate individual and social level measures provides a potentially significant benefit to researchers.
For the purposes of this study, the network autocorrelation model takes the following form:
 $${\bi y =} \rho {\bi Wy} \;{\bf +}\; {\bi X Beta \;+\;} {\bi \epsilon}{[1]}$$
Let y be a vector of the values taken for each observation in an (n x 1) matrix.
Let X represent the (n x p) matrix of covariates for n individuals on p covariates
and let W be the (n x n) network weight matrix. The elements wij are a measure of the influence of actor j on actor i. p represents the network autocorrelation parameter.
In this case, y is a n*1 vector of logged dollar contributions or campaign contributions by each firm to a specific category of candidate (Republican, Democrat, incumbent, challenger) or total lobbying expenditures by a firm. X is a matrix of covariates at the firm level including revenue, profit, and industry. W is a matrix of trade association ties between firms, operationalized as a weighted matrix based on the number of ties between firms or the number of ties between firms in the board interlock network.
In the network autocorrelation model for this study, the dependent variable is operationalized in several ways to test differing methods of giving. First, I test the aggregate donations of a PAC to Republican and Democratic candidates, as well as challengers and incumbents. In this case, the dependent variable is the total donations by PAC i to candidates of type j at time t .
After observing campaign finance donations, this study next turns to an examination of corporate lobbying expenditures. These expenditures are operationalized as the logged dollar amounts spent by each firm in 2012. After examining the total lobby expenditures, I next turn to examining spending behind specific issues. Lobbyists disclose not only the total amount spent lobbying, but must also disclose the issue they are lobbying on. For this portion of the study, I use data from 2013. Because some issues are fairly lightly lobbied upon, I use only issues that have at least five instances of lobbying. These issues are presented in Appendix B.
In order to capture the determinants of these giving behaviors, network autocorrelation allows for the inclusion of covariates in estimation of the model. Unlike standard regression models, network autocorrelation allows for including measures of network connectivity among the covariates in the model. While regression generally assumes the independence of actors, network analysis assumes the opposite: the interdependence of actors. Network autocorrelation includes as key independent variables in the model network matrices representing the linkages among nodes in the network. This ability to include these network links in the estimation of behaviors make the network autocorrelation model an ideal tool for understanding the causes of corporate political activity.
Results
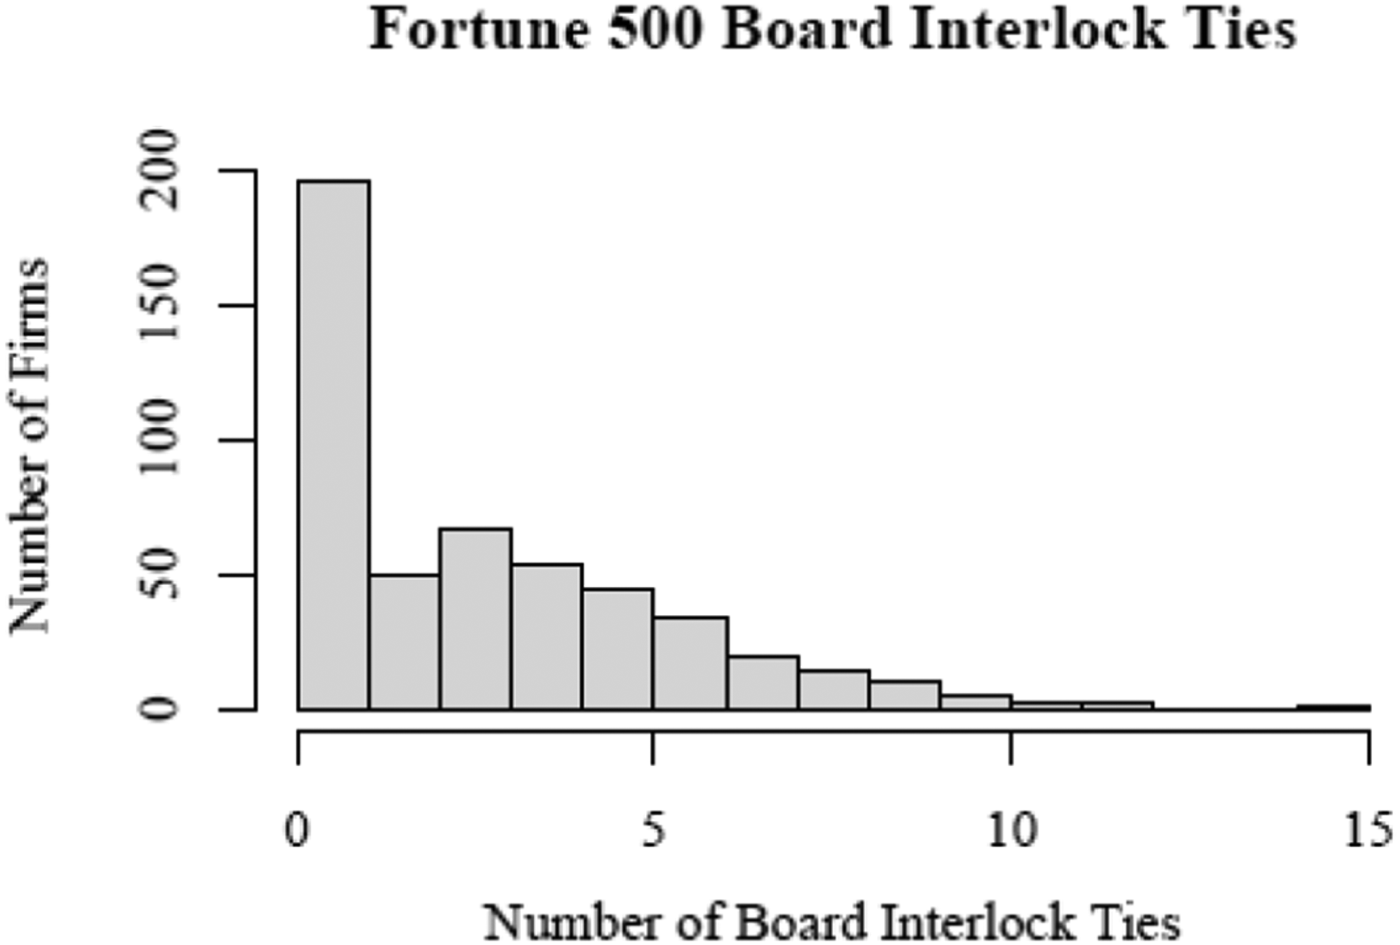
To better capture the factors associated with corporate political donations and lobbying, several different networks were modeled. First, corporate interlocks, or the common membership of Fortune 500 boards of directors, have been suggested as a critical piece of determining corporate political behavior.Footnote 74 Indeed, interlocking directorates are often the default method of thinking about corporate networks in the political context. It is vital to include corporate interlocks in this study, as in prior work. In order to do this, I obtained board of director membership from Fortune 500 members in 2012. To weight the number of common board members shared between two companies, I developed a weighted matrix, with the distribution of ties depicted in figure 3. Firms are considered linked if they share a common member of the board of directors. This network includes a significant number of isolates, and is a fairly sparse network. Density is a measure of the overall connectedness of the network, measuring the proportion of number of ties present within the network to the total number of potential ties between all firms. The corporate board network is incredibly sparse, with a density of .006. This can be taken as meaning only .6 percent of all possible ties between firms actually exist.
Distribution of ties for Fortune 500 firms via corporate interlocks.

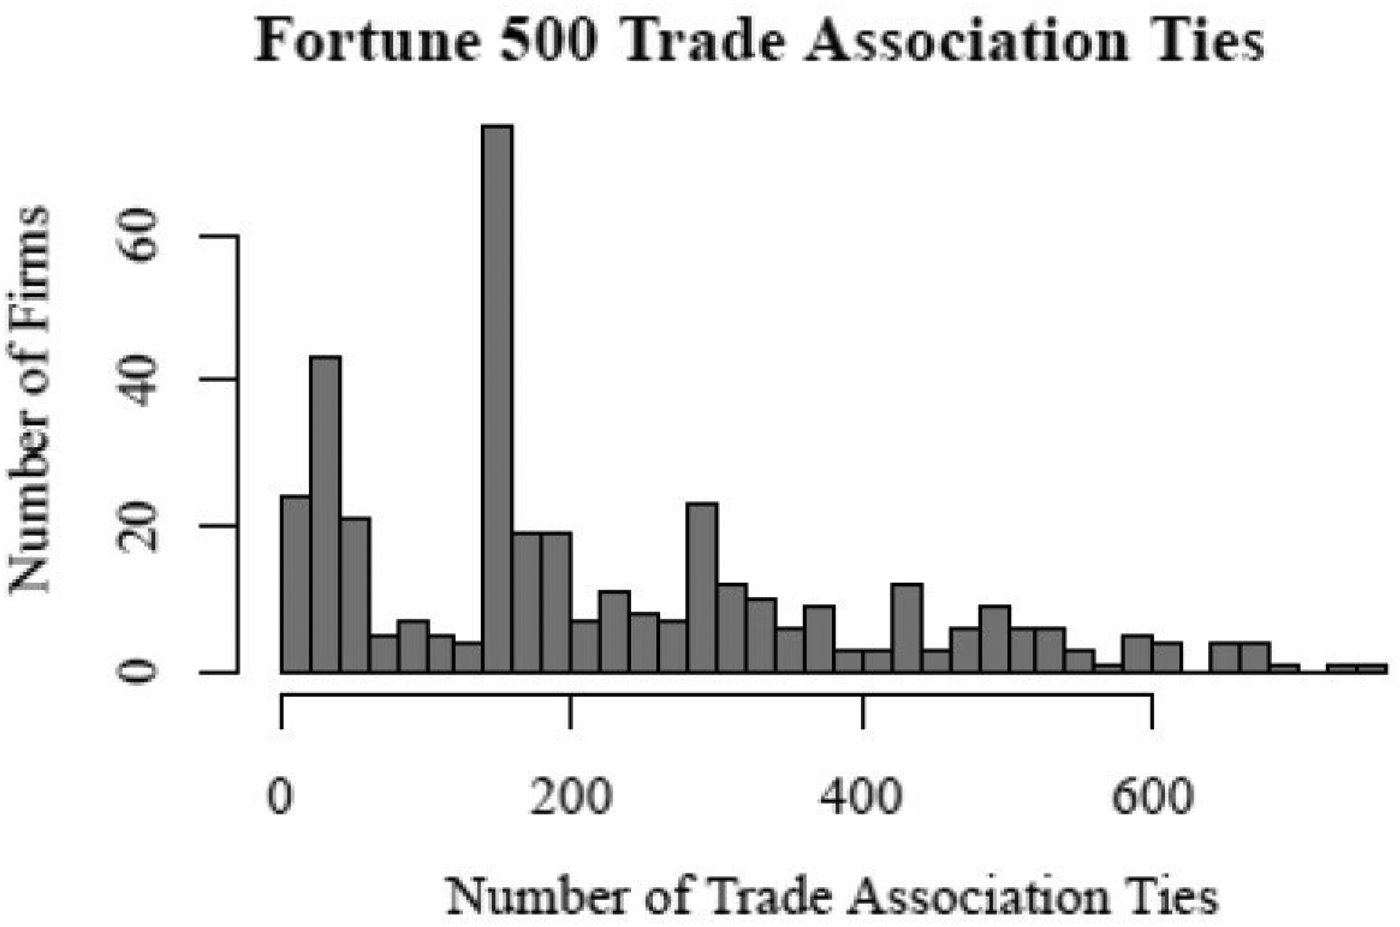
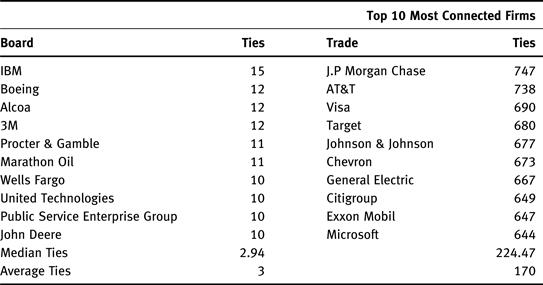
The second network included in this study is trade association membership, with the distribution of ties across firms depicted in figure 4. In order to create this network, I created a unique data set from the complete, publicly disclosed membership lists of thirty prominent business associations. These included the Business Roundtable, The Business Council, RILA, and Consumer Banking Association. While some groups, like the U.S. Chamber of Commerce, do not publicly disclose member lists the associations in this study still represent many of the largest business groups. For this network, I created a weighted matrix in which the weights are the number of common associational memberships between firm m and firm n. This network is fairly well-connected, with a density of .243. This means that 24.3 percent of all possible ties within the network actually exist. This density leads a significant number of firms to be connected into a single, large, and densely linked cluster. Table 1 presents the most connected firms in each network, along with the median and average number of ties for firms in each.
Distribution of ties for Fortune 500 firms via trade association membership.

Top 10 firms with the most number of ties in the board interlock and trade association interlock network. Also includes the median and mean number of ties for each network.

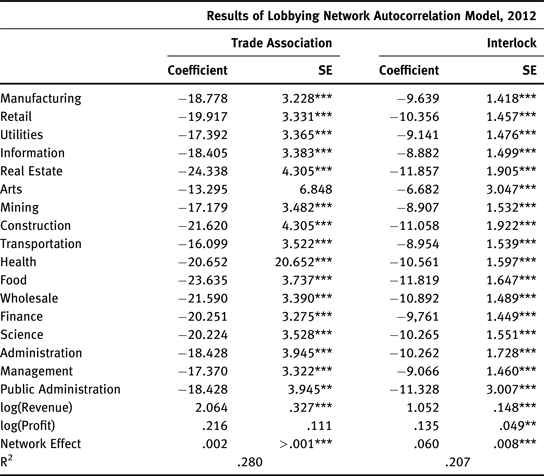
First, network autocorrelation models are estimated for lobbying networks in 2012. It should be noted that the adjusted R2 for the interlock directorate is .207, meaning about 20.7 percent of the variance is accounted for by the lobbying model. On the other side, the trade association network accounts for an adjusted R2 of .280. The results of these models are depicted in table 1 and table 2. This suggests that simply substituting the trade association network for the board interlock network accounts for an additional 7 percent of the variance in lobbying expenditures. This suggests that while the model only explains about one quarter of the variance, network ties are significant and should be incorporated in future models. For campaign finance, the adjusted R2 of each of these models is roughly .1 higher in each category. In other words, substituting the trade association network for board interlocks explains an additional 10 percent of the overall variance in campaign contributions. While this model explains a relatively small portion of the overall variance in campaign contributions, this generally larger adjusted R2 suggests that trade association networks are better at explaining campaign donations by Fortune 500 firms than board interlocks. After estimating the general model for total contributions, models are run for each issue type in 2013.
Results of network autocorrelation for log lobbying expenditures in 2012.

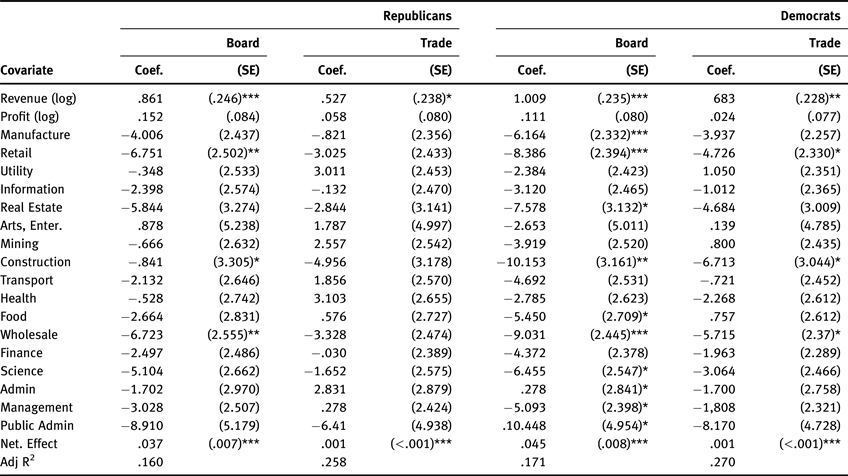
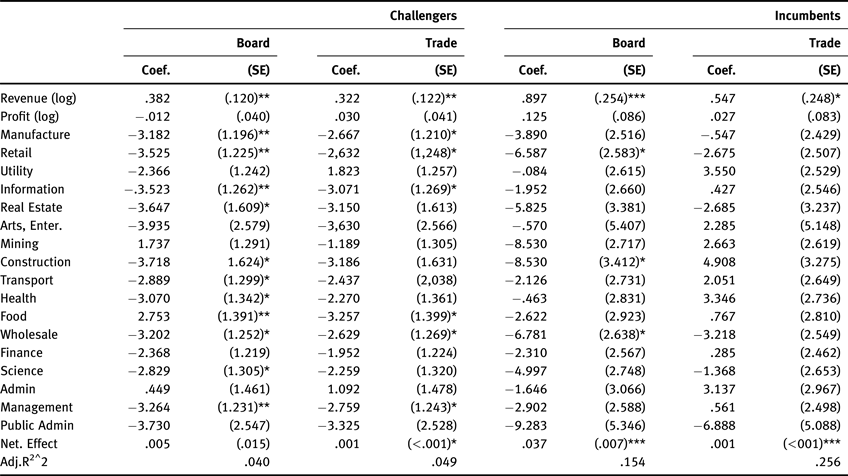
After estimating the lobbying models, network autocorrelation models are estimated for campaign contributions for House candidates in 2012. Models are estimated for each candidate type (Republican, Democrat, challenger, incumbent). The results are presented in table 3a and table 3b. These demonstrate that accounting for other factors (profit, revenue, industry), mean that positive and statistically significant network autocorrelation is observed between firms that are tied together.
Results of network autocorrelation for log campaign expenditures in 2012.

Results of network autocorrelation for log campaign expenditures in 2012.

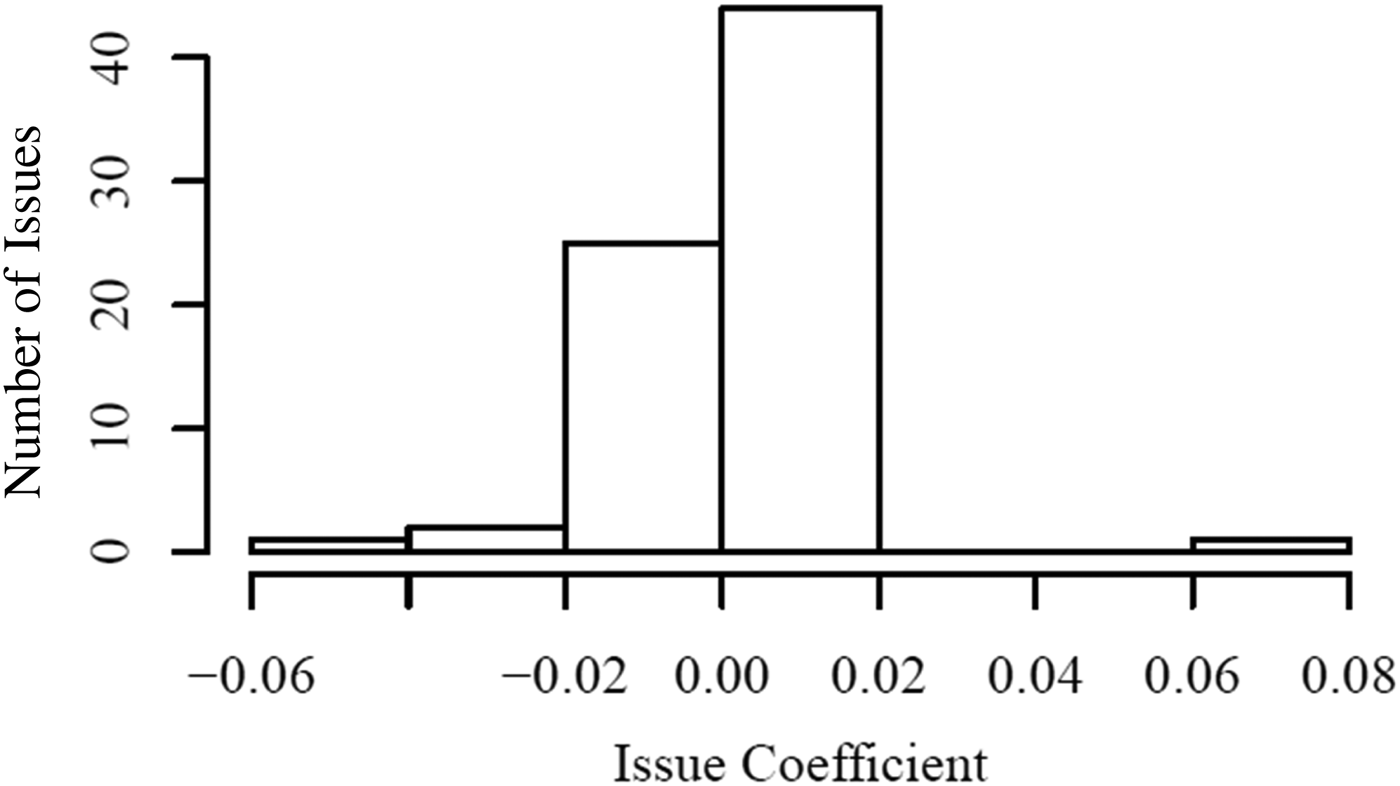
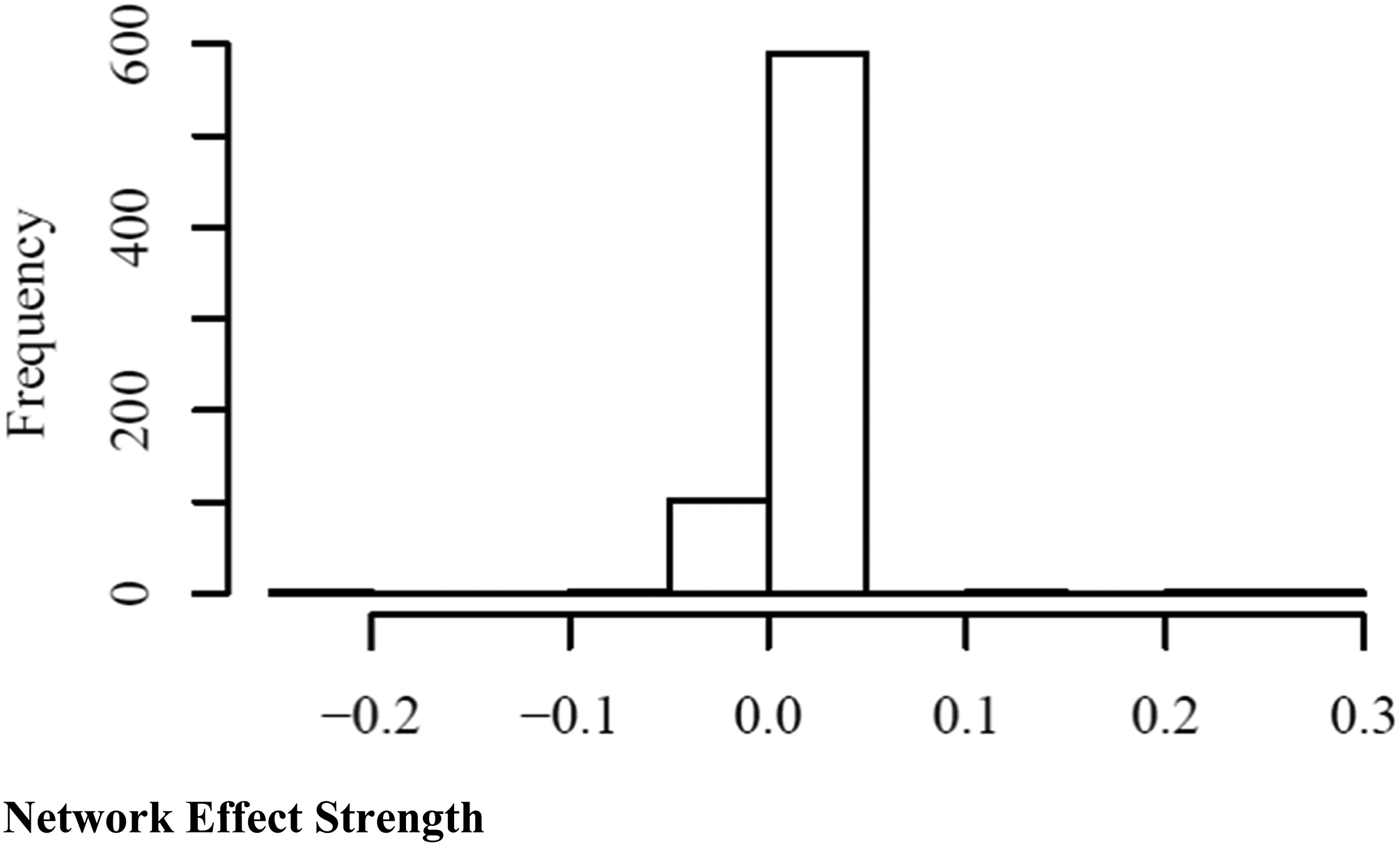
Once models were estimated for each type of candidate, individual models were then estimated for each of the 788 candidates for Congress in 2012. By estimating a network autocorrelation model in which the dependent variable is the logged amount of any donation from a corporation to the candidate, it is possible to test for how network effects shape the giving behavior of corporations and who they give to. Figure 5b depicts the coefficients of the associational membership network. As demonstrated, the vast majority of coefficients fall within the positive range (greater than 90 percent). This indicates with confidence that associational membership ties, accounting for other factors including board interlocks, are positively correlated with the decision to donate to any particular candidate. For the issue models, the results are mixed but encouraging. Figure 5a presents the distribution of trade association coefficients for all seventy-three issues. Overall, of the seventy-three issues modeled, the coefficient for trade association membership is positive for forty-five issues or 62 percent. This is an encouraging finding, although it requires further investigation. Because of the limited number of observations for some issues, it is difficult to be completely confident of these coefficients. For the majority of issues, the coefficient is positive. This suggests that for most issues, it is important to account for trade association membership.
Frequency of trade association coefficients for network autocorrelation models by issue, 2013.

Frequency of trade association coefficients for network autocorrelation models by candidate, 2012.

Most studies involving networks often provide a single snapshot of a network at a moment in time. While some studies in political science have looked at networks at multiple time periods,Footnote 75 these studies often simply analyze each network in isolation. Recent advances in network methods have provided a way to incorporate time-series and panel data methods into the study of networks. Scholars have begun to advocate for a dynamic approach to the study of networks as a way to begin to tease out the issue of causality.
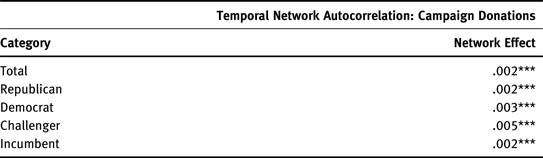
Temporal Network Autocorrelation (TNAM) provides a mechanism for analyzing dynamic network data. By analyzing networks through cross-sectional data, it becomes possible to understand the spread of behavior through a network over time. Given this, this study next turns to a cross-sectional approach to examining the role of trade association networks. To accomplish this, this study utilizes contributions made by the 2012 Fortune 500 to members of Congress in the 2010, 2012, and 2014 elections. By going from a single time period to three observations, it is possible to compare how these donations by firms becomes more or less correlated with their ties over time. Because the list of Fortune 500 firms may change from year to year, for the sake of continuity I examine contributions by only 2012 Fortune 500 members in each of these three time periods. In each of these time periods, data was gathered to attempt to recreate the network for all three observations. Of the original thirty-one trade associations, membership data for eighteen were available at all three time periods. After gathering the data, temporal network autocorrelation was used to estimate the effect of the network over time. The results of this model are reported in table 4.
Autocorrelation coefficients in a temporal network autocorrelation model for campaign contributions to House candidates, 2010–2014.

Given the positive and statistically significant autocorrelation observed in each of the categories (aggregate donations, Republican, Democrat, challenger, and incumbent), it is possible to address the spread of behavior through the network. By examining the network over-time, it is possible to understand how behavior changes along with network structure. While not necessarily controlling for homophily, the model does control for major factors that would be theorized to signal common interests. This includes industry, revenue, and profit. This paper cannot rule out homophily. It is possible to say that common behavior in campaign finance donations are spread in correlation with network ties. Whether or not this is simply due to homophily among firms or if it is being driven by the network is difficult to say. Future analysis is necessary to completely rule out the effects of homophily, however the positive autocorrelation of firm behavior over time is a promising step that warrants further review.
Estimating the effects: A hypothetical example
The p coefficient for associational network effects appears relatively small in these models, but to truly understand the impact of these network effects an example is in order. For illustration, American Express is a large American financial firm, and is relatively well connected within the trade association network, but not especially so. However, their lobbying expenses in 2012 were very close to the standard deviation of the total (in non-logged dollars), which makes the company a useful test case. To calculate the marginal effect of the trade association network, I begin first by calculating the standard deviation of the logged amount of total lobbying expenditures and campaign contributions for each firm, expressed by σ.
After calculating the standard deviation for lobbying expenditures and campaign donations for each type of candidate among Fortune 500 firms, I then multiply the standard deviation by the estimated effect size, expressed as s and calculated by the equation:
 $${\bf s =}\; {\bf s \;\times\;} \rho $$
This represents the amount of an expected increase (in campaign donations or lobbying expenditures) of firm j for each tie between firm i and firm j.
To calculate the association of firm i on firm j, I define the association as the number of connections between the firms in the trade association network:
 $${\bi I} \;{\bf =}\; {\bf S}\,\,{\bf ties}{\rm}\, {\bf Firm}_{\bi {ij}} $$
The effect of firm i (American Express) on each of its alters is calculated separately and expressed as:
 $${\bi F}_{\bi {ij}} \;{\bf =}\; {\bi I}\,{\bf x}\,{\bi s}$$
I then convert the spending totals back to actual dollars by taking the exponential value of e by the value expected effect of firm i on firm j when:
 $${\bi T} \;{\bi =}\; {\bi e}\,{{\hskip-4pt\hat{}}}\,{\;\bi F_{ij}} \,{\bi if}\,{\bi F_{ij}} \;{\bi \ne 0}$$
Finally, I take the sum of the expected increases for a total net increase in spending among American Express's alters:
 $${\bi Total}\, {\bi Effect} \,{\bi = ST}$$
I find that a single firm making an independent decision to increase the level of lobbying expenditures can have a significant increase on the expenditures of other firms they are tied to, in both the trade association and board interlock networks. For example, one standard deviation of the logged amount is equal to 7.314 (or $1501.24 actual dollars). If American Express were to increase their expenditures on incumbents by this amount, we would expect to see a total increase of 9.406 log dollars ($314.61 actual dollars) for their alters (those firms to which they are tied within the network) in the trade associations networks. Essentially, for a one standard deviation increase of the logged total spending by American Express, it would spur an additional 20 percent increase in the total by its neighbors in the network. Conversely, the same contribution would elicit only an additional $10.86 in additional spending throughout the system due to board interlock ties. Therefore, a single decision to engage in lobbying at a higher level can have dramatic effects across the network. Perhaps most importantly, trade associations offer significantly more capacity than board interlocks to spread new behaviors across the corporate network.
We see similar behavior from firms in the campaign finance network. For incumbents, one standard deviation of the logged amount is equal to 5.363 (or $213.31 actual dollars). If American Express increases their expenditures on incumbents by this amount, we would expect to see a total increase of $308.48 from connected firms in the trade association networks. We would observe an increase of nearly 150 percent in the spending total by its neighbors in the network. The same contribution would elicit only an additional $7.19 in spending due to board interlock ties. This carries across other candidate types with $153.08 in additional spending on Democratic candidates which equates to an additional $308.26, with only $8.78 for board interlocks, and $184.07 turning into $308.38 for Republicans with only $8.49 from board interlocks.
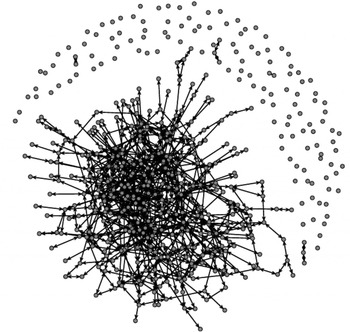
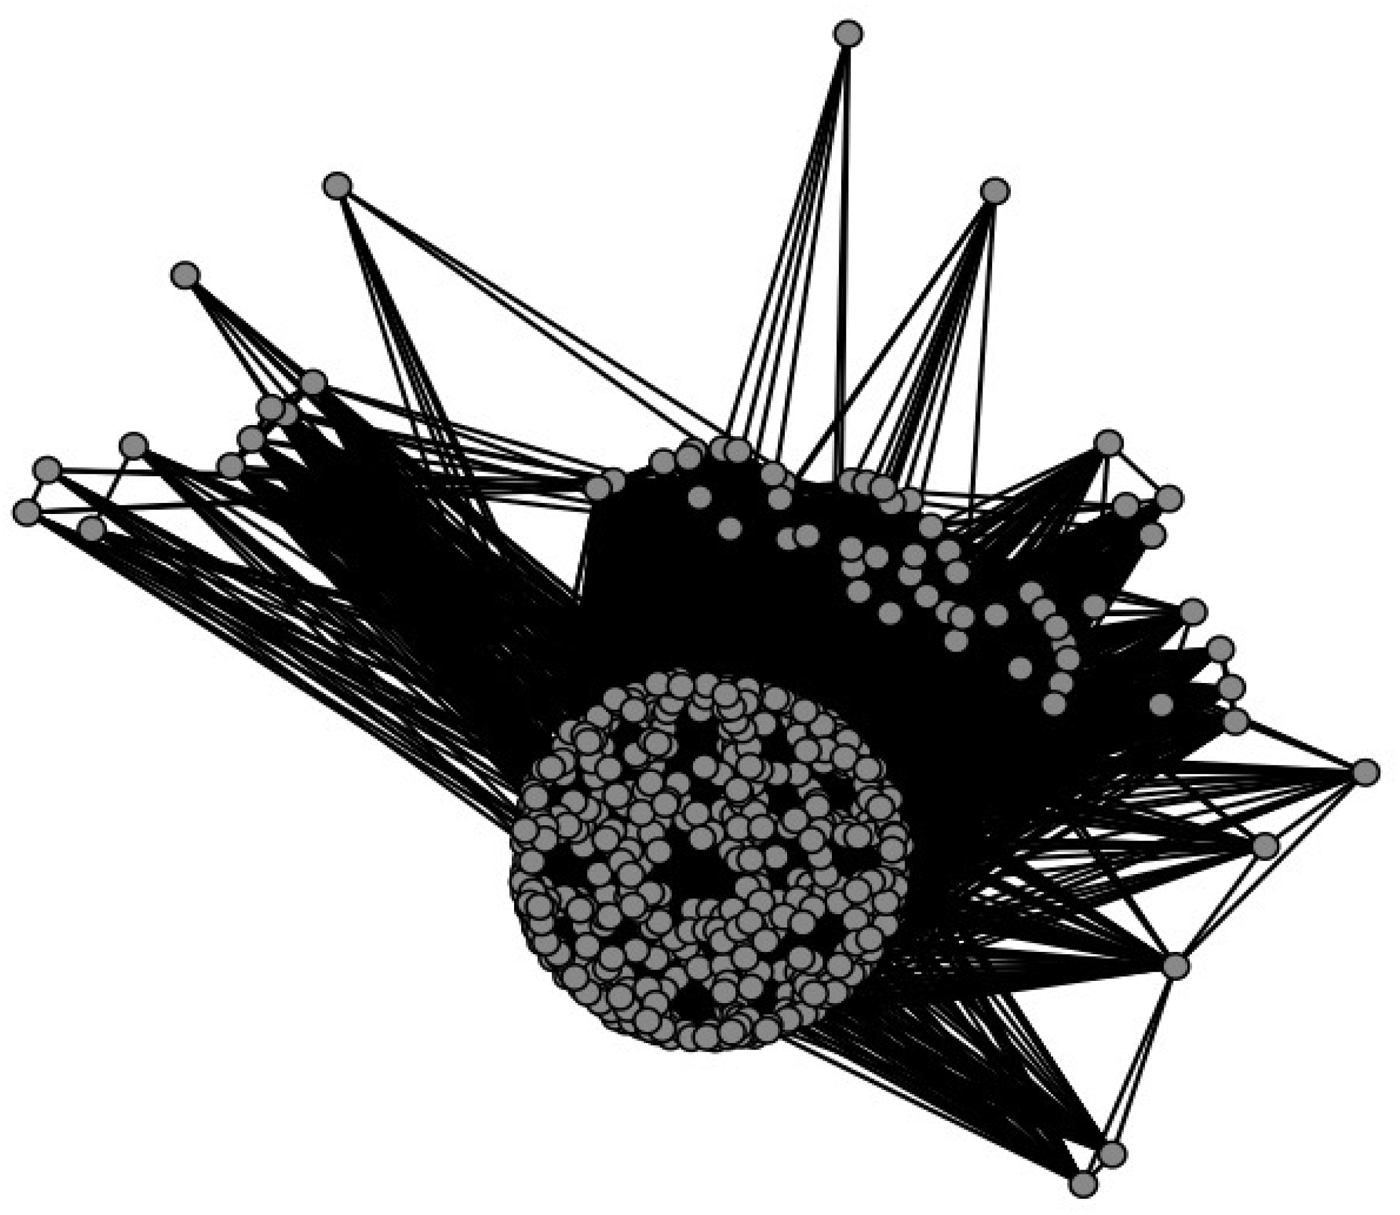
In figure 1, the trade association network is depicted with ties between two nodes being present only if they have a minimum of two ties between them. Because of the fact that a very large number of firms are tied through at least one association, it becomes difficult to truly picture the network. When this network is not restricted to two ties, we see a much more highly connected network, as depicted in figure 6. Because of the large number of firms having at least one tie, a shift in behavior in one firm can lead to corresponding shifts in behavior in a number of firms in the network. For each additional tie in the network, it is possible to understand how a firm can have a much larger effect.
2012 Fortune 500 trade association network, Full Network.

Discussion
Scholars have looked at firms in isolation for far too long. Individual factors specific to firms most certainly play a role in determining the overall level of engagement in politics. However, these are only responsible for a portion of the outcome. In this paper, I argue that neglecting the role of the corporate network limits the ability of researchers to understand corporate behavior. To understand corporate behavior, an understanding of the networks in which these organizations are embedded is key. However, the decline of the interlocking directorate network in influence and connectedness requires further explanation of what factors are at play when a firm decides to engage in politics. What can explain the changes in firm behavior when it comes to politics if the board interlock is no longer central? I provide an alternative theory, one which places emphasis on the role of ties developed by firms across membership in trade associations.
Trade associations have provided some interest for political scientists in terms of political activity, but mostly as actors in and of themselves. Few have looked at trade associations as conduits through which information and behavior may spread based on the social ties developed by member firms. DrutmanFootnote 76 has begun to look at the implications of trade associations as leading firms to lobbying, but empirical work on just how much a role they play on the level of expenditures (and on campaign finance) has yet to be developed. Trade association ties tend be correlated with giving behavior, and over time the behavior of alters tends to become closer. Small changes in giving by a firm may lead to a ripple effect throughout the network.
Because of the nature of network autocorrelation and observational studies, this study cannot speak to the causality of the trade association and CPA. It is possible that homophily may provide some explanation for these effects. However, I will lay out several possible theories of why this phenomena is observed and encourage further research to ascertain causal mechanisms. The first potential explanation is that firms are simply mimicking those around them. This type of mimetic behavior has a long history in organizational theory and business literature.Footnote 77 In this case, it is conceivable that firms rely on the firms to which they are tied as a simple heuristic to help make sense of the complex world of politics. Sometimes when the optimal course of action may be unclear, the best move may be to simply follow your neighbor or the crowd. This scenario could provide a mechanism in which firms simply engage in politics by watching which way the crowd goes. However, this explanation would be fairly unsatisfactory when it comes to extremely large, well-capitalized, and professional firms. Given that many of these firms have dedicated government affairs officials with full-time duties to monitor policy and chart a course for the political stances of a firm, it is highly unlikely that they are simply naïve managers waiting for others to act. A much more plausible theory is that firms are aware of and sensitive to the actions of other firms within their network. These firms and government affairs professionals, lobbyists, and executives are tied together through repeated interaction through trade associations, developing relationships that could be mined when seeking political information. Each firm has their own set of contacts, and firms doubtless understand that they likely stand to benefit if they are able to pool resources and knowledge. Firms may also pressure one another to pull their weight when it comes to lobbying on complex issues or helping to elect a critical candidate that may benefit from an alliance. This pressure provides a mechanism to overcome the free-rider problem,Footnote 78 and more generally perhaps ensure a greater probability of success. Given that rates of lobbying successes are so low,Footnote 79 it makes sense that firms would look to build alliances that help to up the odds of victory.
This study represents a first look into a new and promising avenue of research. Scholars must continue to investigate the underlying causes of this behavior. Trade associations may provide a venue for people with similar interests to come together and strategize. Future research may also take into account the geographic and spatial proximity of trade association locations. Perhaps the simple nature of being located near locations of power may provide additional opportunity for interaction even outside of formal events and meetings. To truly understand when, how, and why trade associations matter, scholars must continue to investigate the ways in which these firms, associations, and politicians interact and engage with one another the shadows as well as in the open.
Perhaps most importantly, this study finds that corporate political behavior is correlated with trade association network ties, and that it is possible that behavior spreads along with network ties in campaign contributions. When Citizens United was decided, politicians, citizens, and the media feared an influx of corporate cash in elections, building upon existing concerns about corporate lobbying. However, the expected increase in corporate spending on elections has yet to be observed. Given this association, it is possible that even relatively small changes in political spending by even a single firm in the trade association network can have a significant cascading effect throughout the network. Based upon the results obtained in this study, this paper contends that the ties developed between firms are associated with spending habits by peers. A single firm independently deciding to take advantage of their newfound campaign finance rights, or making the choice to significantly increase lobbying expenditures, could lead to large changes in the collective behavior of the network as a whole. It is difficult to predict if a given firm will ever decide to utilize the rights granted through Citizens United, however the findings here show that when it does, it will likely have significant implications. In an era when unequal representation between wealthy interests and the masses challenges democracy and may lead to significant levels of inequality,Footnote 80 such potential implications from these networks make them difficult to ignore.
Appendix A. List of Trade Associations
-
1. Biotechnology Industry Organization
-
2. American Beverage Association
-
3. Association of National Advertisers
-
4. American Chemistry Council
-
5. Business Roundtable
-
6. American Petroleum Institute
-
7. Coalition of Service Industries
-
8. Consumer Bankers Association
-
9. Consumer Electronics Association
-
10. Consumer Healthcare Products Association
-
11. Financial Services Forum
-
12. Financial Services Roundtable
-
13. Food Marketing Institute
-
14. National Aeronautic Association
-
15. Healthcare Leadership Council
-
16. National Association of Chain Drug Stores
-
17. National Cable and Telecommunications Association
-
18. National Defense Industrial Association
-
19. National Electrical Manufacturers Association
-
20. Pharmaceutical Research and Manufacturers of America
-
21. Public Affairs Council
-
22. Retail Industry Leaders Association
-
23. Securities and Financial Markets Association
-
24. Silicon Valley Leadership Group
-
25. United States Council for International Business
-
26. The Business Council
-
27. Airlines for America
-
28. Alliance of Automobile Manufacturers
-
29. Compete America
-
30. American Gas Association
-
31. National Mining Association
Appendix B. General Issue Codes
-
1. Labor, Antitrust & Workplace
-
2. Tariffs
-
3. Defense
-
4. Immigration
-
5. Consumer Product Safety
-
6. Chemical Industry
-
7. Roads & Highways
-
8. Transportation
-
9. Copyright, Patent & Trademark
-
10. Medicare & Medicaid
-
11. Foreign Relations
-
12. Finance
-
13. Fed Budget & Appropriations
-
14. Health Issues
-
15. Taxes
-
16. Education
-
17. Trade
-
18. Homeland Security
-
19. Environment & Superfund
-
20. Energy & Nuclear Power
-
21. Manufacturing
-
22. Medical Research & Clinical Labs
-
23. Food Industry
-
24. Agriculture
-
25. Pharmacy
-
26. Telecommunications
-
27. Clean Air & Water
-
28. Insurance
-
29. Government Issues
-
30. Banking
-
31. Indian/Native American Affairs
-
32. Natural Resources
-
33. Disaster & Emergency Planning
-
34. Housing
-
35. Torts
-
36. Tobacco
-
37. Computers & Information Tech
-
38. Science & Technology
-
39. Beverage Industry
-
40. Intelligence
-
41. Postal
-
42. Aviation, Airlines & Airports
-
43. Marine, Boats & Fisheries
-
44. Retirement
-
45. Bankruptcy
-
46. Veterans Affairs
-
47. Law Enforcement & Crime
-
48. Media Information & Publishing
-
49. Accounting
-
50. Radio & TV Broadcasting
-
51. Utilities
-
52. Commodities
-
53. Railroads
-
54. Real Estate & Land Use
-
55. Aerospace
-
56. Fuel, Gas & Oil
-
57. Minting, Money & Gold Standard
-
58. Economics & Econ Development
-
59. Constitution
-
60. Sports & Athletics
-
61. Advertising
-
62. Firearms, Guns & Ammunition
-
63. Urban Development
-
64. Trucking & Shipping
-
65. Small Business
-
66. Animals
-
67. Travel & Tourism
-
68. Hazardous & Solid Waste
-
69. Arts & Entertainment
-
70. Automotive Industry
-
71. Apparel, Clothing, & Textiles
-
72. Alcohol & Drug Abuse