Introduction
The question as to whether bilingualism affects cognition attracted considerable attention right at the dawn of the scientific investigation on bilingualism (Hakuta, Reference Hakuta1986). There has recently been a resurgence of interest on this question, propelled by results showing that bilingualism appears to improve executive control across the lifespan (for a review, see Bialystok, Craik, Green & Gollan, Reference Bialystok, Craik, Green and Gollan2009). The fast-growing literature on bilingualism and executive control has been punctuated by problematic results and failures to find bilingual advantages. This evidence has spurred several attempts to define the conditions in which beneficial effects of bilingualism emerge, and the specific executive-control mechanisms modulated by bilingualism (Colzato, Bajo, van den Wildenberg, Paolieri, Nieuwenhuis, La Heij & Hommel, Reference Colzato, Bajo, van den Wildenberg, Paolieri, Nieuwenhuis, La Heij and Hommel2008; Costa, Hernández, Costa-Faidella & Sebastián-Galles, Reference Costa, Hernández, Costa-Faidella and Sebastián-Galles2009; Hilchey & Klein, Reference Hilchey and Klein2011; Kroll & Bialystok, Reference Kroll and Bialystok2013). The inconsistencies in the results have led other researchers to question the reliability of bilingual advantages, and to ponder the possibility that the effects of bilingualism on executive control might not be genuine (Paap, Johnson & Sawi, Reference Paap, Johnson and Sawi2014). Whatever the conclusions single researchers have drawn from available evidence, it has been universally recognized that the wide spectrum of bilingual experiences makes the understanding of the relationship between bilingualism and executive control a complicated task. We focused in the present study on language switching, one of the primary features along which bilingual experience varies that has been proposed to be critically related to executive control (Costa et al., Reference Costa, Hernández, Costa-Faidella and Sebastián-Galles2009; Hilchey & Klein, Reference Hilchey and Klein2011). We concentrated on the regional dialects spoken in Italy, which are as linguistically distant from Italian as Italian from other Romance languages (Berruto, Reference Berruto, Maiden and Parry1997; Maiden Reference Maiden1995; Muljačić, Reference Muljačić, Maiden and Parry1997; Savoia, Reference Savoia, Maiden and Parry1997). Crucially, the use of Italian dialects is restricted to certain contexts, a feature considerably reducing the opportunities of language switching (see Appendix for a description of Italian dialects and their use). By providing an ideal test case for controlling the role of language switching, dialects could help us to elucidate whether the effects of bilingualism on executive control in part depend on language switching.
When do bilingual advantages appear?
The executive control, the attention system dedicated to monitoring and conflict resolution (Posner & Petersen, Reference Posner and Petersen1990), is pervasively engaged in a wide range of cognitive processes, including those involved in language. Claims that bilingualism affects executive control are based on results from tasks involving linguistic stimuli and spoken responses, such as the Stroop Task or the Verbal Fluency Task, which requires generating words from a certain category (e.g., animals) or starting with a certain phoneme (e.g., F). Bilinguals appeared to be less sensitive than monolinguals to the interference induced by color words in the Stroop Task (Bialystok, Craik & Luk, Reference Bialystok, Craik and Luk2008a), while measures of phoneme fluency indexing executive control demonstrated a more efficient control in bilingual speakers (Luo, Luk & Bialystok, Reference Luo, Luk and Bialystok2010). More strikingly, bilingual advantages have been observed in tasks in which the contribution of language is seemingly reduced, if not entirely absent (Bialystok, Craik, Klein & Viswanathan, Reference Bialystok, Craik, Klein and Viswanathan2004; Bialystok, Craik & Ryan, Reference Bialystok, Craik and Ryan2006; Bialystok, Reference Bialystok2006), and even when a second language is acquired late in life (Vega-Mendoza, West, Sorace & Bak, Reference Vega-Mendoza, West, Sorace and Bak2015). An example comes from the Flanker Task (Eriksen & Eriksen, Reference Eriksen and Eriksen1974), where participants indicate the direction of a visually presented arrow surrounded either by arrows pointing in the same direction (congruent trials) or a different direction (incongruent trials). Interference, determined by longer responses in incongruent trials, was reduced with bilinguals (e.g., Costa, Hernández & Sebastián-Galles, Reference Costa, Hernández and Sebastián-Galles2008; Pelham & Abrams, Reference Pelham and Abrams2014). While this sort of findings suggests effects of bilingualism that are far-reaching, and therefore exceeding the boundaries of language, they raise the question of what mechanisms are affected by bilingualism. In line with hypotheses that bilinguals accomplish the task of using the target language by suppressing the other language (Green, Reference Green1998), it has been proposed that bilingualism could boost general inhibitory mechanisms (Bialystok, Reference Bialystok2006; Bialystok et al., Reference Bialystok, Craik, Klein and Viswanathan2004; Bialystok et al., Reference Bialystok, Craik and Luk2008a; Bialystok, Craik & Luk, Reference Bialystok, Craik and Luk2012). This interpretation anticipates that bilinguals would demonstrate better abilities to respond to incongruent trials, the condition implicating inhibitory control. Contrasting with this prediction, other findings have revealed extensive bilingual facilitation encompassing congruent and incongruent trials (Bialystok, Reference Bialystok2006; Bialystok, Craik, Grady, Chau, Ishii, Gunji & Pantev, Reference Bialystok, Craik, Grady, Chau, Ishii, Gunji and Pantev2005; Bialystok et al., Reference Bialystok, Craik, Klein and Viswanathan2004; Bialystok & DePape, Reference Bialystok and DePape2009; Bialystok, Martin & Viswanathan, Reference Bialystok, Martin and Viswanathan2005; Costa et al., Reference Costa, Hernández and Sebastián-Galles2008; Reference Costa, Hernández, Costa-Faidella and Sebastián-Galles2009; Emmorey, Luk, Pyers & Bialystok, Reference Emmorey, Luk, Pyers and Bialystok2009; for review see Hilchey & Klein, Reference Hilchey and Klein2011). The overall advantage has been tentatively explained as stemming from the enhanced monitoring capacity of bilinguals’ executive control (Costa et al., Reference Costa, Hernández, Costa-Faidella and Sebastián-Galles2009). Accordingly, bilinguals could efficiently implement specific adjustments that would allow them to more easily overcome difficulties raised by conflicting stimuli. Under this hypothesis, bilinguals’ advantage is rooted in their long-term experience with monitoring which language is currently used and quickly determining whether language change is required. The hypothesis received empirical confirmation from data showing that the overall advantage in response speed disappeared when the proportion of conflicting stimuli was reduced (Bialystok, Reference Bialystok2006; Costa et al., Reference Costa, Hernández, Costa-Faidella and Sebastián-Galles2009). To the extent that monitoring demands are weak in these experimental conditions, bilinguals’ advantages should not appear here, as indeed the data confirmed.
Unfortunately, conclusions on the effects of bilingualism on executive control are complicated by several results showing no advantages, either with respect to reduced interference or overall response speed (for a review, see Paap et al., Reference Paap, Johnson and Sawi2014). Even more problematic is that while negative findings tend to appear in studies involving a large number of participants, findings revealing advantages are common in studies with fewer participants. Furthermore, a meta-analysis conducted by de Bruin, Treccani and Della Sala (Reference de Bruin, Treccani and Della Sala2015) makes it plausible that a publication bias has held back studies reporting no bilingual advantages, and consequently such advantages might be overestimated. Compounding these inconsistencies with specific challenges in bilingual research – most notably, difficulties in matching bilingual and monolingual participants (Hilchey & Klein, Reference Hilchey and Klein2011; Namazi & Thordardottir, Reference Namazi and Thordardottir2010) – the reliability of bilinguals’ advantage becomes a legitimate concern.
Notwithstanding the relevance of this concern, it is perhaps fitting to ask whether any lead emerges from the available findings. It is worth highlighting that overall fast responses were repeatedly found with Catalan–Spanish bilinguals (Costa et al., Reference Costa, Hernández and Sebastián-Galles2008, Reference Costa, Hernández, Costa-Faidella and Sebastián-Galles2009). Importantly, these results were obtained with large participant pools (>100), making sample size an unlikely concern. Furthermore, bilinguals and monolinguals shared very comparable backgrounds. Catalan–Spanish bilinguals use both of their languages in a wide range of contexts (Vila i Moreno, Vial & Galindo, Reference Vila i Moreno, Vial, Galindo, Rodríguez-Yáñez, Lorenzo and Ramallo2004), and are thus immersed in a sociolinguistic environment conducive to language switching. Costa et al. (Reference Costa, Hernández, Costa-Faidella and Sebastián-Galles2009) hypothesized that the advantage demonstrated by Catalan–Spanish bilinguals stems from frequently changing from one language to the other. If the advantage found in this population reflects frequent language switching, a lack of advantage could be associated with fewer opportunities of language switching. Unfortunately, opportunity of language switching has not been systematically controlled, and therefore, it is presently unknown whether this variable would explain some of the negative findings. It is possible that some of the participants in prior studies had very few opportunities to switch between languages. If it were sufficient that only a fraction of the participants experienced few opportunities of language switching to have advantages disappear, then we might explain some of the inconsistencies in the results. These considerations motivated our investigation with Italian–dialect speakers, who use dialect only in informal contexts (e.g., in the family or with friends), whereas only Italian is permitted in formal contexts (e.g., at school). Sociolinguistically, Italian and Italian dialects are used in more distinct contexts as compared to Catalan and Spanish. Assuming that a more compartmentalized use of the two languages results in fewer opportunities of language switching, Italian dialects and Catalan–Spanish could represent contrasting test cases. The advantages observed with Catalan–Spanish, where opportunities of language switching are frequent, would not appear with Italian dialects, where relatively fewer opportunities exist.
Little is known about the cognitive effects of the use of Italian dialect. Lauchlan, Parisi and Fadda (Reference Lauchlan, Parisi and Fadda2012) compared Italian speaking children fluent in Sardinian, a Romance dialect of Italy, and English–Gaelic children. English–Gaelic children were exposed to both languages in school programs, unlike Italian–Sardinian children who were only taught in Italian. Both groups outperformed age-matched monolingual children in multiple tasks. However, English–Gaelic children performed better than Italian–Sardinian children, including in tasks tapping executive control. Assuming that the more restricted use of Sardinian led to fewer language-switching opportunities, these results provide some support to the hypothesis of a causal linkage between language switching and multilingual advantage.
Overview of the study
The Flanker Task, a task of choice in studies of executive control and bilingualism (e.g., Carlson & Meltzoff, Reference Carlson and Meltzoff2008; Costa et al., Reference Costa, Hernández and Sebastián-Galles2008; Reference Costa, Hernández, Costa-Faidella and Sebastián-Galles2009; Kousaie & Phillips, Reference Kousaie and Phillips2012; Paap & Greenberg, Reference Paap and Greenberg2013), was examined in two experiments using different designs. In Experiment 1, subjective estimates of familiarity with dialect were used as continuous predictors of performance in the Flanker Task. Participants in Experiment 1 spoke a variety of Italian dialects. We switched to a factorial design in Experiment 2, where people with varying degrees of familiarity with dialect (high vs. low) were tested in the Flanker Task. Dialect speakers were linguistically homogenous in Experiment 2, as they were familiar only with the Venetian dialect used in the region where our study took place. Crucially, a large number of participants were enrolled (>100) to overcome a potential shortcoming of prior studies (Paap et al., Reference Paap, Johnson and Sawi2014). Furthermore, participants varying in their familiarity with dialect shared a common socio-economic background. Participants in Experiment 1 were also administered the Stroop Task and the Verbal Fluency Task. Bilingual advantages were reported in both of these tasks (e.g., Bialystok, Craik & Luk, Reference Bialystok, Craik and Luk2008a; Reference Bialystok, Craik and Luk2008b; Luo et al., Reference Luo, Luk and Bialystok2010), and we sought to determine whether similar effects replicated with participants familiar with Italian dialects. This question is important for two reasons. First, we can determine if dialect produces an advantage in language tasks. Second, we could provide a more comprehensive picture of the effects of dialect, a type of linguistic experience that has remained largely under-investigated.
Experiment 1
Participants
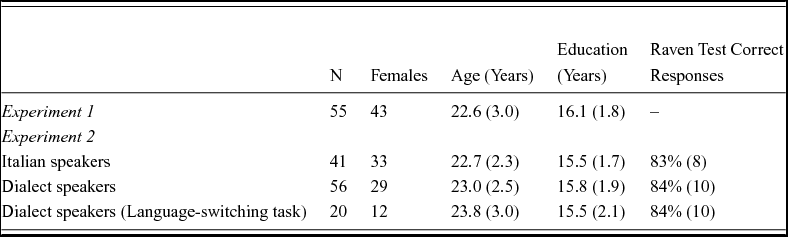
They were 55 native Italian speakers and students of the University of Padova (for demographics, see Table 1). We only enrolled participants who reported not to be bilinguals, defined as having acquired a second language in childhood and/or having spoken it regularly for an extensive time. A questionnaire assessing participants’ experience with second languages revealed that they were not functionally fluent in other languages than Italian. Exposure was limited to the acquisition in school of mostly one second language, and visits to foreign countries that lasted no longer than a few weeks, usually for summer courses or vacations. Only one participant reported longer visits (for a one-year student exchange) – data from this participant were excluded from analyses. Participants also estimated the percentage of daytime they have been exposed to an Italian dialect in adult life (after age 18). Estimates were obtained for various contexts (family, school, friends, hometown), separately for speaking and listening. Estimates were averaged across contexts to derive rates of dialect use that served as predictors of participants’ performance in the tasks of Experiment 1. Most of the participants reported speaking the Venetian dialect spoken in Padua and the nearby region. However, since students from all over Italy enroll in the University of Padua, a few participants reported speaking other types of Italian dialects. Importantly, participants reported to be familiar with only one Italian dialect. The study received approval from the local Ethic Committee.
Demographics of participants in Experiments 1 and 2. Means (SD).

(a) Flanker task
Methods
Stimuli consisted of an arrow (the target) presented on the center of the computer monitor, and flanked by 2 distractors on the right and the left, respectively. Distractors could be straight lines (neutral condition), or arrows oriented either as the target (congruent condition) or in the opposite direction (incongruent condition). Stimuli appeared in black on a white background spanning a visual angle of ~4.3°. Congruent, incongruent, and neutral distractors appeared equally frequently in the experiment (96 times), as well as across each of the three experimental blocks. Presentation was pseudo-randomized, so that targets had the same orientation in no more than 5 consecutive trials, and the same distractor did not appear in more than 3 consecutive trials. Each trial started with the fixation cross, displayed for 400 ms and immediately replaced by a blank screen shown for 1 s; next, the target was displayed until a response was made, or up to 2 s. The next trial began immediately afterwards. Participants were instructed to indicate if the central arrow pointed to the left or the right, ignoring the flanker stimuli. Speed and accuracy were both emphasized in the instructions. Participants sat in front of the computer screen and responded by pressing distinct keys of the keyboard (A for left, L for right). E Prime 2 (Psychology Software Tool, Inc.) was used for stimuli presentation and response recording.
Results
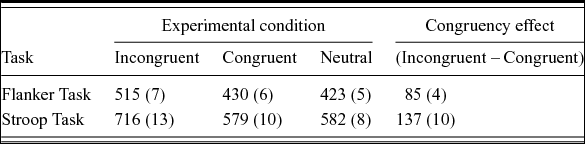
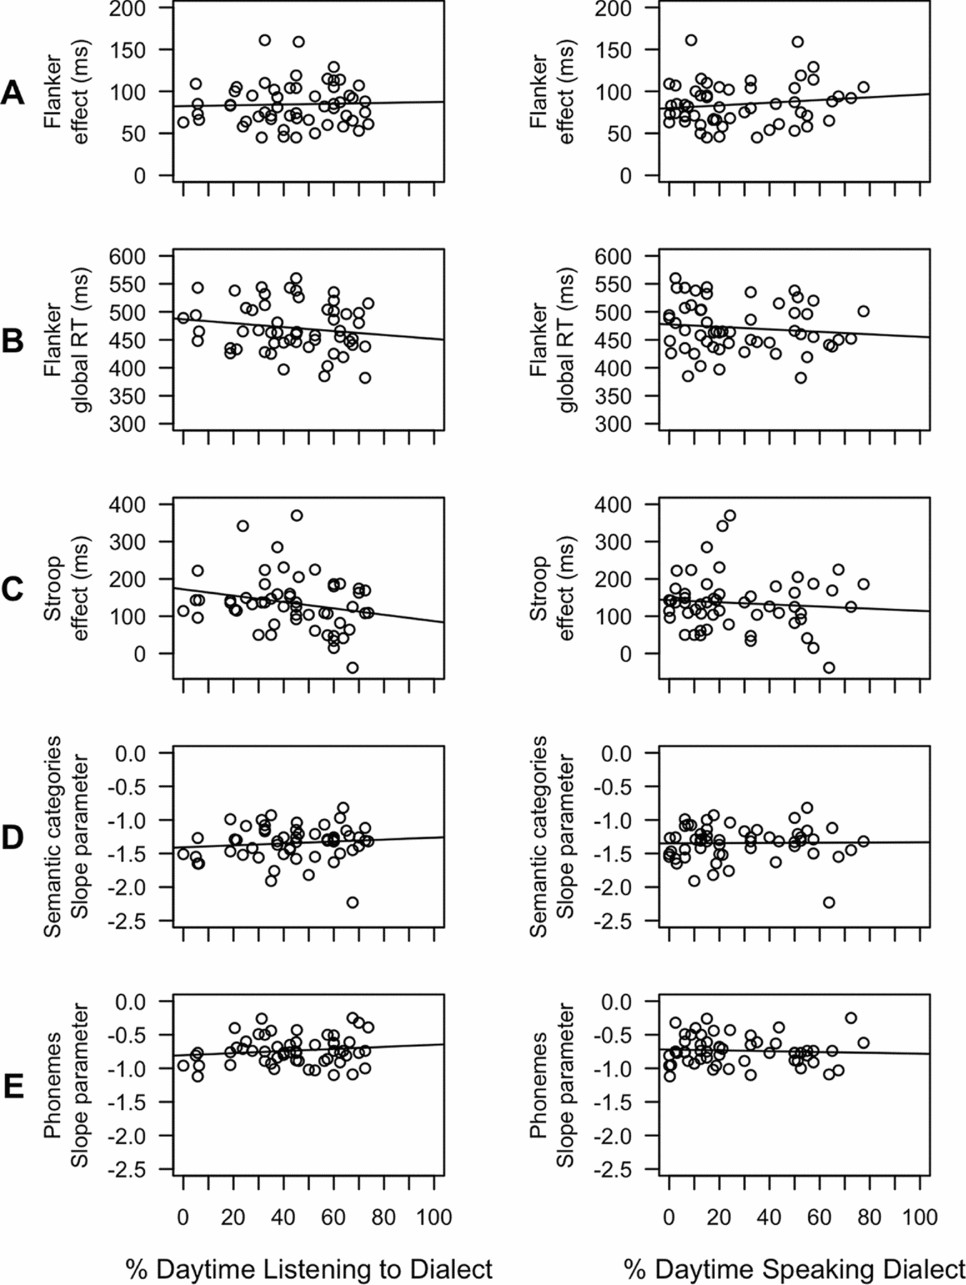
Errors (2.65%) were removed along with outliers (1.68%) that were identified through a recursive trimming procedure based on the sample size of each experimental cell (Van Selst & Jolicoeur, Reference Van Selst and Jolicoeur1994). (The procedure was applied to each RT analysis.) As summarized in Table 2, RTs revealed a 85 ms congruency effect (95% CI [78, 92]), reflecting faster responses to congruent than incongruent stimuli (t(53) = 24.07, p < .001). Congruency-effects, calculated for each participant, were regressed on participants’ estimates of daily exposure to dialect. Estimates concerning listening (b = 0.05, SE = 0.18, t(53) = 0.29, p = .77) and speaking (b = 0.16, SE = 0.16, t(53) = 1.02, p = .31) both failed to significantly predict congruency effects (Fig. 1A). Other linear models examined overall RTs (congruent+incongruent trials). Both estimates did not appear to predict global RTs (listening estimates: b = −0.37, SE = 0.30, t(53) = −1.21, p = .23; speaking estimates: b = −0.22, SE = 0.27, t(53) = −0.82, p = .41; Fig. 1B).
Mean RTs (SE) for Flanker and Stroop Tasks (Exp. 1).

Indexes of task performance (Experiment 1) plotted against percentage (%) daytime spent listening to dialect (left column) or speaking dialect (right column). Flanker Task: congruency effect (A), global response times (B). Stroop Task: congruency effect (C). Verbal Fluency Task: slope of logarithmic functions with semantic categories (D) and phonemes (E). Solid lines represent relationships amongst variables estimated via linear regression (see text for details). No significant relationships were found.

(b) Stroop task
Methods
Stimuli consisted of a row of 5 Xs and 5 color words (the Italian translations of red, yellow, green, blue and brown) printed in one of 5 colors (red, yellow, green, blue and brown). While words and their colors matched in the congruent condition, they differed in the incongruent condition. Xs were shown in the neutral condition. Stimuli were displayed in Times New Roman font, 13-point, on a black background. Each word and color appeared an equal number of times throughout the 180 trials of the experiment, and within the 3 blocks in which the trials were divided. Stimuli were presented in a pseudo-randomized order, according to which the same word or the same color was not repeated in more than 2 consecutive trials, and the same condition in more than 3 consecutive trials. Each trial consisted of the following sequence of events: fixation cross (500 ms), blank screen (200 ms), and stimulus (until a response was made, or up to 2 s). The next trial began immediately afterwards. Participants were instructed to say the color in which the stimuli appeared, both fast and accurately, and to ignore the written words. Stimuli presentation was controlled by DMDX software (Forster & Forster, Reference Forster and Forster2003). Response latency and accuracy were determined off-line using the CheckVocal software (Protopapas, Reference Protopapas2007). Incorrect color names were marked as incorrect responses, together with responses including hesitations and self-corrections.
Results
Data from one participant were discarded because of excessive error rates. 1.73% of the naming responses were scored as incorrect, whereas 1.61% were identified as outliers. Results are summarized in Table 2. We observed a sizable interference effect of 137 ms (95% CI [117, 158]), determined by faster responses to congruent than incongruent word-color pairs (t(52) = 13.55, p < .001; see Table 2 for data summary). The congruency effect was not predicted by participants’ estimates of daily exposure to dialect either in listening (b = −0.78, SE = 0.51, t(52) = −1.45, p = .13) or speaking (b = −0.27, SE = 0.46, t(52) = −0.57, p = .57; Fig. 1C).
(c) Verbal fluency task
Methods
The task required saying as many Italian words as possible in 60 s that were either from specific semantic categories (animals, fruits, tools, or vehicles), or started with a given phoneme (F, L, or P; the phonemes used in the Italian version of the task (Novelli, Papagno, Capitani, Laiacona, Vallar & Cappa, Reference Novelli, Papagno, Capitani, Laiacona, Vallar and Cappa1986)). Participants were instructed to say different words, and to avoid proper names, repetitions, and variants of the same word. Responses were digitally recorded for purposes of determining accuracies and latencies.
Response analyses were as in Luo et al. (Reference Luo, Luk and Bialystok2010), which in turn were modeled after Rohrer, Wixted, Salmon and Butters (Reference Rohrer, Wixted, Salmon and Butters1995), and hinged on the assumption that vocabulary knowledge and executive control are primary processing components of verbal fluencies. Both components affect retrieval speed, though each in different ways. While the category task depends especially on concept networks acquired with vocabulary knowledge, the phoneme task depends more on executive control to permit the retrieval of words according to the more demanding, task-specific phoneme criterion (Luo et al., Reference Luo, Luk and Bialystok2010; Strauss, Sherman & Spreen, Reference Strauss, Sherman and Spreen2006). This account has found support from neuropsychological studies that have showed decline in semantic fluency particularly in conditions impairing conceptual knowledge, while worsening in phonemic fluency appeared in pathologies affecting executive control (Rascovsky, Salmon, Hansen, Thal & Galasko, Reference Rascovsky, Salmon, Hansen, Thal and Galasko2007; Troyer, Moscovitch, Winocur, Alexander & Stuss, Reference Troyer, Moscovitch, Winocur, Alexander and Stuss1998). Furthermore, executive control becomes more important as more words are produced, when inhibiting inappropriate responses, self-monitoring, and avoiding perseverations become increasingly crucial. Differences between bilingual and monolingual speakers, traceable either to vocabulary knowledge or executive function, appeared in the verbal fluency task (Gollan, Montoya & Werner, Reference Gollan, Montoya and Werner2002; Kormi-Nuori, Moradi, Moradi, Akbari-Zardkhaneh & Zahedian, Reference Kormi-Nuori, Moradi, Moradi, Akbari-Zardkhaneh and Zahedian2012; Luo et al., Reference Luo, Luk and Bialystok2010; Rosselli, Ardila, Salvatierra, Marquez, Matos & Weekes, Reference Rosselli, Ardila, Salvatierra, Marquez, Matos and Weekes2002; Sandoval, Gollan, Ferreira & Salmon, Reference Sandoval, Gollan, Ferreira and Salmon2011). In particular, within a phoneme fluency task bilingualism was found to affect the time-course function of retrieval, a measure of the decline in the number of words generated across time. The function is derived from two parameters of verbal fluency: (a) initiation, which reflects the number of words reported at the beginning of the task, and is related to vocabulary knowledge, and (b) slope, which reflects the decline in retrieval over time, and is primarily associated with executive control. In the phoneme task, Luo et al. (Reference Luo, Luk and Bialystok2010) reported slope difference resulting from a smoother decline in word generation with bilingual speakers. The finding of effects of bilingualism on slope and phoneme fluency, two features associated with executive controls, is in line with the hypothesis that bilingualism improves executive control. Our analyses aimed at establishing whether similar effects on slope and phoneme fluency would appear with dialect.
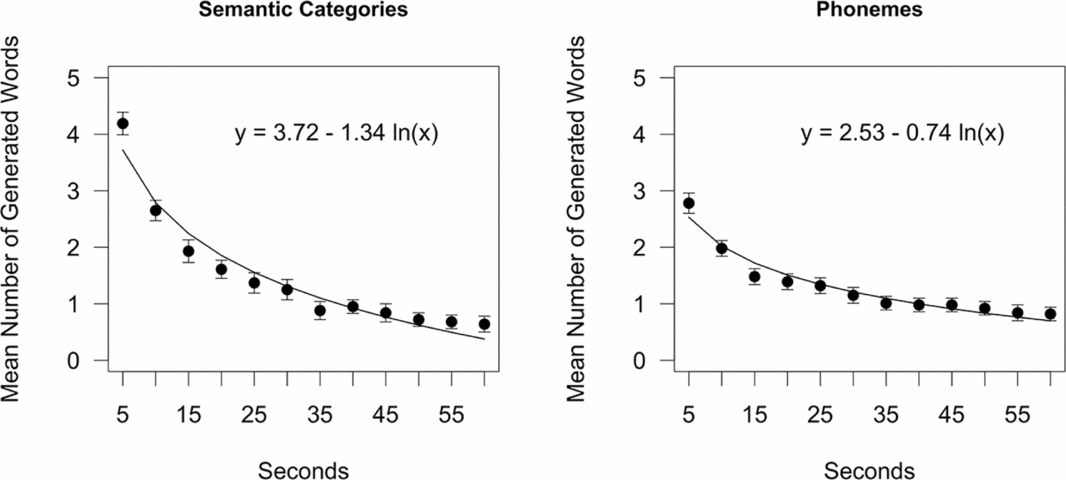
To determine the time-course function of retrieval for each participant, we measured (a) first-response latency, and (b) subsequent-response latency (the time interval between the first response and each subsequent response). First- and subsequent-response latencies were then averaged across the trials in the phoneme task (F, L, and P), as well as across semantic categories (animals, fruits, tools, and vehicles), to obtain an overall mean score for each task. Finally, the responses that individual participants produced in each list were divided into 12 bins of 5 s each. The numbers of words generated within each bin were averaged across trials of the same task, in order to obtain the mean number of words produced within each bin, in each task. The means obtained from each participant in each task were fitted with functions determined by (a) the initiation parameter (the starting point of the function corresponding to the number of words in the first 5 s bin), and (b) the slope related to the distribution of responses across all of the 5 s bins in the trial. To improve fitness, logarithmic functions were used, as suggested by Luo et al. (Reference Luo, Luk and Bialystok2010). The mean logarithmic functions, drawn from averaging across the functions fitted for each participant, are shown in Figure 2. The logarithmic functions described time-course reasonably well, accounting for 94% of the variance in both tasks. In this respect, we closely replicated Luo et al. (Reference Luo, Luk and Bialystok2010).
Mean number of words generated within 5-s bins. Semantic categories (left); phonemes (right). Lines correspond to means predicted by the logarithmic functions based on parameters (initiation and slope) derived from participants’ responses (see text for details). Error bars represents 95% confidence intervals. Logarithmic functions provide reasonably good fits.

Results
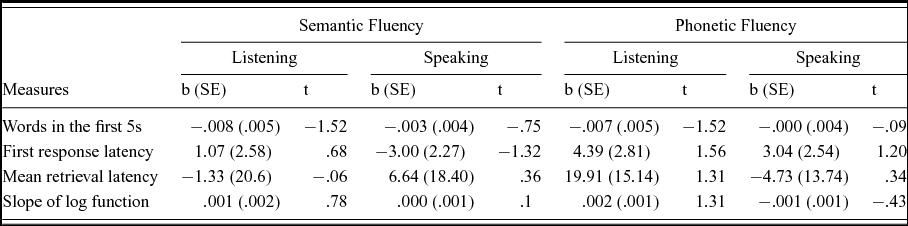
Slope parameters were regressed on participants’ estimates of daily experience with dialect in listening or speaking. None of the predictors proved to be significant, either in the semantic category task or the phoneme task (see results in Table 3 and Fig. 1).
Regressions of measures of verbal fluency on estimates of percentage (%) daytime spent listening to or speaking dialect.

Note. b = estimated coefficient; SE = standard error; t = t values for the coefficients. All ts with ps > .1.
Of particular relevance are the findings in the phoneme task, the condition in which differences between bilinguals and monolinguals appeared in Luo et al. (Reference Luo, Luk and Bialystok2010). Regressions were also conducted entering first-response latencies and the initiation parameter – two measures indexing vocabulary knowledge – as dependent variables. Estimates of familiarity with dialect failed to significantly predict these measures (ps > .1; Table 3), thus revealing that even participants highly familiar with dialect demonstrated good vocabulary knowledge in Italian.
Summary
Effects of bilingualism have been reported with a handful of tasks related to executive controls, including those examined in Experiment 1 – Flanker Task, Stroop Task, and Verbal Fluency. None of the measures obtained in these tasks varied as a function of reported familiarity with dialect. These findings were acquired from a reasonably large group of participants and based on a range of measures sensitive to executive controls. The negative findings of Experiment 1 could reflect the subjective measures of dialect use we employed, specifically the possibility that these measures were poorly reliable. This concern was addressed in Experiment 2, collecting objective measures of language proficiency.
Experiment 2
Participants
The participants were 97 university students and residents of Padua or its vicinity, where a variant of Venetian is spoken. Demographics are shown in Table 1. Exposure to second languages was similarly limited as described with participants in Experiment 1. Participants in Experiment 2 were divided into two groups, depending on whether they identified themselves as Dialect (D) speakers (N = 56), or Italian (I) speakers (N = 41) not proficient in dialect. It should be noted that living in an environment in which dialect is frequently used, I speakers had some familiarity with it. D and I participants were matched for scores with Raven's progressive matrices, a test of non-verbal intelligence, in addition to age and education (ts < 1; see Table 1). The study received approval from the local Ethic Committee.
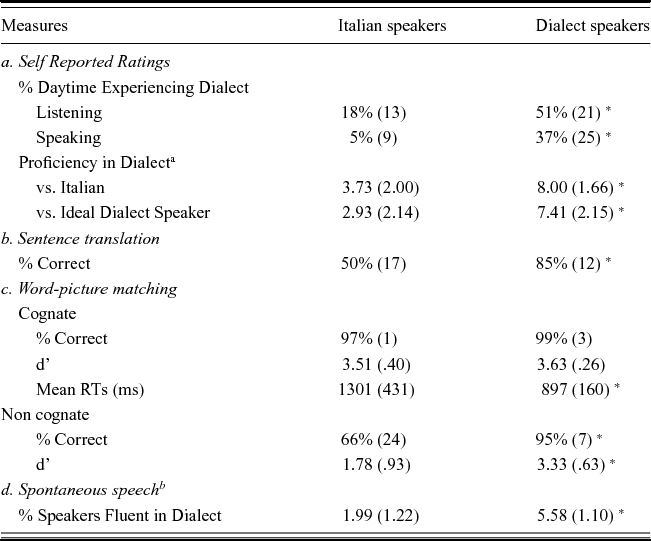
As described below, participants’ judgment on dialect knowledge was confirmed by self-reported ratings and objective proficiency measures (see summary in Table 4).
Tests assessing familiarity with dialect. Means (SD).

a Ratings expressed on 10-point scale (1 = completely different; 10 = entirely comparable).
b Ratings of dialect proficiency (1 = not proficient; 7 = highly proficient). * p < .001.
Measures of proficiency in dialect
(a) Self-reported ratings
The same estimates of dialect daily-use described in Experiment 1 were collected from participants of Experiment 2. D speakers reported that they have spent more time than I speakers listening to Venetian (51% vs. 18% of day-time; t(95) = 9.47, p < .001) or speaking it (37% vs. 5% of day-time; t(95) = 9.43, p < .001). Participants rated their proficiency in Venetian with respect to (a) their proficiency in Italian, and (b) the proficiency of an ideal Venetian speaker. Ratings were expressed on a 10-point scale (1 = “completely different;” 10 = “entirely comparable”). D speakers differed from I speakers in considering their proficiency in Venetian more comparable to Italian (8.0 vs. 3.7; t(95) = 11.46, p < .001) or that of an ideal Venetian speaker (7.4 vs. 2.9; t(95) = 10.18, p < .001).
(b) Sentence translation
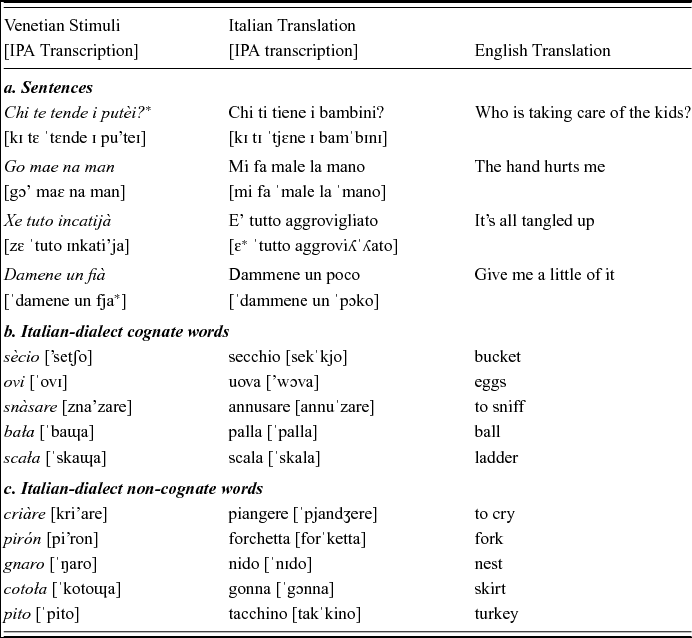
This task provided the first objective measure of comprehension proficiency in Venetian. We recorded 14 short sentences produced by a native speaker of the variant of Venetian spoken in the Padua area. On average, sentences were 4.7 words long (range: 2–7 words), lasting 1.2 s (range: 0.7–2.1). Sentences either comprised colloquial phrases (“He is under the weather”), or referred to familiar events (“Who is taking care of the kids?”). As illustrated by the examples in Table 5, sentences included both cognate and non-cognate Italian–Venetian words. Participants listened to one sentence at a time, and translated it into Italian. Responses were recorded for scoring purposes. D speakers were able to translate more sentences than I speakers (means: 86% vs. 50%; t1(95) = 11.44, p < .001; t2(95) = 9.43, p < .001). The cognates included in the stimuli probably allowed I speakers to grasp the gist of some sentences and therefore reach an accuracy (50%) not ‘at floor.’ The next test was designed to assess whether I speakers’ comprehension of dialect words was primarily restricted to cognates.
Examples of dialect (Venetian) stimuli.

* The orthography used here is standardly adopted in Venetian grammars and dictionaries (Marcato & Ursini, 1998).
(c) Word-picture matching
The second objective task of spoken dialect comprehension required matching a spoken Venetian word to the corresponding picture rather than a foil picture. Words were recorded by a native dialect speaker from Padua. 15 words were Italian–Venetian cognates, while the remaining 17 words were non-cognates (see examples in Table 5). Target and foil pictures were semantically and phonologically unrelated. Pictures were scaled to fit a 250x250 pixels frame and were displayed – randomly, but equally frequently – to the right or left of the fixation point. The distance between a picture midpoint and the fixation point was equal to ~4°. A trial started with the display of the fixation point (500 ms), which was followed by the simultaneous presentation of a spoken word and the pictures. The pictures disappeared as soon as participants responded, or after 3 s. Inter-trial interval was set at 500 ms.
D and I speakers responded significantly more accurately to cognate than non-cognate words (p < .001). I speakers performed particularly poorly with non-cognates words (66% correct; d’ = 1.78) and significantly less accurately than D speakers (95% correct; d’ = 3.33; t(45.29) = 7.71, p < .001). RTs were analyzed for cognates words, to which both groups responded highly accurately (> 97%). D speakers demonstrated faster RTs than I speakers (898 vs. 1301 ms; t(48.08) = 5.71, p < .001). Overall, these results confirmed that I speakers’ comprehension of dialect words was primarily restricted to cognates – though not proficient, as evidenced by their long response latencies. Results also revealed occasional knowledge of non-cognate words, not surprisingly if we consider that I speakers had a few opportunities to hear dialect (they reported hearing dialect an average of 18% of the time).
(d) Spontaneous speech
Participants provided a short (2 m) description in Venetian of what they did the previous day. I speakers were encouraged to try anyhow, and were instructed to use Italian if necessary. Descriptions were recorded for scoring purposes. Dialect proficiency was judged by 4 raters using a 7-point scale (1 = not proficient; 7 = highly proficient). I speakers rarely produced entire sentences in Venetian – more typically, they only produced a handful of Venetian words with a heavy ‘foreign’ accent. I speakers were rated as poorly proficient, while D speakers received high proficiency scores (means: 1.99 vs. 5.58; t(95) = −15.18, p < .001).
Summary
Self-reported ratings and objective measures converged in demonstrating that D and I speakers differed markedly concerning their proficiency in Venetian. D speakers’ knowledge of Venetian was primarily confined to cognate words, allowing them to get at best the gist of sentences spoken in Venetian but insufficient, on the production side, to enable them to sustain even a rudimentary conversation in Venetian. In sum, the data from the various tasks confirmed that I speakers were at best ‘passive carriers’ of a basic dialect lexicon, in this respect differing markedly from D speakers who proficiently used dialect in both comprehension and production.
Flanker Task
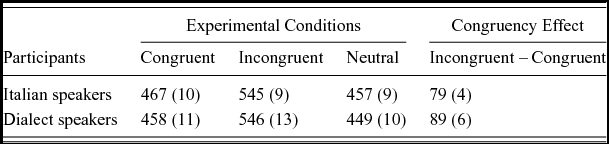
Task procedure and data analyses were as in Experiment 1. Errors and outliers accounted for 1.9% and 2.1% of the responses, respectively (see result summary in Table 6). Correct responses latencies and error rates were entered in a 2 (Stimuli: Congruent vs. Incongruent) x 2 (Speakers: D vs. I) ANOVA. With response latencies, the effect of condition was significant (F(1, 95) = 517.16, MSE = 640.16, p < .001, η2 p = .84), reflecting faster responses to congruent (461 ms, 95% CI [446, 477]) than incongruent stimuli (546 ms, 95% CI [529, 562]). Crucially, neither the main effect of Group (F < 1), nor the interaction (F(1, 95) = 1.86, MSE = 640.16, p = .18, η2 p = .02) reached significance. Parallel results were obtained with errors: a main effect of flanker condition (F(1, 95) = 71.96, p < .001, η2 p = .43), due to more errors with incongruent than congruent stimuli (4.92% vs. 0.3%), but no effect of Group (F < 1) or interaction (F < 1). In short, these results revealed that D and I speakers were similarly affected by the congruency of the stimuli.
Mean RTs (SD) in Flanker Task (Exp. 2).

Further analyses were carried out on the responses latencies and error rates of Block 1 (N = 96), as in some of the prior studies effects of bilingualism appeared especially within initial trials (Bialystok et al., Reference Bialystok, Craik, Klein and Viswanathan2004; Costa et al., Reference Costa, Hernández and Sebastián-Galles2008, Reference Costa, Hernández, Costa-Faidella and Sebastián-Galles2009). The effect of Group and the interaction were not significant (ps > .19), a finding demonstrating no effects of dialect even in the most favorable conditions.
Post-hoc analyses
(a) Subjective vs. objective measures of proficiency
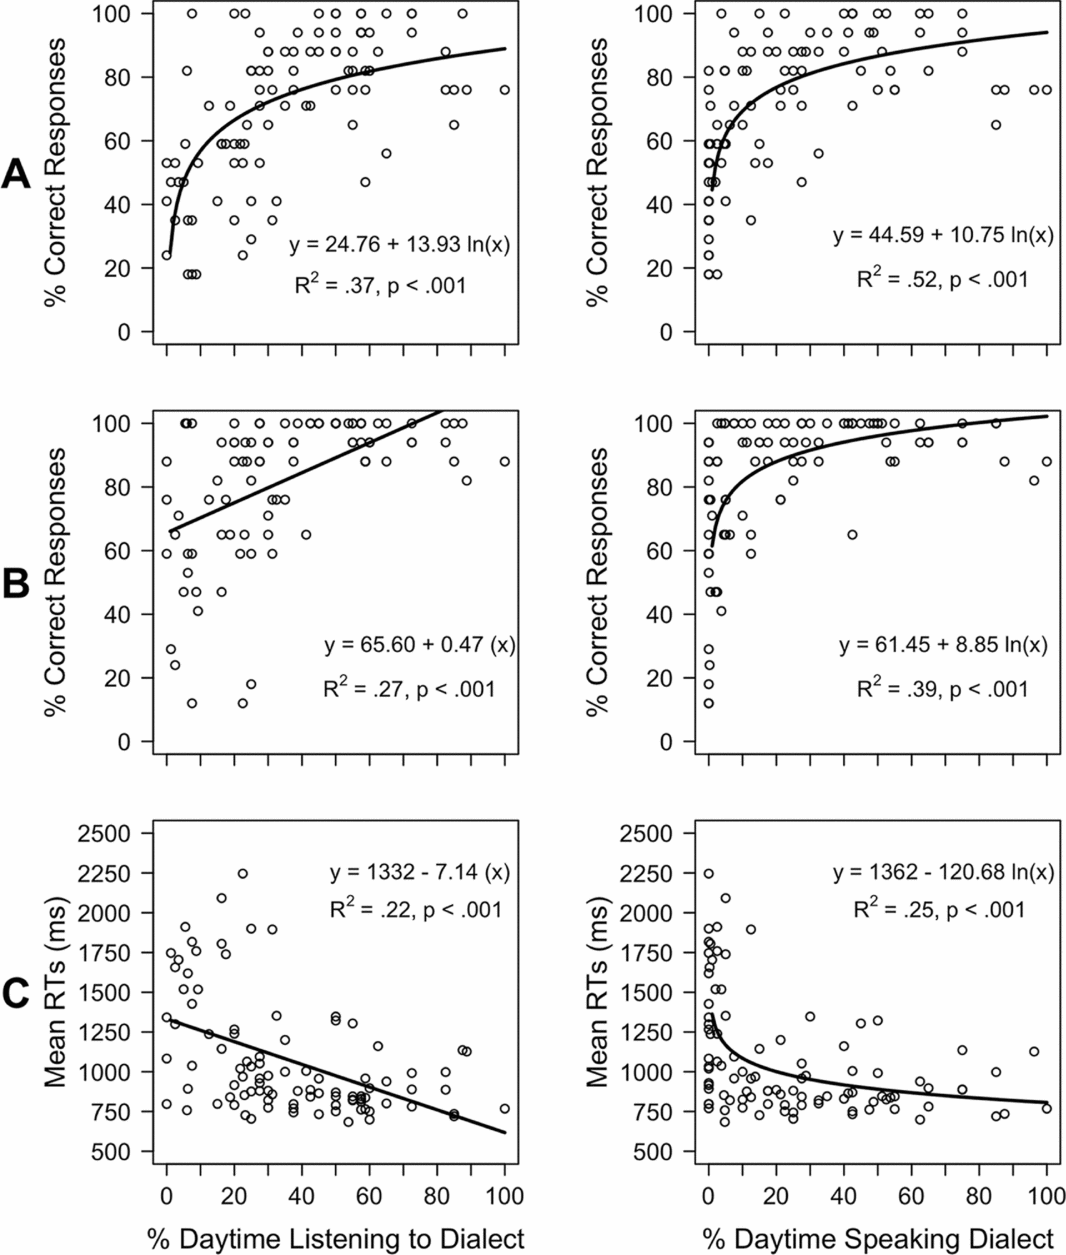
The use, in Experiment 2, of subjective and objective measures of proficiency enabled us to assess whether participants’ self-evaluations were comparably reliable to objective measures of spoken comprehension. Figure 3 displays the number of correct dialect-Italian translations plotted against estimated proportion of daytime spent listening to/speaking in dialect. Data are similarly reported in Figure 3 for correct matches with non-cognate words and for RTs with cognate words. Objective measures were regressed on self-evaluations score. Both linear and logarithmic models were tested, given the apparent non-linear relationship across measures. Self-evaluation scores proved to be significant predictors for all the objective measures of dialect proficiency (see Figure 3). These findings confirm the reliability of the self-ratings we collected, and align with prior findings demonstrating a good concordance between subjective and objective measures of language use (Luo et al., Reference Luo, Luk and Bialystok2010; Marian, Blumenfeld & Kaushanskaya, Reference Marian, Blumenfeld and Kaushanskaya2007).Footnote 1
Responses in tasks assessing proficiency in dialect comprehension (Experiment 2) plotted against subjective ratings of familiarity with dialect (percentage (%) daytime spent listening to dialect (left) or speaking dialect (right)). Dialect sentences correctly translated into Italian (A); Word-picture Matching: correct non-cognate words (B), RTs for cognates (C). Lines represent performance predicted by subjective ratings, estimated using regression procedure. Linear and logarithmic relationships are reported as a function of the results given by a Cox test, where the two relationships were compared. There was a good fit between subjective and objective measures of dialect proficiency.

(b) Flanker Task: Further regression analyses
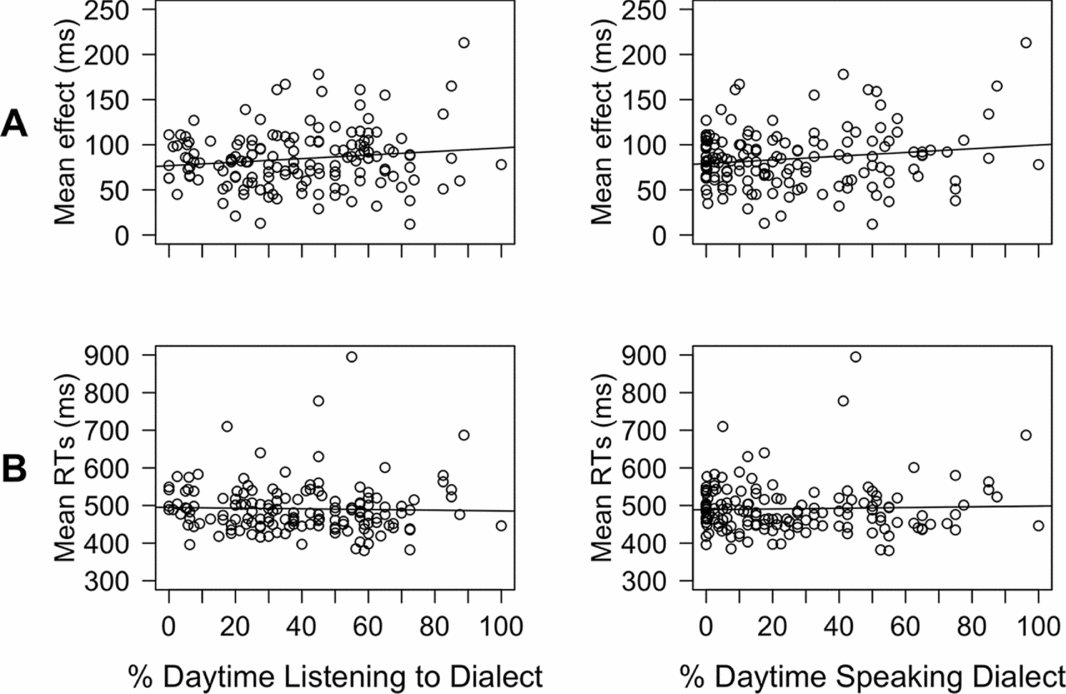
Aggregating the results of the Flanker Task from Experiments 1 and 2, we obtained a large sample of 151 participants varying for their exposure to dialect. Participants’ estimates of dialect exposure – a measure proved to be reliable, as we have seen above – served as predictor of responses in the Flanker Task. Estimated time spent speaking or listening to Venetian failed to reach conventional levels of statistical significance when used as predictors of the flanker congruency effect (speaking estimates: b = 0.20, SE = 0.11, t(150) = 1.94, p = .054; listening estimates: b = 0.20, SE = 0.11, t(150) = 1.71, p = .09; see Fig. 4). If anything, the trend revealed by these results suggests negative effects of dialect instead of beneficial ones. Results were non-significant when we considered overall response latencies (listening estimates: b = −0.10, SE = 0.24, t(150) = −.39, p = .69; speaking estimates: b = 0.10, SE = 0.22, t(150) = .43, p = .67; Fig. 4).
Congruency effect (A) and global RTs (B) in the Flanker Task against percentage (%) daytime spent listening to dialect (left) or speaking dialect (right). Experiments 1 and 2 combined (152 participants). Solid lines represent the relationship amongst variables estimated via linear regression (see text for details). No significant relationships were found.

(c) Language switching naming task
An attempt was made to characterize the mechanisms enabling an efficient executive control on lexical retrieval in proficient Venetian speakers. To this end, we examined the costs associated with language switching in naming, that prior research has shown to depend on language proficiency. In their pioneering study, Meuter and Allport (Reference Meuter and Allport1999) found large costs when switching from L2 to L1 in speakers with greater proficiency in L1 than L2, attributing them to a strong inhibition of L1 when L2 is used (but see Finkbeiner, Gollan & Caramazza, Reference Finkbeiner, Gollan and Caramazza2006, for an alternative account). Critically, this account anticipates similar costs in switching between languages (L1 → L2 vs. L2 → L1) when proficiency in L1 and L2 is comparable, a prediction confirmed with balanced Catalan–Spanish speakers (Costa & Santesteban, Reference Costa and Santesteban2004; Costa, Santesteban & Ivanova, Reference Costa, Santesteban and Ivanova2006). We examined switching costs with our proficient Italian–dialect speakers, anticipating comparable costs in switching between both languages, consistent with their high competence with both languages.
Participants
20 D speakers of Experiment 2 participated in a language-switching naming task. These D-speakers were representative of the participant sample of Experiment 2, being matched for age (z = 1.44, p = .15), education (z = −.77, p = .44), scores in Raven's progressive matrices (z = .67, p = .44), and estimates of daytime spent listening to Venetian (z = .65, p = .52) or speaking it (z = .77, p = .44). Descriptive measures for these 20 participants are presented in Table 3.
Unlike in the seminal experiment of Meuter and Allport (Reference Meuter and Allport1999), we did not show Arabic digits. We reasoned that digits might introduce a confounding, as they have cognate names in Italian and Venetian. We opted instead for pictures of common objects, as in Costa and Santesteban (Reference Costa and Santesteban2004). Fifteen pictures of common objects with non-cognate Italian–Venetian names were selected. Each picture was scaled to fit a 300 x 300 pixels square frame. The color of the frame surrounding the pictures (red or blue) indicated whether Italian or dialect were to be used for naming. The association between colors and languages was counterbalanced across participants. Each picture was shown 20 times, and named equally frequently in Italian and Venetian throughout the 300 trials of the experiment. In 30% of the trials (switch trials), pictures were named in different languages in consecutive trials, while in the remaining 70% of the trials (non-switch trials) language did not change. Pictures were displayed until the onset of a spoken response, and the inter-trial interval was set at 1150 ms. Pictures were pseudo-randomly presented – three intervening trials should separate the repetition of a given picture. During the familiarization that preceded the experiment proper, participants named the pictures both in Italian and Venetian. Stimulus presentation was controlled by DMDX software (Forster & Forster, Reference Forster and Forster2003). CheckVocal software (Protopapas, 2007) was used for response recording, and offline control of response latencies as well as measuring of onset latencies.
Results
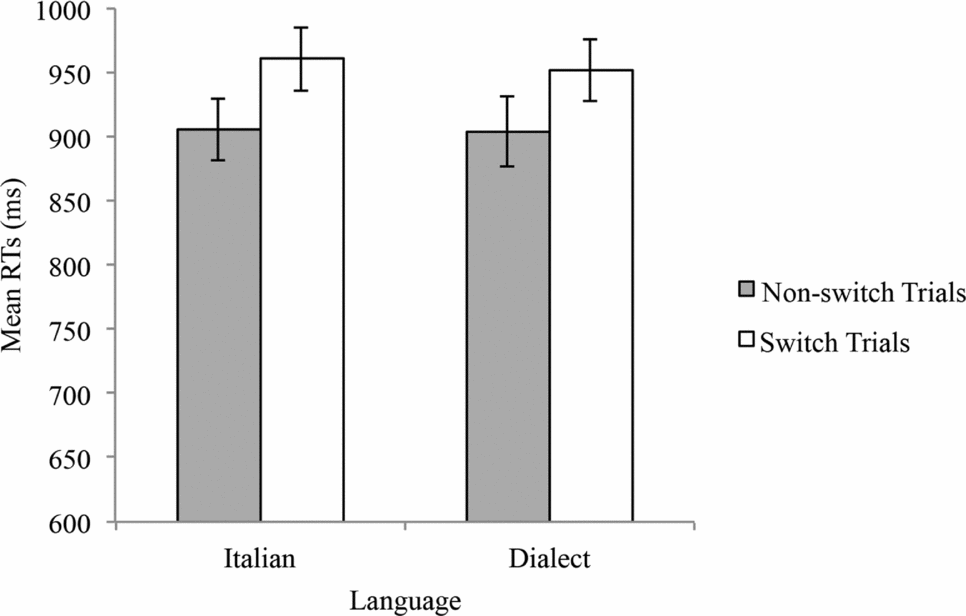
Errors (7.0%) and outliers (1.7%) were removed from analyses. A 2 (Language: Italian vs. Venetian) x 2 (Trial: Switch vs. Non-switch) ANOVA was conducted on RT to correct responses. The main effect of Trial was significant (F(1, 19) = 35.52, p < .001, MSE = 1537.09, η2 p = .65), resulting from slower responses in switch relative to non-switch trials, as shown in Figure 5. The lack of a main effect of Language (F < 1) revealed naming responses comparably fast in Italian and Venetian. Furthermore, the non-significant interaction (F < 1) demonstrated similar costs in Italian (56 ms, 95% CI [27, 85]) and Venetian (48 ms, 95% CI [19, 78]). Together, the latter two results make a strong case that our participants exhibited a level of executive control on language that paralleled the one demonstrated by well-balanced bilinguals (Costa & Santesteban, Reference Costa and Santesteban2004; Costa et al., Reference Costa, Santesteban and Ivanova2006).
Picture-naming responses (RTs) varying for language (Italian vs. dialect) and whether or not language changed between consecutive trials (switch vs. non-switch trials). Error bars represent standard error of the mean. The comparable switching costs in Italian (56 ms) and dialect (48 ms) indicate proficient control in both languages.

General Discussion
The variability of the bilingual experience raises a significant challenge to research on bilingualism, whose most compelling objective becomes describing the sources of such variability. We addressed this question by investigating the role of language switching, adopting a comparative approach in which we contrasted Italian–dialect speakers to Catalan–Spanish speakers. The latter encounter more opportunities of language switching and demonstrated improved cognitive control (Costa et al., Reference Costa, Hernández and Sebastián-Galles2008, Reference Costa, Hernández, Costa-Faidella and Sebastián-Galles2009). No evidence of improved cognitive control appeared with Italian–dialect speakers in the Flanker Task that yielded bilingual facilitation with Catalan–Spanish speakers. Effects of dialect were not observed in Experiment 1, using a design particularly suited to reveal effects of multilingual use graded by familiarity. Nor were effects observed in Experiment 2, where the performance of proficient Italian–dialect speakers was in all respects indistinguishable from that of Italian speakers with limited knowledge of dialect resulting from a primarily passive exposure to a dialect-speaking environment. The contrasting pattern of results observed between these groups of speakers could be explained by differences in language switching, apparently more common in the more fluid, and less rigidly separated linguistic context in which Catalan–Spanish speakers are immersed. If opportunities of language switching represent one of the primary variables driving linguistic effects on executive control, effects should appear with Catalan–Spanish speakers rather than with speakers using Italian dialects in limited contexts. In line with this explanation, it could be proposed that opportunities of language switching might also affect mechanisms of executive control involved in the Stroop Task and the Fluency Task, in which we also failed to observe effects of dialect use (Experiment 1). It should be noted that while Italian–dialect speakers and Catalan–Spanish bilinguals differed for opportunities of language switching, they were equally proficient in both of their languages. Switching costs of comparable magnitude between languages – the hallmark of balanced proficiency – were found with Catalan–Spanish bilinguals (Costa & Santesteban, Reference Costa and Santesteban2004; Costa et al., Reference Costa, Santesteban and Ivanova2006) and replicated with Italian–dialect speakers (Experiment 2). While these results rule out that proficiency could explain the contrasting performance of these two groups of speakers in the Flanker Task, they further suggest that high proficiency is unlikely to be one of the primary sources of the effects of bilingualism on executive control.
As observed by many researchers (e.g., Hilchey & Klein, Reference Hilchey and Klein2011; Kroll & Bialystok, Reference Kroll and Bialystok2013), it could be difficult to demonstrate effects of bilingualism by testing young bilingual adults who are at the peak of their cognitive abilities. In line with this idea, effects of bilingualism on executive functions have been found in populations with reduced cognitive resources relative to young adults, including children (e.g., Carlson & Meltzoff, Reference Carlson and Meltzoff2008; Poarch & van Hell, Reference Poarch and van Hell2012), elderly (Bialystok et al., Reference Bialystok, Craik, Klein and Viswanathan2004, Reference Bialystok, Craik and Ryan2006, Reference Bialystok, Craik and Luk2008a; Salvatierra & Rosselli, Reference Salvatierra and Rosselli2011), and individuals with cognitive deficits induced by dementias (Bialystok et al., Reference Bialystok, Craik, Green and Gollan2009, Reference Bialystok, Craik and Luk2012). These results raise the possibility that effects of dialect use on cognitive processes could be visible especially in these populations. The only study with Italian–dialect children (Lauchlan et al., Reference Lauchlan, Parisi and Fadda2012) confirmed this prediction, and indeed these children outperformed monolingual, Italian speaking children in several tasks, including those tapping executive control. Interestingly, this study also revealed a reduced advantage for Italian–dialect children compared to English–Gaelic children. This asymmetry parallels the discrepancies we found between Italian–dialect adults and Catalan–Spanish adults, and altogether the results from children and young adults suggest a graded effect of bilingualism, possibly modulated by opportunities of language switching. A systematic investigation is needed to characterize the effects of dialect use across the life span, in order to understand whether these effects are consistently reduced as compared to those of bilinguals experiencing more frequent language switching. This is crucial also for determining why we failed to observe effects of dialect use with young adults. Reliable effects at other ages would strongly suggest that effects of dialect use are present in young adults (albeit difficult to detect), rather than completely absent.
The hypothesis that the contrasting findings between Catalan–Spanish bilinguals and Italian–dialect speakers stem from differences in language-switching opportunities provides the basis for potentially explaining other failures to find effects of bilingualisms in tasks related to executive control. Effects might not be visible when frequent opportunities to change from one language to another are lacking, a condition characteristic of bilingual experiences in which each language is typically confined to specific contexts. It is difficult to assess the impact of reduced frequencies of language switching in previous studies, especially because in most of them bilinguals were not homogeneous in terms of spoken language, likely nor for linguistic contexts. Nevertheless, one could reasonably suspect that opportunities of language switching were not very common for some of the participants in bilingual studies conducted in English-speaking countries (e.g., US and UK). Their non-English languages were likely to be acquired from immigrant parents and used especially in the family, but rarely in public contexts. The fact that these are non-dominant languages in public and formal contexts limits not only their use, but also opportunities of mixing them with English. These limitations parallel those experienced by Italian–dialect speakers, and could have weakened the effects of bilingualism on executive control. These considerations are also relevant for interpreting other findings showing no effects of bilingualism (Paap et al., Reference Paap, Johnson and Sawi2014). Far from implying that such effects are non-existent, they suggest that effects are more visible in certain conditions (e.g., when language switching is common, or cognitive resources are reduced).
Like most prior studies on the consequences of bilingualisms on executive control (Kroll & Bialystok, Reference Kroll and Bialystok2013), our investigation is limited in falling short of providing clear answers to the questions about ontogeny of adaptive changes in executive control, and what processes are specifically affected by bilingualism. Despite these limitations, our results underscore the importance of language switching. Furthermore, they suggest a link with executive mechanisms implicated in monitoring the conditions requiring response changes, as well as with mechanisms responsible for implementing efficient response changes. Nevertheless, more specific conclusions can be drawn from our replication of the switching task by Meuter and Allport (Reference Meuter and Allport1999). The ability to change language across naming trials has been viewed as depending on inhibiting one language in order to reduce interference. In addition, comparable switching costs between languages have been regarded as a trademark of high proficiency in both languages (Costa & Santesteban, Reference Costa and Santesteban2004). Switching from Italian to dialect was equally costly as switching from dialect to Italian. These findings replicated those obtained in Catalan–Spanish speakers, who showed comparable costs when switching from Catalan to Spanish, and from Spanish to Catalan. Despite these similarities in switching costs – and allegedly on the functioning of inhibitory mechanisms – Italian–dialect speakers differed from Catalan–Spanish bilinguals for not demonstrating advantages in executive control in the Flanker task. This co-occurrence of converging results (in the switching task) and contrasting results (in the Flanker Task) makes it unlikely that a life-long experience in juggling multiple languages would improve inhibitory mechanisms outside of language tasks. This conclusion converges with other data that appear to rule out effects of bilingualism on inhibitory mechanisms that are part of executive control (Colzato et al., Reference Colzato, Bajo, van den Wildenberg, Paolieri, Nieuwenhuis, La Heij and Hommel2008; Costa et al., Reference Costa, Hernández, Costa-Faidella and Sebastián-Galles2009; Hilchey & Klein, Reference Hilchey and Klein2011). For example, such data were obtained in the Flanker Task. It is difficult to reconcile the finding of bilingual advantage in congruent trials with the hypothesis of improved inhibition – this hypothesis anticipates an advantage in incongruent trials only.
We have assumed that speaking Italian dialects and Italian is in all respects equivalent to speaking two languages (e.g., English–French). Linguists proposed this equivalence primarily on the basis of the intelligibility criterion (Berruto, Reference Berruto, Maiden and Parry1997; Giacalone Ramat, Reference Giacalone Ramat, Milroy and Muysken1995; Mioni & Arnuzzo Lansweert, Reference Mioni and Arnuzzo Lansweert1979; Savoia, Reference Savoia, Maiden and Parry1997), according to which distinct languages are mutually unintelligible. To the extent that Italian dialects and Italian are unintelligible, they should be considered as distinct languages. Our data provide psycholinguistic validity to this claim. The finding that Italian–dialect speakers showed switching costs of comparable magnitude to those of proficient Catalan–Spanish bilinguals suggests strong similarities in the word production mechanisms recruited by dialect speakers and bilinguals. This conclusion could be extended to other dialects that are unintelligible with respect to the ‘standard’ language (e.g., for dialects in Europe, see Auer, Reference Auer, Delbecque, van der Auwera and Geeraerts2005). Although the experiences of dialect speakers and bilinguals demonstrate many similarities, they also differ in noticeable respects. The exclusion from formal settings, and the lack of formal education and a written code are among the primary features making the experience of dialect speakers not just sociolinguistically but possibly also neurocognitively unique. This uniqueness demands that the specifics of dialect experience be carefully considered while investigating the neurocognitive underpinnings of such experience. This point is underscored by our data, which revealed some of the consequences of the lack of language-switching opportunities that characterize dialect use. On the other hand, the uniqueness of the dialect experience could represent an important opportunity for bilingual research. By occupying a distinct region in the multidimensional space representing bilingualism, dialects may provide an interesting case to which other bilingual experiences could be compared. In so doing, we might have a better grasp at how variability in bilingual experience shapes neurocognitive mechanisms – perhaps, the most challenging question that research on bilingualisms is currently facing.
Appendix. Italian dialects: Linguistic and sociolinguistic features
The distinction between language and dialect is notoriously fuzzy (Chambers & Trudgill, Reference Chambers and Trudgill1998) to the extent that what some consider a dialect, others view as a language. Despite these definitional difficulties, dialects typically share some common features, including the lack of an established written tradition and formal linguistic education (Auer, Reference Auer, Delbecque, van der Auwera and Geeraerts2005). This holds true for Italian dialects, a variety of Romance languages each spoken in distinct Italian regions (Giacalone Ramat, Reference Giacalone Ramat, Milroy and Muysken1995; Maiden, Reference Maiden1995; Mioni & Arnuzzo Lansweert, Reference Mioni and Arnuzzo Lansweert1979; Savoia, Reference Savoia, Maiden and Parry1997). Written texts are predominantly in Italian, which is also the subject of formal linguistic education. In part as a consequence of these features, Italian dialects are typically excluded from formal contexts – from schools, to public offices, to public gatherings. Furthermore, their markedly regional distribution prevents them from being used in national media or with people outside of the region, thus limiting their use to spoken conversations with people whose knowledge of dialect is certain or probable.
Modern Italian dialects form a geographical continuum, such that cross-dialect similarities reduce with geographical distance, and dialects from different regions become mutually unintelligible (Berruto, Reference Berruto, Maiden and Parry1997; Maiden Reference Maiden1995; Muljačić, Reference Muljačić, Maiden and Parry1997; Savoia, Reference Savoia, Maiden and Parry1997). Comparable degrees of unintelligibility exist between dialects and Italian, historically based on the Florentine dialect. The structural differences between Italian and dialects have been regarded as similar in scale to those between Italian and other genetically related languages (e.g., Spanish), which led researchers to equate the experience of Italian–dialect speakers to that of bilinguals (Berruto, Reference Berruto, Maiden and Parry1997; Giacalone Ramat, Reference Giacalone Ramat, Milroy and Muysken1995). Differences among dialects, as well as between dialects and Italian, are not limited to the lexicon, expanding to syntax and phonology. This point can be illustrated by comparing Italian and Venetian, the Northeastern dialect spoken in Venice and the nearby region (Ferguson, Reference Ferguson2007; Maiden, Reference Maiden1995; Tuttle, Reference Tuttle, Maiden and Parry1997a) that was examined in the present investigation. Syntactic differences appear with clitics, subordinate clauses, auxiliary verbs, question formation and negation, just to mention a few (Benincà & Cinque, Reference Benincà, Cinque, Benincà, Ledgeway and Vincent2014; Cardinaletti & Ripetti, Reference Cardinaletti, Ripetti, D'Alessandro, Ledgeway and Roberts2010; Cennamo & Sorace, Reference Cennamo, Sorace and Aranovic2007; Maiden, Reference Maiden1995; Poletto, Reference Poletto2000). Their phoneme repertoires differ: the velar nasal consonant /ŋ/ and the lenited l (/ɰ/) occur only in Venetian, while consonant germination appears in Italian but not in Venetian (Giannelli & Cravens, Reference Giannelli, Cravens, Maiden and Parry1997; Maiden, Reference Maiden1995; Tuttle, Reference Tuttle, Maiden and Parry1997a; Reference Tuttle, Maiden and Parry1997b). Further differences relate to phonological grammar, as indicated by phonotactic variations (e.g., only Venetian allows consonants to appear in word ending in a variety of contexts). Non-cognate words, representing the most divergent lexical discrepancies, tend to be more common among words used in familiar, informal settings (Sobrero, Reference Sobrero, Maiden and Parry1997). Words from more formal lexica are generally borrowings from Italian and, like other cognates imported from Italian, are subjected to phonological changes to conform to Venetian phonological grammar (e.g., consonant de-gemination: Italian bɛkko [beak] → Venetian bɛko) (Berruto, Reference Berruto, Auer, Hinskens and Kerswill2005; Sobrero, Reference Sobrero, Maiden and Parry1997). Diachronically, this process of word borrowing and phonological adjustment has permitted a continuous enrichment of the Venetian lexicon. Crucially, it also enables individual speakers to carry out conversations on every topic entirely in Venetian, which in turn engenders an appreciable amount of overlap between Venetian and Italian (Berruto, Reference Berruto, Maiden and Parry1997; Giacalone Ramat, Reference Giacalone Ramat, Milroy and Muysken1995). Diglossia, which implies a dichotomization between high and low language registers (Ferguson, Reference Ferguson1959), has been viewed as inadequate for fully describing this situation. Alternative notions – macrodiglossia (Trumper, Reference Trumper1989), dilalia (Berruto, Reference Berruto, Maiden and Parry1997) – have been proposed to describe the sociolinguistics of Italian–dialect use.
According to the most recent national census (2012; ISTAT, 2014), 39% of 18–24-year-old Italians use dialect in the family, 33% with friends. Outside of the circle of family and friends, however, percentage of dialect use drops substantially (9%) and Italian is normative. The lack of dialect use in more formal contexts was confirmed by ratings we collected from university students (N = 30) who self-reported to be proficient dialect (Venetian) speakers. Asked how often they used dialect in a public office, in class or with lecturers, or when addressing a stranger (“never,” “rarely,” “sometimes,” “often,” or “regularly”) 87% of them indicated “never.” The demographics and characteristics of Italian–dialect use constrain the typology and frequency of language switching (Alfonzetti, Reference Alfonzetti and Auer1998; Berruto, Reference Berruto, Maiden and Parry1997; Giacalone Ramat, Reference Giacalone Ramat, Milroy and Muysken1995). While Italian-to-dialect switching is virtually impossible in settings where only Italian is allowed (e.g., public contexts), it is further limited to circumstances in which interlocutors are dialect speakers, themselves forming a minority linguistic community. An additional limiting factor is that Italian-to-dialect switching typically involves tag switches (deictics, pragmatic locutions, or forms that have penetrated into Italian), which serve stylistic purposes and are primarily used to create contrast (Giacalone Ramat, Reference Giacalone Ramat, Milroy and Muysken1995). On the other hand, dialect-to-Italian switching should not occur frequently either, if dialect use is generally permissible only with other fluent dialect speakers, and dialect can be used in a wide range of topics.