


Heat stress occurs on warm days when a dairy cow’s internal heat production exceeds its heat dissipation capacity, and this can have negative effects on health, welfare, production and fertility (Tao et al., Reference Tao, Monteiro, Thompson, Hayen and Dahl2012, Reference Tao, Rivas, Marins, Chen, Gao and Bernard2020). With the global mean temperature projected to increase by 2.7°C relative to preindustrial levels by 2100, the risk of heat stress to dairy cows is unprecedentedly severe (United Nations Environment Programme, 2021; Rounce et al., Reference Rounce, Hock, Maussion, Hugonnet, Kochtitzky, Huss, Berthier, Brinkerhoff, Compagno and Copland2023). Moreover, high-production dairy cow breeds used for milk production are susceptible to heat stress due to their high metabolic heat production (Hansen, Reference Hansen2007). The heat stress challenge to cattle is widely assessed by using the temperature–humidity index (THI), a combination of ambient temperature and relative humidity. A previous study reported that the daily milk yield and dry matter intake decreased when the daily mean THI exceeded 64 (Ji et al., Reference Ji, Banhazi, Ghahramani, Bowtell, Wang and Li2020). Meanwhile, other studies in dairy cows also indicated that the lying duration, eating time and metabolite plasma concentrations in blood (e.g., dodecanedioic acid, 3-indolepropionic acid and sarcosine) decreased when the daily mean THI exceeded 60 (Hut et al., Reference Hut, Scheurwater, Nielen, Van Den Broek and Hostens2022; Halli et al., Reference Halli, Cohrs, Brügemann, Koch and König2023). These previous studies indicate that, in addition to using weather station data, behavioural measures could also be used to accurately determine whether cows perceive heat stress.
In the past decades, dairy farmers with large herd sizes have adopted sensor systems to help them reduce labour costs and collect more information to support management decisions (Gargiulo et al., Reference Gargiulo, Eastwood, Garcia and Lyons2018). Sensors enable real-time monitoring and recording of individual dairy cow behaviour. Sensors have been used commercially to monitor dairy cow behaviour and provide feedback information for herd and cow management to farmers (Stygar et al., Reference Stygar, Gómez, Berteselli, Dalla Costa, Canali, Niemi, Llonch and Pastell2021). The behavioural changes recorded by sensors and associated with heat stress may serve as indicators for the early and precise detection and ultimately mitigation of heat stress in dairy cows.
Previous studies using sensor data from dairy cows reported that dairy cows adjusted their behaviour to adapt to heat stress. For example, dairy cows spent less time lying and more time standing during heat stress, which can be explained by the fact that standing cows have a larger body surface area to lose heat through air convection (Allen et al., Reference Allen, Hall, Collier and Smith2015; Herbut et al., Reference Herbut, Hoffmann, Angrecka, Godyń, Vieira, Adamczyk and Kupczyński2021). Herbut and Angrecka (Reference Herbut and Angrecka2018b) reported that the daily total lying duration of a dairy herd without pasture access remained approximately 9.9 h/d when the hourly THI exceeded 68 for no more than 3 h/d. When the hourly THI exceeded 68 for more than 3 h/d, the daily total lying duration decreased by 38 min per unit increase in daily mean THI. In addition, the daily total number of steps of dairy cows in herds with and without pasture access both increased during a heat stress period (Heinicke et al., Reference Heinicke, Hoffmann, Ammon, Amon and Amon2018; Edwards et al., Reference Edwards, Krawczel, Dann, Schneider, Whitlock and Proudfoot2020).
The 24-h pattern of behavioural variables measured for specific periods within a day was hypothesized to be informative in reflecting the occurrence of heat stress and may give complementary information to behavioural variables expressed as daily mean values (Kok et al., Reference Kok, Ternman and Thorup2023a). The behavioural pattern of dairy herds follows a 24-h periodicity and stems from circadian rhythm, physiological status and management. The 24-h behavioural pattern refers to the distribution of behaviour across a 24-h cycle from midnight to midnight. Changes in the 24-h behavioural pattern can also reflect deviations in the physiological status of herds and farm management aspects, such as milking system and pasture access (Vitaterna et al., Reference Vitaterna, Takahashi and Turek2001). Most recent studies have indicated that daily behavioural changes have the potential to detect heat stress by comparing the daily total or mean values of lying duration or number of steps of herds with the threshold value or the previous daily rolling value of themselves (Herbut et al., Reference Herbut, Hoffmann, Angrecka, Godyń, Vieira, Adamczyk and Kupczyński2021; Pontiggia et al., Reference Pontiggia, Münger, Eggerschwiler, Holinger, Stucki, Ammer, Bruckmaier, Dohme-Meier and Keil2024). However, limited research has focused on the effects of heat stress on the herd 24-h behavioural patterns or the relationship between heat stress and 24-h pattern behavioural variables derived from specific periods within the 24-h behavioural pattern. Allen et al. (Reference Allen, Hall, Collier and Smith2015) indicated that the hour of the day had an effect on the lying duration and the number of standing bouts of dairy cows under heat stress. Ramón-Moragues et al. (Reference Ramón-Moragues, Carulla, Mínguez, Villagrá and Estellés2021) reported that the dairy herds had higher activity values from morning to afternoon and had lower resting time in the afternoon during heat stress. Therefore, the 24-h pattern behavioural variables based on specific periods within a day could reflect the herd behavioural deviations with greater granularity compared with the daily mean behavioural variables, e.g., lying and activity behaviour of dairy herds may be more pronounced during specific periods within a day rather than a full day. It can be hypothesized that 24-h pattern behavioural variables based on specific periods within a day could be sensitive to increasing daily mean THI and may give complementary information to daily mean behavioural variables based on a full day, and could be further used to optimize the precision of heat stress detection in dairy cows.
The aims of this study were twofold. Firstly, we quantified the daily mean variables and 24-h pattern variables. The 24-h pattern behavioural variables were derived summaries of specific periods within the 24-h behavioural pattern. Secondly, we analysed how the two types of behavioural variables relate to the daily mean THI on days with and without pasture access. For these purposes, correlation analysis and generalized additive mixed model were performed to explore the relationship between behavioural variables of dairy cows and daily mean THI on days with and without pasture access by using accelerometer data from eight dairy farms.
Materials and methods
Accelerometer data were available from eight commercial dairy farms with the consent of the participating farmers. The data were originally collected to study synchrony of behaviour within dairy herds (Kok et al., Reference Kok, van Knegsel, Bokkers, Kemp and Thorup2023b). The enrolment criterion for the participating farms was the willingness of farmers to share the data. Animal ethical approval was not required, as the accelerometers were already fitted to the dairy cows for farm management purposes and not for the purpose of the current observational study.
Farm, sensor and weather data
IceQube accelerometer data (Peacock Technology [formerly IceRobotics], Stirling, UK) were retrieved from eight commercial dairy farms for the entire calendar year 2019, seven farms in the Netherlands with predominantly Holstein Friesian cows and one farm in the UK with Holstein cows (Kok et al., Reference Kok, van Knegsel, Bokkers, Kemp and Thorup2023b). Farmers were interviewed regarding the number of lactating cows, milking system and pasture access (Table 1). All data and farm information were reported in an anonymized interview form. Farms A, B, C, D, E, F and H fed a partial mixed ration at the feed fence, with individual concentrate allowance being fed in separate concentrate feeders in the barn (Farms A, C, D, E, F and H) and/or in the robot (Farms A and B), whereas Farm G fed a total mixed ration. The exact ration composition differed among farms. More information regarding the eight participating farms is shown in Supplementary Table S1, including the number of feeding places and lying places per cow, the number and timing of daily milking, and the bedding material.
The country and identification of the weather station, the number of lactating cows, the number of sensor cows per day, the milking system and whether the farm had pasture access of eight farms

Table 1 Long description
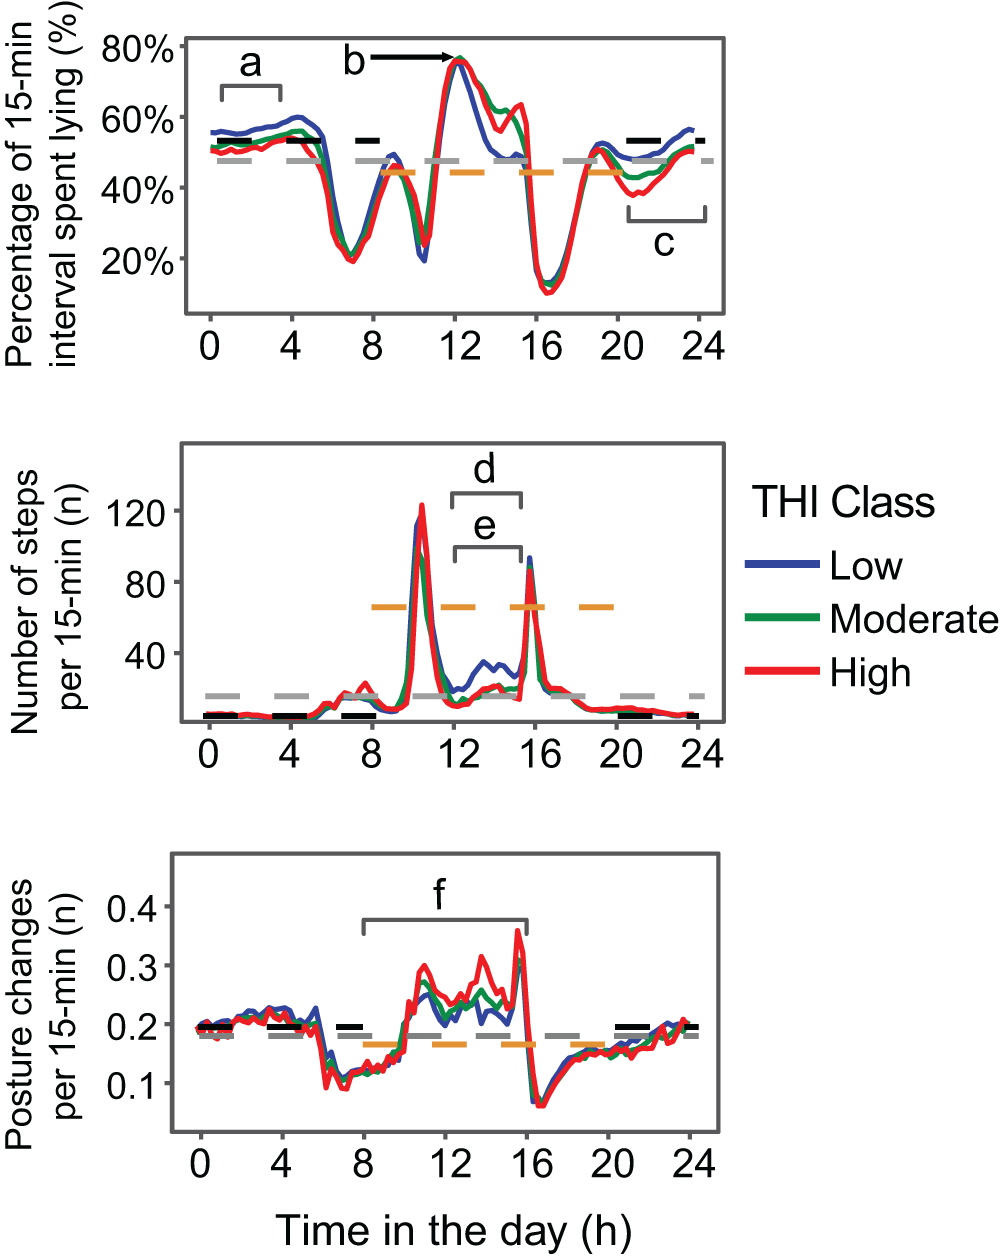
The multi-line graphs illustrate behavioral variables over a 24-hour period for different THI classes: Low, Moderate and High. The x-axis represents time in the day (hours), ranging from 0 to 24. Each panel has a distinct y-axis. The first panel shows the percentage of 15-minute intervals spent lying, ranging from 0 to 80 percent. The second panel displays the number of steps per 15 minutes, ranging from 0 to 120. The third panel indicates posture changes per 15 minutes, ranging from 0 to 0.4. The lines are distinguished by color: blue for Low, green for Moderate and red for High THI classes. In the first panel, the lying percentage peaks around 12 hours for all classes, with the High class showing the highest peak. In the second panel, the number of steps peaks sharply around 12 and 16 hours, with the High class again showing the highest peaks. The third panel shows posture changes peaking around 12 hours, with the High class having the most significant fluctuations. The graphs highlight variations in behavior patterns across different THI classes, indicating increased activity and posture changes in higher THI conditions.
a NL, Netherlands; UK, United Kingdom.
b Sensor cows per day: Mean number of cows equipped with working sensors per day during the period in the analysis after data cleaning (standard deviation in parentheses).
c AMS, automatic milking system; CMS, conventional milking system.
d Pasture access: Yes, Lactating cows in this farm had pasture access during part of a day; No, Lactating cows in this farm did not have pasture access during the entire day.
Accelerometers were attached to a single leg of each cow. Accelerometer data from individual cows were recorded over 15-min time intervals with seven behavioural variables: motion index (overall leg acceleration as measured in three axes), number of steps (n), standing duration (s), lying duration (s), transitions up (number of posture change from lying to standing; n), transitions down (number of posture change from standing to lying down; n) and posture changes (the sum of the number of transition up and transition down; n). For any given 15-min interval, the sum of standing and lying duration was always 900 s (15 min).
The meteorological data, including ambient temperature (°C) and relative humidity (%) per hour per day in 2019, were retrieved from the Dutch National Weather Service (KNMI, 2019) and the British Atmospheric Data Centre website (Met Office, 2023). For the meteorological data of the eight participating farms, the meteorological recordings of the nearest weather station of each farm were used. The distance between the nearest weather station and the eight participating farms ranged from approximately 5 to 12 km.
Data processing
Data were processed using the package ‘dplyr’ in R software (version 4.2.3) (Wickham, Reference Wickham2015; R Core Team, 2021). Firstly, duplicate records in the accelerometer dataset were removed. Secondly, only 15-min interval records in standard format, which started and ended on 0, 15, 30 or 45 min of each hour, were retained. Thirdly, variables in 15-min intervals were aggregated into the daily total level of an individual cow to inspect the reasonability of each calendar day per individual cow. Specifically, the complete 15-min interval records in a calendar day of an individual cow were required to contain 96 15-min interval records, which sum up to 24 h. Meanwhile, calendar days of individual cows with <1 h of lying duration or <1 h of standing time per day, as well as days with 0 number of steps or 0 motion index or >15,000 number of steps per day or >50,000 motion index per day were considered unrealistic and discarded from the dataset (Kok et al., Reference Kok, van Knegsel, Bokkers, Kemp and Thorup2023b). Fourthly, the 15-min interval records of individual cows were aggregated at the herd level. In total, 7.8% of 15-min interval records in the accelerometer dataset were discarded (Supplementary Table S2). The accelerometer data of eight farms were recorded in their respective local time and were not aligned across farms (UTC + 1 for the Dutch farms and UTC + 0 for the British farm), and were not automatically switched to daylight-saving time (UTC + 2 for the Dutch farms and UTC + 1 for the British farm) during daylight-saving time period (from 03.00, 25 March to 03.00, 28 October 2019). In contrast, farmers adhered to local daylight-saving time with milking and feeding management during the daylight-saving period. Therefore, the method described by Kok et al. (Reference Kok, van Knegsel, Bokkers, Kemp and Thorup2023b) was used to adjust the accelerometer data to local daylight-saving time. Specifically, 1 h was added to the 15-min interval records in 00.00–23.00 in the daylight-saving time period, and the 15-min interval records in 23.00–00.00 became the 00.00–01.00 of the same day. Compared with using the 00.00–01.00 records from the next day, this approach avoided causing records to span two incomplete days when there were missing calendar days.
For the meteorological data, the daily mean THI was selected for subsequent analysis because preliminary analysis showed that it was highly correlated (r > 0.8) with the daily highest THI, daily lowest THI, daytime mean THI (06.00–18.00) and night-time mean THI (18.00–06.00) and is widely used as a representative measure of daily thermal load (Herbut et al., Reference Herbut, Hoffmann, Angrecka, Godyń, Vieira, Adamczyk and Kupczyński2021). The daily mean THI of all days in 2019 of the eight farms was calculated as follows (Rowsell, Reference Rowsell1972):
 \begin{align*}{\text{THI}} &= \left( {1.8 \times {\text{AT}} + 32} \right) - \left( 0.55 - 0.0055 \times {\text{RH}}\right) \\ & \quad\times (1.8 \times {\text{AT}} - 26 )\end{align*}
where AT is the ambient temperature (°C), and RH is the relative humidity (%).
Determining pasture access
On six of the eight participating farms (Farms B, C, D, E, F and H), all the lactating cows had access to pasture for some days during the year. Because daily pasture access records were not available, the daily pasture access was inferred based on the histogram of the daily total number of steps of each farm (Supplementary Figure S1). The histograms of six farms with pasture access showed bimodal distributions, and the value of the daily total number of steps at the gap between the two modes was used as a farm-specific threshold to infer daily pasture access. For the six farms, days on which the daily total number of steps exceeded their respective threshold were assumed to have pasture access, whereas the days on which the daily total number of steps was lower than their respective threshold were assumed to have no pasture access. In order to infer whether grazing occurred during the daytime or night-time, the 96 15-min intervals of days with pasture access were divided into daytime and night-time segments. The 15-min intervals between 06.00 and 17.45 were aggregated into the daytime period, while the 15-min intervals between 18.00 and 05.45 were aggregated into the night-time period. The daytime and night-time periods were defined based on the farm management and the day–night rhythm of the eight farms. The daytime period included most daylight hours and all management activities (e.g., milking and grazing), whereas the night-time period was mostly dark and without management events. When the herd number of steps during the daytime period was greater than the herd number of steps during the night-time period, the corresponding day was inferred as with daytime pasture access. Conversely, the calendar day was inferred as with night-time pasture access when the herd number of steps during the daytime period was smaller than the herd number of steps during the night-time period. The daily pasture access of all eight farms in 2019 was visualized in Supplementary Figure S2. The inferred daily pasture access results for the eight farms were validated through their consistency with reported pasture management practices obtained during interviews with farmers: Farms A and G did not have pasture access in the whole year 2019, Farms B, C, D, E, F and H had some days with pasture access and Farms B, E, F and H had days with night-time pasture access. Due to the limited number of herds and days with night-time pasture access, the days with night-time pasture access were not analysed and discussed further.
Extracting and assessing THI-related behavioural variables
The daily mean THI of eight farms in 2019 was visualized in Supplementary Figure S3. The days from April to November of the eight farms were used to assess the relationship between THI and dairy herd behaviours. To extract behavioural variables related to the daily mean THI, the days from April to November 2019 on eight farms were classified into three THI categories: low THI class (THI ≤ 58), moderate THI class (58 < THI < 64) and high THI class (THI ≥ 64). The cut-off value of THI 58 was determined based on the peak in the distribution histogram of the daily mean THI in the current study (Supplementary Figure S4), while another cut-off value of THI 64 was adopted from a previous study conducted on Dutch commercial dairy farms with a similar regional climate (Hut et al., Reference Hut, Scheurwater, Nielen, Van Den Broek and Hostens2022). The categorization of daily mean THI was only used to extract THI-related behavioural variables for the subsequent analysis.
Two types of behavioural variables were extracted: daily mean variables and 24-h pattern variables (Table 2). The 24-h pattern variables were derived summaries of specific periods within the 24-h behavioural pattern and described the behaviour of the dairy herd based on specific periods within a day, e.g., the mean lying duration per 15-min interval from 06.00 to 18.00. The daily mean behavioural variables described the behaviour of the dairy herd over a full day, e.g., the mean lying duration per 15 min interval for the entire day. The 24-h pattern variables were developed following an explorative analysis, in which the 24-h herd behavioural patterns of lying duration, number of steps and posture changes were visualized per THI category per farm for days with and without pasture access to screen variables within a day that could be sensitive to THI (Supplementary Figures S5–S10). All behavioural variables are presented on a 15-min interval basis based on the data format recorded by the sensor. The figures of herd 24-h lying duration, number of steps and number of posture change patterns per THI category on days with pasture access of farm C were plotted to illustrate the definitions of extracted variables (Fig. 1).
The definitions of extracted daily mean variables and 24-h pattern variables

Illustration of extracted behavioural variables. Example figures illustrate the mean lying duration 00–03 (a), daily max lying duration (b), mean lying duration 20–24 (c), mean number of steps 12–15 (d), number of steps SD 12–15 (e) and mean posture changes 08–16 (f) based on the 24-h lying, steps and posture change pattern per THI class on days with daytime pasture access of Farm C. The grey dashed lines in the figures respectively represent the daily mean lying duration, the daily mean number of steps and the daily mean number of posture changes. The orange dashed lines in the figures respectively represent the daytime mean lying duration, daytime mean number of steps and daytime mean number of posture changes. The black dashed lines in the figures respectively represent the night-time mean lying duration, night-time mean number of steps and night-time mean number of posture changes.

To assess the correlation between extracted behavioural variables and the daily mean THI, Spearman’s correlations were performed on days per farm on days with pasture access and days without pasture access separately. Next, Spearman’s correlation coefficients (r) between behavioural variables and daily mean THI were visualized in a heatmap on the days with daytime pasture access of Farms B, C, D, E, F and H and days without pasture access of Farms A, C, D and G.
Modelling the effects of daily mean THI on dairy cows
To relate the daily mean THI, farm and pasture access with each extracted behavioural variable, a generalized additive mixed model was used:
 \begin{align*}{\text{Model: }}{Y_{ijk}} & = \beta + {s_{Pasture{\text{ }}access}}(TH{I_{ijk}}) + Pasture{\text{ }}acces{s_i} + Far{m_j} \\ &\quad + {\left( {Farm \times Pasture{\text{ }}access} \right)_{ij}} + {\varepsilon _{ijk}}\end{align*}
where  ${Y_{ijk}}$ represents the behavioural variables of Farmj on Dayk,
 ${s_{Pasture{\text{ }}access}}(TH{I_{ijk}})$ represents the smooth term of the daily mean THI (31.5–76.8) which was allowed by
 $Pasture{\text{ }}acces{s_i}$ (i = Pasture access or No pasture access) to have a different smooth curve on days with pasture access and without pasture access,
 ${\text{Far}}{{\text{m}}_j}$represents the random effect of farm and
 $Pasture{\text{ }}acces{s_i}$represents a fixed effect that if the Dayk of Farmj had pasture access (i = Pasture access or No pasture access). The
 ${\left( {Farm \times Pasture{\text{ }}access} \right)_{ij}}$ represents the interaction effect of farm and pasture access. The residuals
 ${\varepsilon _{ijk}}$ were found to be temporally autocorrelated with respect to Farmj and Dayk based on the autocorrelation function plots of fitted models. To account for autocorrelation in the residuals, an autoregressive moving average correlation structure within each farm was included in the model, where p = 1 and q = 1 were chosen based on the autocorrelation function plots. The identity link was used in the model to relate estimates of the model to actual values of behavioural variables. The normality of model residuals was assessed by visual inspection of quantile–quantile plots of the fitted models. The adequacy of the basis dimension was assessed using the k-index, with k-index values close to or greater than 1 and P > 0.05 indicating that the selected number of basis dimensions (10 in this study) was sufficient.
The generalized additive mixed model and statistics were carried out using the package ‘mgcv’ in R (Wood, Reference Wood2011). The Smooth functions were constructed with thin plate splines, and variance components and random effects were estimated with maximum likelihood. A P-value of <0.05 was considered statistically significant.
Determining the changes in behavioural variables with increasing daily mean THI
The significant changes in the extracted behavioural variables with increasing daily mean THI were identified based on the fitted generalized additive mixed models. Briefly, the marginal change in the behavioural variables related to the daily mean THI and its 95% confidence intervals were calculated as the first derivative of the smooth curve and its 95% confidence intervals. For each behavioural variable, the daily mean THI range with significant behavioural change was defined as daily mean THI values where the marginal change and its 95% confidence intervals did not include zero (Serviento et al., Reference Serviento, He, Ma, Räisänen and Niu2024). We estimated the change of behavioural variables as the daily mean THI increased from value a to b by assuming a linear relationship. The mean rate of change of behavioural variables in the daily mean THI range with significant behavioural change, represented by the slope  $({\bar k_{a,b}})$, was then computed using the method described by Souza et al. (Reference Souza, Moraes, Santos, Baumgard, Mueller and Kebreab2023):
 \begin{equation*}({\bar k_{a,b}}) = \frac{{s\left( b \right) - s\left( a \right)}}{{b - a}}\end{equation*}
where  $s\left( a \right)$ and
 $s\left( b \right)$ represent the estimated effect of the smooth function of the daily mean THI on behavioural variables of dairy herds on days with or without pasture access in the generalized additive mixed model.
The simultaneous marginal change and its 95% confidence intervals in the behavioural variables related to the daily mean THI were calculated using the derivatives function of the package ‘gratia’ in R (Simpson, Reference Simpson2023). All figures were produced using the package ‘ggplot2’ in R (Wickham, Reference Wickham2016).
Results
Twenty-four-hour pattern and daily mean behavioural variables in correlation with THI
All extracted behavioural variables had a significant correlation with daily mean THI on at least one farm (Fig. 2). For the 24-h pattern variables, the correlations with daily mean THI were present and consistent in direction across all farms for the mean lying 20–24, mean steps 12–15, mean steps SD 12–15, daytime posture changes and mean posture changes 08–16 on days with pasture access. The correlations with daily mean THI were present and consistent in direction across all farms for the night-time mean lying on both days with and without pasture access. In the lying duration-related variables, the night-time mean lying had a negative correlation with daily mean THI across farms on both days with pasture access and days without pasture access (r values ranging from −0.30 to −0.71 and −0.23 to −0.88, respectively). The mean lying 20–24 had a negative correlation with daily mean THI across farms on days with pasture access (r ranging from −0.32 to −0.65), but this correlation was not consistent across farms on days without pasture access. In the number of steps-related variables, the mean steps 12–15 and mean steps SD 12–15 were negatively correlated with daily mean THI across farms on days with pasture access (r ranging from −0.28 to −0.55 and from −0.29 to −0.70, respectively), but these correlations were not consistent across farms on days without pasture access. In the number of posture change-related variables, the daytime posture changes and mean posture changes 08–16 had a positive correlation with daily mean THI across farms on days with pasture access (r ranging from 0.23 to 0.44 and from 0.25 to 0.45, respectively), but these correlations were not consistent across farms on days without pasture access. For the daily mean variables, the correlation between the daily mean lying and the daily mean THI was present and consistent in a positive direction across all farms on days without pasture (r ranging from 0.27 to 0.85), but this correlation was not consistent on days with pasture access. The correlations of daily max lying, daily min lying, daily mean steps, daily max steps and daily mean posture changes with the daily mean THI were not significant or did not have the same direction across all farms on days without and with pasture access.
The heatmap of Spearman’s correlation coefficient between extracted behavioural variables and daily mean THI of days with pasture access of Farms B, C, D, E, F and H and days without pasture access of Farms A, C, D and G. The colour of the squares represents the correlation coefficient between extracted variables and the daily mean THI. Black asterisks denote significant correlations (*P < 0.05, **P < 0.01). Variables shown in regular font represent 24-h pattern variables, whereas variables shown in italics represent daily mean variables.

Figure 2 Long description
Heat map showing Spearman′s correlation coefficients between behavioural variables and daily mean THI, divided into groups with and without pasture access. Row labels include daily mean lying, daily max lying, daily min lying, daytime mean lying, nighttime mean lying, max lying 06 to 18, mean lying 00 to 03, mean lying 20 to 24, daily mean steps, daily max steps, daytime mean steps, nighttime mean steps, mean steps 12 to 15, mean steps SD 12 to 15, daily mean posture changes, daytime posture changes, nighttime posture changes and mean posture changes 08 to 16. Columns are labeled by farms: With pasture access includes Farms B, C, D, E, F, H; Without pasture access includes Farms A, C, D, G. The color scale ranges from negative one to one, with red indicating positive correlation, blue indicating negative correlation and white representing neutral or zero correlation. Darker shades represent stronger correlations. Black asterisks denote significant correlations, with single asterisk for p less than 0.05 and double asterisk for p less than 0.01. Key patterns: Lying measures generally show negative correlations with THI across both groups, particularly nighttime mean lying. Posture changes tend to have positive correlations, especially during daytime with pasture access. Notable exceptions include Farm D′s daily max lying with pasture access showing a strong positive correlation. Comparison: Both groups exhibit similar trends, but correlations are generally stronger with pasture access, especially for posture changes and steps. Significant correlations are more frequent in the with pasture access group.
Twenty-four-hour pattern and daily mean behavioural variables in generalized additive mixed model
Most behavioural variables had a nonlinear relationship with increasing daily mean THI in the generalized additive mixed model. The lying duration-related variables generally showed a decreasing trend with increasing daily mean THI in the generalized additive mixed models (Fig. 3). For the lying duration-related variables, the daily mean lying, daytime mean lying, night-time mean lying, mean lying 00–03 and mean lying 20–24 decreased with increasing daily mean THI for part of the daily mean THI range on both days with and without pasture access. The daily max lying and max lying 06–18 decreased with increasing daily mean THI for part of the daily mean THI range on days with pasture access, but not on days without pasture access. In the number of steps-related variables, the daily mean steps, daytime mean steps, mean steps 12–15 and mean steps SD 12–15 decreased significantly with increasing daily mean THI for part of the daily mean THI range on days with pasture access, but not on days without pasture access (Fig. 4). The night-time mean steps increased significantly with increasing daily mean THI for part of the daily mean THI range on days with pasture access, but not on days without pasture access. For the number of posture change-related variables, the mean posture changes 08–16 increased significantly with increasing daily mean THI for part of the daily mean THI range on both days with and without pasture access (Fig. 5). The daily mean posture changes, daytime posture changes and night-time posture changes increased significantly with increasing daily mean THI for part of the daily mean THI range on days with pasture access, but not on days without pasture access. The pointwise relationship between the daily mean THI and extracted behavioural variables and identified daily mean THI ranges with significant behavioural change, and their estimated linear slopes in the fitted models are provided in Tables S3a–S5. For the lying duration-related variables, the daily mean THI ranges with significant behavioural change were widest for mean lying 20–24 (54.7–76.8) on days with pasture access and for the mean lying 00–03 (31.5–76.8) on days without pasture access. For the number of steps-related variables, the daily mean THI ranges with significant behavioural change were widest for the daytime mean steps (31.5–76.8) and mean steps 12–15 (31.5–76.8) on days with pasture access. For the number of posture change-related variables, the daily mean THI ranges with significant behavioural change were widest for the daily mean posture changes (31.5–76.8), daytime posture changes (31.5–76.8) and night-time posture changes (31.5–76.8) on days with pasture access and for mean posture changes 08–16 (63.8–71.1) on days without pasture access.
Relation between daily mean THI and lying duration-related behavioural variables (s/15-min) for dairy herds on days with and without pasture access. The black dashed lines represent the 95% confidence interval for each point of the smooth function, and the vertical lines along the bottom of each plot show the values of the covariate in each smooth, visually representing its distribution. The daily mean THI range between the two black vertical shaded lines represents the range of THI with significant behavioural changes. The values of k represent the effective degrees of freedom in the smooth term. Variables shown in regular font represent 24-h pattern variables, whereas variables shown in italics represent daily mean variables.

Figure 3 Long description
The multi-line graphs illustrate the relationship between daily mean THI (Temperature Humidity Index) and lying duration-related behavioral variables for dairy herds, comparing days with and without pasture access. The x-axis represents daily mean THI, ranging from 30 to 80. The y-axis represents the smooth function of lying duration in seconds per 15 minutes. Each panel shows different lying duration variables: daily mean lying, daily max lying, daily min lying, daytime mean lying, nighttime mean lying, max lying 06-18, mean lying 00-03 and mean lying 20-24. The graphs include solid lines representing the smooth function and dashed lines indicating the 95 percent confidence intervals. Vertical dashed lines mark the range of THI with significant behavioral changes. The effective degrees of freedom for the smooth term are indicated by ′k′ values in each panel. The graphs show a general trend of decreasing lying duration with increasing THI, with variations between pasture and no pasture conditions. Notable changes occur where curves bend or drop sharply, indicating significant behavioral shifts.
Relation between daily mean THI and number of steps-related behavioural variables (n/15-min) for dairy herds on days with and without pasture access. The black dashed lines represent the 95% confidence interval for each point of the smooth function, and the vertical lines along the bottom of each plot show the values of the covariate in each smooth, visually representing its distribution. The daily mean THI range between the two black vertical shaded lines represents the range of THI with significant behavioural changes. The values of k represent the effective degrees of freedom in the smooth term. Variables shown in regular font represent 24-h pattern variables, whereas variables shown in italics represent daily mean variables.

Figure 4 Long description
Pasture access and pasture access are shown as separate plots for each variable. Daily mean steps: Horizontal axis label Daily mean THI. Vertical axis label s(Daily mean THI), step. Horizontal axis tick labels 30, 40, 50, 60, 70. Vertical axis tick labels minus 2, 0, 2, 4. Plot text k equals 1 in the no pasture access plot and k equals 2.2 in the pasture access plot. The solid curve is near 0 across the range in the no pasture access plot. In the pasture access plot, the solid curve slopes downward from about 4 at Daily mean THI 30 to about minus 2 at Daily mean THI 75. Two vertical dashed lines are shown near Daily mean THI 45 and 60. Daily max steps: Horizontal axis label Daily mean THI. Vertical axis label s(Daily mean THI), step. Horizontal axis tick labels 30, 40, 50, 60, 70. Vertical axis tick labels minus 20, 0, 20. Plot text k equals 1 in the no pasture access plot and k equals 2.5 in the pasture access plot. In the no pasture access plot, the solid curve is near 0 across the range. In the pasture access plot, the solid curve is below 0 near Daily mean THI 30, rises above 0 around Daily mean THI 55 to 65, then drops to about minus 20 near Daily mean THI 75. Daytime mean steps: Horizontal axis label Daily mean THI. Vertical axis label s(Daily mean THI), step. Horizontal axis tick labels 30, 40, 50, 60, 70. Vertical axis tick labels minus 4, 0, 4, 8. Plot text k equals 1 in both plots. In the no pasture access plot, the solid curve is near 0 across the range. In the pasture access plot, the solid curve slopes downward from about 8 at Daily mean THI 30 to about minus 4 at Daily mean THI 75. Two vertical dashed lines are shown near Daily mean THI 30 and 75. Nighttime mean steps: Horizontal axis label Daily mean THI. Vertical axis label s(Daily mean THI), step. Horizontal axis tick labels 30, 40, 50, 60, 70. Vertical axis tick labels minus 1, 0, 1, 2, 3. Plot text k equals 1 in the no pasture access plot and k equals 4.3 in the pasture access plot. In the no pasture access plot, the solid curve is near 0 across the range. In the pasture access plot, the solid curve stays near 0 up to about Daily mean THI 60, then rises to about 3 near Daily mean THI 75. Two vertical dashed lines are shown near Daily mean THI 65 and 75. Mean steps 12 dash 15: Horizontal axis label Daily mean THI. Vertical axis label s(Daily mean THI), step. Horizontal axis tick labels 30, 40, 50, 60, 70. Vertical axis tick labels minus 10, 0, 10, 20. Plot text k equals 1 in both plots. In the no pasture access plot, the solid curve is near 0 across the range. In the pasture access plot, the solid curve slopes downward from about 20 at Daily mean THI 30 to about minus 10 at Daily mean THI 75. Two vertical dashed lines are shown near Daily mean THI 30 and 75. Mean steps SD 12 dash 15: Horizontal axis label Daily mean THI. Vertical axis label s(Daily mean THI), step. Horizontal axis tick labels 30, 40, 50, 60, 70. Vertical axis tick labels minus 10, 0, 10. Plot text k equals 1.8 in the no pasture access plot and k equals 2.1 in the pasture access plot. In the no pasture access plot, the solid curve is near 0 across the range. In the pasture access plot, the solid curve slopes downward from about 10 at Daily mean THI 30 to about minus 10 at Daily mean THI 75. Two vertical dashed lines are shown near Daily mean THI 40 and 75.
Relation between daily mean THI and number of posture change-related behavioural variables (n/15-min) for dairy herds on days with and without pasture access. The black dashed lines represent the 95% confidence interval for each point of the smooth function, and the vertical lines along the bottom of each plot show the values of the covariate in each smooth, visually representing its distribution. The daily mean THI range between the two black vertical shaded lines represents the range of THI with significant behavioural changes. The values of k represent the effective degrees of freedom in the smooth term. Variables shown in regular font represent 24-h pattern variables, whereas variables shown in italics represent daily mean variables.

Figure 5 Long description
Daily mean posture changes. No pasture access. The x-axis is labeled Daily mean THI, ranging from 30 to 75 with labeled ticks at 30, 40, 50, 60, 70. The y-axis is labeled s(Daily mean THI),n, ranging from minus 0.02 to 0.01 with labeled ticks at minus 0.02, minus 0.01, 0, 0.01. Text inside the plot reads k equals 2.8. One solid curve and two dashed curves are shown. The solid curve is near minus 0.005 at Daily mean THI 30, near minus 0.003 at 40, near minus 0.002 at 50, near 0 at 60 and near 0.01 at 75. Daily mean posture changes. Pasture access. The x-axis is labeled Daily mean THI, ranging from 30 to 75 with labeled ticks at 30, 40, 50, 60, 70. The y-axis is labeled s(Daily mean THI),n, ranging from minus 0.02 to 0.01 with labeled ticks at minus 0.02, minus 0.01, 0, 0.01. Text inside the plot reads k equals 1. One solid curve and two dashed curves are shown. Two vertical dashed lines appear near Daily mean THI 30 and near Daily mean THI 75. The solid curve rises approximately linearly from about minus 0.02 at Daily mean THI 30 to about 0.01 at Daily mean THI 75. Daytime posture changes. No pasture access. The x-axis is labeled Daily mean THI, ranging from 30 to 75 with labeled ticks at 30, 40, 50, 60, 70. The y-axis is labeled s(Daily mean THI),n, ranging from minus 0.02 to 0.02 with labeled ticks at minus 0.02, minus 0.01, 0, 0.01, 0.02. Text inside the plot reads k equals 2.4. One solid curve and two dashed curves are shown. The solid curve is near minus 0.01 at Daily mean THI 30, near minus 0.006 at 40, near minus 0.004 at 50, near 0 at 60 and near 0.015 at 75. Daytime posture changes. Pasture access. The x-axis is labeled Daily mean THI, ranging from 30 to 75 with labeled ticks at 30, 40, 50, 60, 70. The y-axis is labeled s(Daily mean THI),n, ranging from minus 0.02 to 0.02 with labeled ticks at minus 0.02, minus 0.01, 0, 0.01, 0.02. Text inside the plot reads k equals 1.56. One solid curve and two dashed curves are shown. Two vertical dashed lines appear near Daily mean THI 30 and near Daily mean THI 75. The solid curve rises approximately linearly from about minus 0.02 at Daily mean THI 30 to about 0.02 at Daily mean THI 75. Nighttime posture changes. No pasture access. The x-axis is labeled Daily mean THI, ranging from 30 to 75 with labeled ticks at 30, 40, 50, 60, 70. The y-axis is labeled s(Daily mean THI),n, ranging from minus 0.010 to 0.010 with labeled ticks at minus 0.010, minus 0.005, 0, 0.005, 0.010. Text inside the plot reads k equals 1.5. One solid curve and two dashed curves are shown. The solid curve is near minus 0.003 at Daily mean THI 30, near minus 0.002 at 40, near minus 0.001 at 50, near 0 at 60 and near 0.004 at 75. Nighttime posture changes. Pasture access. The x-axis is labeled Daily mean THI, ranging from 30 to 75 with labeled ticks at 30, 40, 50, 60, 70. The y-axis is labeled s(Daily mean THI),n, ranging from minus 0.010 to 0.010 with labeled ticks at minus 0.010, minus 0.005, 0, 0.005, 0.010. Text inside the plot reads k equals 1. One solid curve and two dashed curves are shown. Two vertical dashed lines appear near Daily mean THI 30 and near Daily mean THI 75. The solid curve rises approximately linearly from about minus 0.010 at Daily mean THI 30 to about 0.008 at Daily mean THI 75. Mean posture changes 08-16. No pasture access. The x-axis is labeled Daily mean THI, ranging from 30 to 75 with labeled ticks at 30, 40, 50, 60, 70. The y-axis is labeled s(Daily mean THI),n, ranging from minus 0.04 to 0.02 with labeled ticks at minus 0.04, minus 0.02, 0, 0.02. Text inside the plot reads k equals 2.6. One solid curve and two dashed curves are shown. Two vertical dashed lines appear near Daily mean THI about 65 and about 72. The solid curve is near minus 0.01 at Daily mean THI 30, near minus 0.008 at 40, near minus 0.006 at 50, near 0 at 60, near 0.01 at 70 and near 0.02 at 75. Mean posture changes 08-16. Pasture access. The x-axis is labeled Daily mean THI, ranging from 30 to 75 with labeled ticks at 30, 40, 50, 60, 70. The y-axis is labeled s(Daily mean THI),n, ranging from minus 0.04 to 0.02 with labeled ticks at minus 0.04, minus 0.02, 0, 0.02. Text inside the plot reads k equals 3.7. One solid curve and two dashed curves are shown. Two vertical dashed lines appear near Daily mean THI about 45 and about 70. The solid curve is near minus 0.03 at Daily mean THI 30, near minus 0.02 at 40, near minus 0.01 at 50, near 0 at 60, near 0.015 at 70 and near 0.02 at 75.
Discussion
The aims of this study were twofold. Firstly, we quantified the daily mean variables and 24-h pattern variables. The 24-h pattern behavioural variables were derived summaries of specific periods within the 24-h behavioural pattern. Secondly, we analysed how the 2 types of behavioural variables relate to the daily mean THI on days with and without pasture access. The 24-h pattern variables and daily mean behavioural variables were extracted, and their relationships with the daily mean THI were evaluated based on correlation analysis and a generalized additive mixed model. Most behavioural variables had a nonlinear relationship with the daily mean THI in the generalized additive mixed model. Earlier studies also reported the nonlinear relationship between the changes in the behaviour and physiological responses of dairy cows and THI (Allen et al., Reference Allen, Hall, Collier and Smith2015; Shu et al., Reference Shu, Li, Bindelle, Jin, Fang, Xing, Guo and Wang2023b; Ferrari et al., Reference Ferrari, Evangelista, Basiricò, Castellani, Biffani and Bernabucci2025). The behaviour of dairy cows generally remains stable within the thermoneutral zone, but starts to change once the daily mean THI exceeds a certain threshold, resulting in a nonlinear relationship with increasing THI (Herbut et al., Reference Herbut, Hoffmann, Angrecka, Godyń, Vieira, Adamczyk and Kupczyński2021).
Difference between 24-h pattern and daily mean behavioural variables
The results of the present study showed that some of the 24-h pattern variables, e.g., night-time mean lying, mean lying 20–24, mean steps 12–15, mean steps SD 12–15, mean posture changes 08–16 and daytime posture changes, had a consistent direction of correlation with daily mean THI across farms, whereas their corresponding daily mean variables did not. This indicates that these 24-h pattern variables are likely more sensitive for the detection of heat stress across farms compared with the daily mean behavioural variables. Other studies have also focused on heat stress-related 24-h pattern variables based on specific periods within a day and reported that changes in dairy cows’ lying duration, drinking and eating during the night-time and afternoon were more pronounced than changes in daily total behaviour as THI increased (Herbut and Angrecka, Reference Herbut and Angrecka2018a; Leliveld et al., Reference Leliveld, Riva, Mattachini, Finzi, Lovarelli and Provolo2022; Shu et al., Reference Shu, Bindelle, Guo and Gu2023a). Similarly, the present study showed that the mean lying duration of dairy herds in the night-time from 18.00 to 06.00 had a consistently negative correlation with daily mean THI across farms on both days with pasture access and days without pasture access. One possible reason why the decrease in lying duration was more pronounced at night-time than over the full day or during daytime is that dairy cows generally spent more time lying at night-time compared with the full day and daytime (296 s/15 min vs. 255 s/15 min and 218 s/15 min in this study). Meanwhile, as feeding and milking management are concentrated during the daytime, dairy herds tend to show more voluntary behavioural changes during night-time to cope with increasing THI (Schütz et al., Reference Schütz, Cox, Cave, Huddart and Tucker2023). Similar to lying behaviour, the mean number of steps from 12.00 to 15.00 decreased with increasing daily mean THI, and the mean number of posture changes from 06.00 to 18.00 and from 08.00 to 16.00 increased with increasing daily mean THI across all farms on days with pasture access. In contrast, the daily mean number of steps and the daily number of posture changes did not show a consistent direction of correlation with the daily mean THI across all farms. The changes in lying duration, number of steps and number of posture change behaviour of dairy herds in response to increasing daily mean THI are more consistent in specific periods within a day instead of a full day, which could be used to optimize the early detection of heat stress across farms. In addition, in the generalized additive mixed model, some of the 24-h pattern variables exhibited wider ranges in the daily mean THI ranges with significant behavioural change than their corresponding daily mean variables, indicating some of the 24-h pattern variables were sensitive to the increasing daily mean THI. The results in this study indicate that behavioural responses to THI depend on how behaviour is summarized. Specifically, some 24-h pattern variables highlight behavioural changes with increasing daily mean THI that are not evident in daily mean variables. Therefore, 24-h pattern variables can provide additional or complementary insight into behavioural responses to increasing daily mean THI and may be expected to complement daily mean variables to improve the detection of heat stress in dairy cows.
Effect of pasture access on behaviour during heat stress
The effect of increasing THI on the behaviour of dairy herds differed between days with pasture access and without pasture access. In the current study, significant changes in daily maximum lying duration, maximum lying duration from 06.00 to 18.00, daily mean number of steps, daytime mean number of steps, night-time mean number of steps, mean number of steps from 12.00 to 15.00, mean SD of number of steps from 12.00 to 15.00, daily mean number of posture changes, daytime mean number of posture changes and night-time mean number of posture changes in response to increasing daily mean THI were observed only on days with pasture access. The study of Hut et al. (Reference Hut, Scheurwater, Nielen, Van Den Broek and Hostens2022) reported that the daily total lying duration and walking time on farms with pasture access and a conventional milking system declined when THI increased, but they also found that the change in daily total walking duration was not pronounced on farms without pasture access and with an automatic milking system. In addition, in the current study, the slopes of most behavioural variables in the daily mean THI range with significant behavioural changes were greater on days with pasture access than on days without pasture access. Previous research indicated that pasture access heavily affected the daily time budgets of dairy cows (Charlton and Rutter, Reference Charlton and Rutter2017). Pasture access promotes the animal’s ability to handle heat stress by providing dairy cows with greater freedom and space to seek shaded areas and express natural behaviour (Crump et al., Reference Crump, Jenkins, Bethell, Ferris and Arnott2019). Therefore, behavioural changes due to heat stress could be more pronounced on days with pasture access (Crump et al., Reference Crump, Jenkins, Bethell, Ferris and Arnott2019). Another possible reason for these differences in the slopes of behavioural variables between days with and without pasture access is that dairy herds on days with pasture access are under a more severe risk of heat stress, due to a lack of shade and a cooling system while on pasture, and have more heat production generated from locomotion during grazing in the afternoon (Charlton and Rutter, Reference Charlton and Rutter2017).
Different behaviours differed under heat stress
Different behavioural variables in cows have different cut-off THI values in response to increasing THI. In the present study, the cut-off THI values where behavioural variables started to change ranged approximately from 60 to 65 for lying duration-related variables, but these cut-off THI values ranged approximately from 31 to 59 for number of steps and posture change-related variables. In previous studies, the cut-off THI values at which dairy cows started to adapt to heat stress were reported to range from 52 to 72 via assessing the changes in rumination time, dry matter intake, lying and standing in dairy herds (Cincović et al., Reference Cincović, Belić, Toholj and Stevančević2011; Hoffmann et al., Reference Hoffmann, Herbut, Pinto, Heinicke, Kuhla and Amon2020; Müschner-Siemens et al., Reference Müschner-Siemens, Hoffmann, Ammon and Amon2020). The rumination duration of a dairy herd in the region with a moderate climate decreased slightly when THI increased from 42 to 52 and sharply decreased from 535 to 485 min/d when THI increased from 52 to 72 (Müschner-Siemens et al., Reference Müschner-Siemens, Hoffmann, Ammon and Amon2020). Similarly, the daily total standing and walking duration of dairy herds were stable until THI exceeded 64, after which they started to decline, while the daily total lying duration gradually decreased as the THI exceeded 56 in the dairy herds in the Netherlands with a moderate climate (Hut et al., Reference Hut, Scheurwater, Nielen, Van Den Broek and Hostens2022). Aside from the regional climatic and farm condition variations, the differences in the cut-off THI values among different behavioural variables in this study indicate that cows gradually adjust their behaviour to maintain their homeostasis as the THI increases. It can help to explain the huge variation in the cut-off THI values of heat stress across studies. For example, two studies by Heinicke et al. (Reference Heinicke, Hoffmann, Ammon, Amon and Amon2018) and Müschner-Siemens et al. (Reference Müschner-Siemens, Hoffmann, Ammon and Amon2020) were both performed on the same German farm and reported the cut-off THI values of heat stress at THI 67 and 52, respectively. The first study determined the cut-off THI value of heat stress based on the changes in lying duration, standing duration and the number of steps, while the second study was based on the changes in rumination duration. Thus, it is more reasonable to comprehensively combine multiple behavioural variables as indicators to assess the onset of heat stress. Multiple behavioural variables are not only beneficial for determining the threshold of THI for heat stress, but it can also be hypothesized that an approach using multiple behavioural variables is beneficial for the robustness of the early detection of heat stress across different farms and environments.
Developing THI-related behavioural variables
In the present study, some of the extracted variables might give similar information concerning the behavioural changes with increasing THI. For instance, the mean lying 20–24 and night-time mean lying both reflected the decrease in lying duration of dairy herds with increasing daily mean THI in the night-time, although they relate to different periods. Selecting an excessive number of variables to detect heat stress increases the computational time and risk of overfitting the prediction model (Pudjihartono et al., Reference Pudjihartono, Fadason, Kempa-Liehr and O'Sullivan2022). The 24-h pattern behavioural variables, which can be regarded as derived summaries of cow behaviour during specific time periods within a day, may perform better in detecting heat stress by censoring other time periods within a day with little or no additional information and eliminating local noise, such as the behavioural disturbance derived from milking (Koller and Sahami, Reference Koller and Sahami1996). Moreover, only using the correlation coefficient, as presented in the current study, is insufficient for feature selection (Yu and Liu, Reference Yu and Liu2004). Relevant methods, such as correlation-based feature selection and fast correlation-based filter, have been used to further select variables for stress detection in laying hens (Yu and Liu, Reference Yu and Liu2004; Lee et al., Reference Lee, Noh, Jang, Park, Chung and Chang2015). Further studies are needed to better select extracted variables and other 24-h pattern behavioural variables for the early detection of heat stress. In addition, behavioural variables were related to daily mean THI in this study because daily mean THI was highly correlated with THI in specific periods within a day and is widely used in heat stress research. Behavioural responses to heat stress may be more strongly associated with THI measured within the corresponding time windows of 24-h pattern variables (e.g., afternoon or night-time) than with daily mean THI, as behaviour responds to short-term thermal increase. Therefore, future studies could consider aligning behavioural variables with THI measurements in the same time window to detect heat stress.
Implications of THI-related 24-h pattern behavioural variables
Besides being an indicator for heat stress in dairy herds, the THI-related 24-h pattern behavioural variables could also be used to optimize the utilization and assessment of heat abatement strategies. The decline in mean lying duration from 18.00 to 06.00 as the daily mean THI increased indicated that dairy herds spent more time standing during night-time under heat stress. Dairy cows in standing expose a larger body surface area than lying, which enhances heat dissipation through air movement and convection (Maia et al., Reference Maia, DaSilva and Battiston Loureiro2005; Allen et al., Reference Allen, Hall, Collier and Smith2015). It can be expected that heat abatement strategies that maintain or increase the lying duration of herds from 18.00 to 06.00 during hot periods could help abate the damage to dairy herds caused by heat stress. Similarly, the decrease in the number of steps and SD of steps of dairy herds between 12.00 and 15.00 on days with pasture access in response to increased THI indicates that dairy herds are experiencing the hottest time in a day and heat load generated from walking to pasture and grazing (Osuji, Reference Osuji1974). Providing sprinkling and access to drinking water for outdoor dairy herds prior to walking to pasture or grazing could reduce the cumulative heat load generated during walking and grazing, thus facilitating better adaptation to the subsequent peak heat stress in the afternoon (Kendall et al., Reference Kendall, Verkerk, Webster and Tucker2007). When natural shade is lacking on pasture, keeping dairy cows outdoors at night-time rather than during the day may also help alleviate heat stress. In addition, the 24-h pattern behavioural variables could also be used to assess the performance of heat abatement strategies that were provided at specific times earlier. If the heat abatement strategies implemented at earlier times were effective, the variables that previously changed with increasing THI would now be expected to change less, or in the opposite direction. Moreover, 24-h pattern behavioural variables allow a more frequent assessment of the performance of heat abatement strategies to producers, in contrast to the retrospective assessment based on the daily mean behavioural variables at the end of a day. The relationships between THI and behavioural variables on days without pasture access could be stronger or clearer when THI is measured in the barn (i.e., more accurate data than the nearest weather station data used in the current study), or when information on the presence of cooling systems would be available, which can facilitate the correction for cooling system use in the analysis of the data. The variation among farms and individual cows (e.g., parity and days in milk) influences behavioural responses and can be expected to optimize the relationship between behaviour and THI. Future research should consider these factors to better understand behavioural changes under heat stress.
In conclusion, the current study extracted and quantified 18 behavioural variables relating to the duration of lying, number of steps and number of posture changes of dairy cows and assessed the relationships of these behavioural variables with the daily mean THI. Some of the 24-h pattern variables, including night-time mean lying, mean lying 20–24, mean steps 12–15, mean steps SD 12–15, mean posture changes 08–16 and daytime posture changes, had a more consistent direction of correlation with daily mean THI across farms compared with the daily mean variables. Moreover, some of the 24-h pattern variables, including mean lying 20–24, mean lying 00–03, daytime mean steps, mean steps 12–15 and mean posture changes 08–16, exhibited wider ranges in the daily mean THI ranges with significant behavioural change than the daily mean variables. The behavioural changes of dairy herds with increasing daily mean THI differed between days without pasture access and days with daytime pasture access. Dairy herds had more behavioural changes with increasing daily mean THI on days with pasture access compared with days without pasture access. The results in the presented study can be applied to optimize the early detection of heat stress for dairy cows.
Supplementary material
The supplementary material for this article can be found at 10.1017/S0022029926102556.
Acknowledgements
The authors would like to thank the China Scholarship Council for providing the scholarship, the farmers for their time and participation in this study, and Peacock Technology (formerly IceRobotics) for sharing the processed accelerometer data.
Competing interests
The authors have not stated any conflicts of interest.
Ethical statement
No ethical approval was required as the accelerometers were attached to the cows before this monitoring study for cow management purposes.




 Open access

