Introduction
A great deal of research has been done on the political consequences of inequality (Alesina and Giuliano, Reference Alesina, Giuliano, Benhabib, Jackson and Bisin2011; Benabou and Ok, Reference Benabou and Ok2001), but most of the literature is based upon the idea that inequality automatically translates into behaviours, and it assumes that individuals have a perfect understanding of inequality and its impact on their everyday life. In the well-known model of Meltzer and Richard (Reference Meltzer and Richard1981), individuals vote according to their relative income, and given that the median voter is poorer than the average-income earner, a majority of voters is expected to vote for redistribution in democracies. However, individuals have very limited information about the social structure and their own relative position within it (Evans and Kelley, Reference Evans and Kelley2004; Runciman, Reference Runciman1966). Secondly, there is strong evidence showing that individuals are concerned not only about inequality of outcomes but also about inequality of opportunities and fairness in the distribution of rewards (Alesina and Glaeser, Reference Alesina and Glaeser2004; Benabou and Tirole, Reference Benabou and Tirole2006; Linos and West, Reference Linos and West2003). This leaves significant room for studying individuals’ beliefs about inequality in order to know how they understand social structure and form their political preferences accordingly. Nevertheless, the role of beliefs about inequality remains mostly obscure.
Several studies have shown that attitudes toward redistributive policies are shaped by beliefs about inequality (Alesina and Glaesser, Reference Alesina and Glaeser2004; Benabou and Tirole, Reference Benabou and Tirole2006; Kluegel and Smith, Reference Kluegel and Smith1986; Linos and West, Reference Linos and West2003; Piketty, Reference Piketty1995). If individuals believe that inequalities result from differences in effort and merit, they will be more reluctant to distribute resources from the rich to the poor and, hence, support for social policies will be lower. On the contrary, if they think that inequality is unfair, the demand for social policies will increase. However, our understanding of beliefs about inequality of opportunities is still very limited, mostly because of the lack of research about how individuals acquire these beliefs from social reality. In order to overcome these limitations, the goal of this paper is twofold. First, we introduce an index of inequality of opportunities based on measures of subjective expectations of upward mobility for different social origins and discuss their properties. Secondly, we test the explanatory power of the index against three dimensions of preferences regarding social policies: government responsibility and attitudes toward meritocracy and competition. Our empirical analysis, gathered from a representative sample of the adult population in the Spanish region of Andalusia, confirms that beliefs about opportunities for social mobility have a strong and significant impact on both preferences regarding government responsibility and attitudes toward meritocracy and competition.
The rest of the paper is organised as follows: In the next section, we discuss the nature of beliefs about inequality and how they have been analysed in the literature. In the third section, we introduce an index of inequality of opportunities and describe its properties and methodological foundations. In the fourth section, we explain our main hypotheses about the effect of the index on preferences for social policies and describe the data we used to test our hypotheses. In the fifth section, we discuss the results of the statistical analysis and its implications. Finally, there is a section of conclusions and questions for further research.
Theoretical overview
Social scientists have maintained two different views about social beliefs. If we assume that individuals have perfect information about social and economic reality, the role of beliefs is very limited (Goldthorpe, Reference Goldthorpe2000: 118). As Rydgren (Reference Rydgren, Hedström and Bearman2009: 73) points out, ‘if beliefs . . . could always be inferred from people's situations in a perfect way, that is if beliefs were always congruent with reality, belief-formation process would be transparent and of little interest to explanatory sociology’. Conversely, if we assume that individuals do not have perfect information about the social structure, they have to use their beliefs in order to form their preferences. Since individuals do not know all the relevant factors from the past and the present, beliefs are helpful as a cognitive economy mechanism. Still, in order for beliefs to matter in the explanation of preferences and behaviours, they cannot be the simple outcome of primary socio-demographic variables, as with a sort of simplistic Marxism, according to which the ideological realm is a simple by-product of economic reality. People who have similar experiences and observations are more likely to share beliefs but they ‘are often the result of a complex process, not mimetic transcripts of reality’ (Rydgren, Reference Rydgren, Hedström and Bearman2009: 75).
In the same vein, Svallfors (Reference Svallfors2006: 22) has argued that the link between objective variables (such as social class) and subjective attitudes (such as preferences for redistribution) is probabilistic and that we must be aware of ‘the large degree of contingency and randomness’. Linos and West (Reference Linos and West2003: 405) have emphasised the need to examine the pathways through which beliefs about the world and demographic attributes shape preferences for redistribution. Even classical sociologists and political thinkers were very aware of the impact of beliefs about social fluidity on social and political attitudes. For instance, Tocqueville (Reference Tocqueville2002 [1835]) argued that the belief in the land of opportunities explains the lack of revolutionary predisposition in the American working class and Sombart (Reference Sombart1976 [1906]) stressed the link between the perception of social fluidity and political preferences.Footnote 1 And later on, Lipset (Reference Lipset and Turner1992) emphasised the importance given by Sombart to subjective social mobility to highlight the need for a systematic study of both objective mobility and subjective beliefs about social fluidity. Contemporary studies about social fluidity and preferences for social policies can be classified into two major categories. The first focuses on the link between personal experiences of social mobility and changes in preferences, while the second approach analyses the impact of beliefs about meritocracy on preferences.
Within the first approach, Piketty (Reference Piketty1995, Reference Piketty1998) proposes a formal model in which income is the result of both effort and inherited factors. However, individual agents do not fully know to what extent effort is important in determining their own income. They must learn about the true parameters of the model incorporating information from their own experience. Nevertheless, given that experience is limited, each generation can only gather imperfect information about the true chances for social mobility. Even if agents are truly rational Bayesian learners, their final beliefs about social mobility will be ‘contaminated’ by their own initial beliefs, whether they are true or not. As a consequence, individuals holding different initial beliefs will interpret experiences of upward (or downward) mobility in different ways and will prefer different redistribution schemes.
Empirical studies show that past experiences of social mobility change political attitudes, although the effect is not linear, suggesting that beliefs about the causes of mobility are not easily altered by reality. Weakliem (Reference Weakliem1992) reviewed several hypotheses indicating that the effect of downward and upward mobility on preferences and attitudes is not symmetric and concluded that the effect is not homogeneous across social classes, as it depends on class origin and destination. All in all, more recent studies reviewed by Paterson (Reference Paterson2008), and her own analysis, suggest that upward mobility has played a very limited role in changing political attitudes. Nevertheless, in the specific domain of preferences toward redistribution, Schmidt (Reference Schmidt2011) argues that individuals who have experienced upward mobility are less supportive of income redistribution because they explain their success by their own internal dispositions, although this finding is moderated by cultural contexts. In contrast, individuals who have experienced downward mobility are more supportive of income redistribution because they think their failure is a consequence of external factors. Kelley and Kelley (Reference Kelley, Kelley, Haller, Jowell and Smith2009) found analogous results analysing subjective mobility. After controlling for objective mobility, individuals who believe they have experienced upward mobility (even if this was not the case) are more likely to think that they ought to earn higher salaries.
In a similar vein, Ravallion and Lokshin (Reference Ravallion and Lokshin2000) concluded that those who experience improvement are less inclined to vote for redistribution, even after controlling for other variables, such as their real income. In addition, individuals do not only take into account past experiences of social mobility to form their preferences, but also expectations of future mobility. Therefore, support for redistribution will increase as the prospects for upward mobility diminish. This is the history behind the prospect of upward mobility (POUM) hypothesis formalised by Benabou and Ok (Reference Benabou and Ok2001): a range of individuals with below-average income will oppose redistribution as they expect their future income to be above average. Empirical proof of the effect of expectations of upward social mobility on preferences for redistribution is provided by Alesina and La Ferrara (Reference Alesina and Ferrara2005). Rainer and Siedler (Reference Rainer and Siedler2008) reach similar conclusions using subjective expectations about increases in salaries.
A second strand of the literature focuses on the impact of beliefs concerning the sources of inequality on redistribution preferences. Along these lines, Kluegel and Smith (Reference Kluegel and Smith1986) characterised ‘America's dominant-ideology’ as based on the idea that society supplies widespread opportunity for individual economic advancement. These beliefs do not necessarily reflect reality but they have an impact on political preferences. According to Alesina and Glaeser (Reference Alesina and Glaeser2004), beliefs about mobility matter because they can explain popular support for the welfare state. They emphasise that differences in the demand for redistribution between the United States and Europe can be explained by different beliefs about the causes of inequalities. If individuals believe that birth determines status, they will support redistributive policies; whereas if they believe that effort is more important, they will be against redistributive policies. According to Alesina and Glaeser, these beliefs are shaped mostly by politics and indoctrination (not primarily by reality). In Europe, the non-meritocratic view gained ground because of the power of unions and socialist parties, which dominated educational policies, and the role played by intellectuals (Benabou and Tirole, Reference Benabou and Tirole2006). In the United States, the ideology of social Darwinism, laissez-faire and the land of opportunities is the result of an educational system controlled by the upper classes.
Benabou and Tirole (Reference Benabou and Tirole2006) propose a formal model to explain cross-national differences in support of redistribution by cultural factors. In their model, individuals hold different beliefs about the sources of social inequalities. To make sense of their own actions, they attempt to convince themselves that effort will bring success in order to avoid cognitive dissonance. This creates a recursive loop: hard-working individuals need to believe that their effort will be rewarded; they need to believe in meritocracy to commit themselves to a high level of effort. In such a society, an equilibrium emerges in which the majority will vote for lower taxes. And lower taxes will motivate individuals to work hard, since they already know that redistribution is low. In contrast, if the majority holds the view that inequalities are caused by external factors and do not depend on personal effort, the majority will vote for generous redistribution, which is also a reinforcing equilibrium because it is a disincentive for risk-taking. According to Benabou and Tirole (Reference Benabou and Tirole2006), the first equilibrium describes the American case, and the latter equilibrium is in place in most European countries.
Linos and West (Reference Linos and West2003) proved empirically that perceptions about social fluidity shape support for redistribution. People who think that getting ahead in life is associated with external causes (parents’ background and connections) are more likely to support redistributive policies than those who think that self-determination (ambition, natural ability or hard work) is the main reason for getting ahead. Interestingly, the influence of these perceptions is not the same for all welfare regimes. Beliefs about why people get ahead in society have a greater impact on attitudes toward redistribution in liberal regimes because of the dominance of the idea of the land of opportunities. Nevertheless, Sachweh and Olafsdottir (Reference Sachweh and Olafsdottir2012) show that perceptions about the extent of inequality per se do not explain preferences for redistribution. For instance, Americans see their society as very unequal but they do not aspire to live in an egalitarian society, while Swedes think they live in an egalitarian society but they would prefer an even more egalitarian one. These results suggest that what really matters to explain preferences regarding redistribution is not inequality itself, but beliefs about the sources of inequality.
While the first approach might explain why upward mobility reduces support for redistributive policies, we cannot tell if the causal mechanism behind it is self-interest or fairness concern. Individuals might oppose redistribution either because they are (or expect to be) at the top of the social ladder, or because their beliefs about getting ahead in life have changed as a result of past (or expected) mobility. There is still one important problem to be addressed within this approach, which is the discrepancy between objective and subjective mobility (Goldthorpe, Reference Goldthorpe2000). Individuals tend to misjudge the extent of the mobility they have experienced (Duru-Bellat and Kieffer, Reference Duru-Bellat and Kieffer2008) and systematically underestimate inequality (Evans and Kelley, Reference Evans and Kelley2004). In addition, individuals have problems estimating their own mobility not only because it requires specific cognitive skills but also because of the tensions related to changes in group membership (Duru-Bellat and Kieffer, Reference Duru-Bellat and Kieffer2008). The second approach might explain how general (and rather abstract) beliefs about inequality and meritocracy affect preferences but it fails to explain the practical meaning of these beliefs. Thinking that luck or connections are important to get ahead in life reveals some distrust in the idea of meritocracy but it does not tell us very much about individual perceptions of inequality of opportunities. In that sense, Bourdieu (Reference Bourdieu1994) stressed that individuals have a great deal of difficulty expressing their opinions if they are asked about matters far beyond their own experience. He thus urged that survey research be used to measure attitudes regarding matters close to individuals’ immediate reality. Using empirical data, Hubert and Form (Reference Hubert and Form1978) showed that when respondents were asked specific questions about equality of opportunities, instead of questions about abstract tenets of justice, the dispersion of the answers increased.
Measuring beliefs about inequality of opportunities
Measuring beliefs about inequality of opportunities is a difficult task, given that individuals only have limited information about the social structure of inequalities (Evans and Kelley, Reference Evans and Kelley2004; Runciman, Reference Runciman1966). To overcome these problems, instead of asking individuals about principles of justice, our approach focuses on specific information about opportunities of mobility that individuals might gather in their everyday life. As Lane (Reference Lane1959) pointed out a long time ago, we need to have specific measures of how individuals evaluate the probability of upward mobility for different groups, because most people tend to overestimate the rate of overall mobility at the aggregate level. In this section, we introduce a subjective measure of the probabilities of upward mobility for different social groups and then compute an index of inequality of opportunities.
In order to know the beliefs about the probability of upward mobility, we conducted a survey in which we asked a representative sample of individuals about the probability of persons coming from different social classes entering the service class. Our main goal here is the analysis of whether individuals believe the probabilities of reaching the top of the social ladder are distributed evenly among persons from different social origins, or if they believe that these probabilities depend on social background. The survey, conducted in 2011, covers a representative sample of the adult population (aged sixteen and over) in the Spanish region of Andalusia.Footnote 2 Data were collected through face-to-face interviews. We used a probabilistic polietapic sampling design stratified by province and municipality size (<5,000 inhabitants, 5,000–10,000, 10,001–20,000, 20,001–50,000, over 50,000 and province capitals). Municipalities within each stratum were selected randomly with probability proportional to their size. Households within each municipality were chosen using random walks, and the selection of the interviewee in each home was made in accordance with gender and age quotas to assure that the sample was representative of the demographic structure of the surveyed population. The effective sample size was 1,203 subjects and the response rate was 89.4 per cent. A confidence level of 95 per cent involves a margin of error of 2.8 per cent. Before carrying out the fieldwork, a pre-test was made over a different sample of 125 subjects in order to test the validity of questions included in the questionnaire.
We defined social classes using the Erikson–Goldthorpe–Portocarrero (EGP) schema (Erikson and Goldthorpe, Reference Erikson and Goldthorpe1992). The EGP schema classifies occupations into eleven social classes, which can be grouped into different classifications. One of the most popular groupings is the seven-class schema that comprises the following social classes: upper service class (I); lower service class (II); routine non-manual workers (III); petty bourgeoisie (IV); foremen and supervisors of manual workers (V); skilled manual workers (VI); semi-skilled and unskilled manual workers and agricultural workers (VII). We use the seven-class schema, except for the fact that we divide the seventh class into semi-skilled and unskilled workers (VIIa) and agricultural workers (VIIb), given the historical relevance of the labour force in the agriculture sector in this region, as compared to other Western countries.Footnote 3
In order to know how individuals evaluate the probability of entering the service class, we asked respondents to state the probabilities of becoming a doctor or a lawyer for individuals having fathers with different occupations. These occupations are typical examples of each social class in the EGP schema. The question says: ‘Would you say that in Spain it is easy to become a doctor or a lawyer for the son of a [X]? Please, tell me the chances on a scale from 0 to 10, where 0 means not easy at all and 10 means very easy’. In each question, [X] was replaced by ‘agricultural worker’, ‘construction worker’, ‘foreman’, ‘self-employed worker’, ‘clerk’, ‘teacher’ and ‘doctor or lawyer’. Thus, we know the probability of becoming a doctor or a lawyer that each individual in the sample assigns to persons with different social backgrounds on a scale from zero to ten, which can be easily transformed into probabilities by dividing the original scale by ten. Furthermore, for a particular individual, the differences in the answers to these eight questions reflect her/his subjective assessment of inequality in the distribution of opportunities.
A similar approach was developed by Rytina et al. (Reference Rytina, Form and Pease1970) in a representative survey in Indianapolis. However, they used only two questions about the chances of upward and downward mobility. The two questions were: ‘Who do you think are more likely to become business executives and professionals: the sons of big business executives and professional men, or the sons of factory workers and small businessmen?’ (upward mobility) and ‘Who do you think are more likely to become factory workers and small businessmen: the sons of factory workers and small businessmen, or the sons of big business men and professionals?’ (downward mobility) (Rytina et al., Reference Rytina, Form and Pease1970: 709). Not surprisingly, they found that an overwhelming majority perceived that individuals have better chances of accessing the professions of their fathers. However, these questions are not suitable to build an index of inequality of opportunities, since they only focus on two specific occupations.
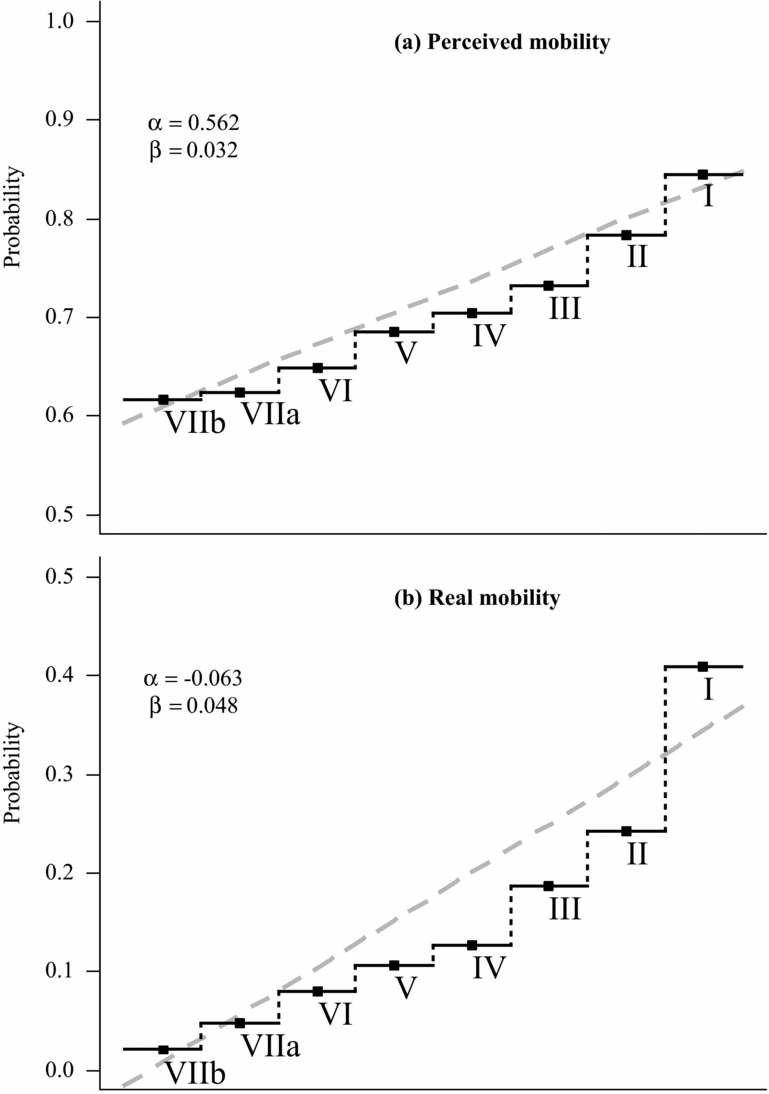
Figure 1 shows the average probability of entering the service class for individuals coming from different social classes as perceived by the individuals in our sample (probabilities are computed by dividing the value of each response by ten), as well as the real probability of entering the service class for the same social classes using data from the European Survey of Income and Living Conditions Survey (EU-SILC, 2005) in Spain. Two interesting patterns can be identified in the data. First, if we compare subjective expectations with objective probabilities, we might conclude that individuals are very optimistic about the chances of entering the service class. On average, individuals’ perceptions of the probability of entering the service class range from 0.617 for the sons of agricultural workers, to 0.845 for the sons of the service class. However, the real probabilities of entering the service class are much lower than expected by the general public, ranging from 0.020 for the son of agricultural workers to 0.410 for the sons of fathers in the service class. This seems to reflect the fact that ‘popular perceptions are often distinctly at odds with reality’ (Benabou and Tirole, Reference Benabou and Tirole2006: 702). Individuals do not have complete information about the social structure in which they live, as there is a significant difference between personal experiences of intergenerational social mobility and the overall rates of social mobility (Duru-Bellat and Kieffer, Reference Duru-Bellat and Kieffer2008; Kelley and Kelley, Reference Kelley, Kelley, Haller, Jowell and Smith2009).
Secondly, the expected probability of entering the service class consistently increases as the social status of the family increases. Individuals might lack information about the social structure, but they still perceive that there is inequality of opportunities. The increase in the subjective probability is almost linear, though there are greater increases from class III to II and from class II to I. The thick dashed grey line in Figure 1(a) shows that the linear pattern fits the data very well (R-squared is 0.95), and the probability of entering the service class increases by about 3.2 per cent from one class to another. In fact, if we compare perceptions and the real rates of mobility, we can see a very similar pattern, since the real probability of entering the service class increases by about 4.8 per cent from one class to another. This indicates that our measure of perceived mobility not only captures perceptions about inequality of opportunities but also that perceptions are not too far from reality. Comparing the two plots in Figure 1, there is an important difference in the Y-axis, reflecting a general optimism about the probabilities of getting to the top of the social ladder. However, the difference between the two slopes is very small, reflecting that people are aware of the inequality of opportunities.
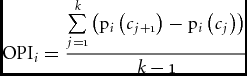
We can think of the differences in the subjective probabilities as a measure of the inequality of opportunities perceived by individuals. Using these probabilities we have defined an index of inequality of opportunities (OPI) that reflects the average change in the chances of entering the service class departing from different social origins as perceived by the representative individual i. To do this, we have arranged the classes in ascending order. Although social class is a categorical variable, we can think of a rank of classes in terms of life-chances or the economic advantages they produce. For our analytical purposes, let there be k classes ranked in ascending order (in our case, there are eight classes ascending from agricultural workers to the service class). Let pi(cj) be the probability that individual i assigns to the event of entering the upper class (the service class in this case) coming from a family in class j. Similarly, pi(cj+1) reflects the subjective probability of entering the upper class from the immediately higher social class j+1. Hence, pi(cj+1) – pi(cj) measures the change in the probability of entering the upper class for individuals coming from contiguous classes. Having k classes, the resulting k – 1 differences reflect how the probability of entering the upper class increases as we move from one class to the next in ascending order. Thus, in order to have an overall measure of inequality of opportunities we compute the average change in probability of entering the service class as:
 \begin{equation}
{\rm OPI}_i = \frac{{\sum\limits_{j = 1}^k {\left( {{\rm p}_i \left( {c_{j + 1} } \right) - {\rm p}_i \left( {c_j } \right)} \right)} }}{{k - 1}}
\end{equation}
If pi(cj) is monotonically increasing in cj (as we move from lower to upper classes) for individual i, all the differences pi(cj+1) – pi(cj) will be positive, so the value of OPIi will be positive (as we have shown for the average individual in Figure 1(a)). Accordingly, the greater the value of OPIi, the greater perceived inequality of opportunities. OPIi will be zero if there is no difference in the perceived probabilities of entering the service class from different social origins. Nevertheless, there is still another situation in which OPIi will be zero. Since there could be positive and negative differences they can cancel each other out resulting in a zero index. In that case, there would be differences in the chances of entering the service class but the slope of the probabilities for the ranked classes will be flat, meaning that probabilities do not increase with social origin and therefore it is reasonable to assume that the chances are independent of social origin. If OPIi were negative, that would imply that opportunities of entering the service class decrease for individuals coming from wealthy families. From a theoretical point of view, we can imagine a society in which social disadvantages are compensated for by public policies and those coming from the lower social strata have better chances to get to the top than those born in the upper classes. Individuals having a negative value in OPIi believe they live in such a society.
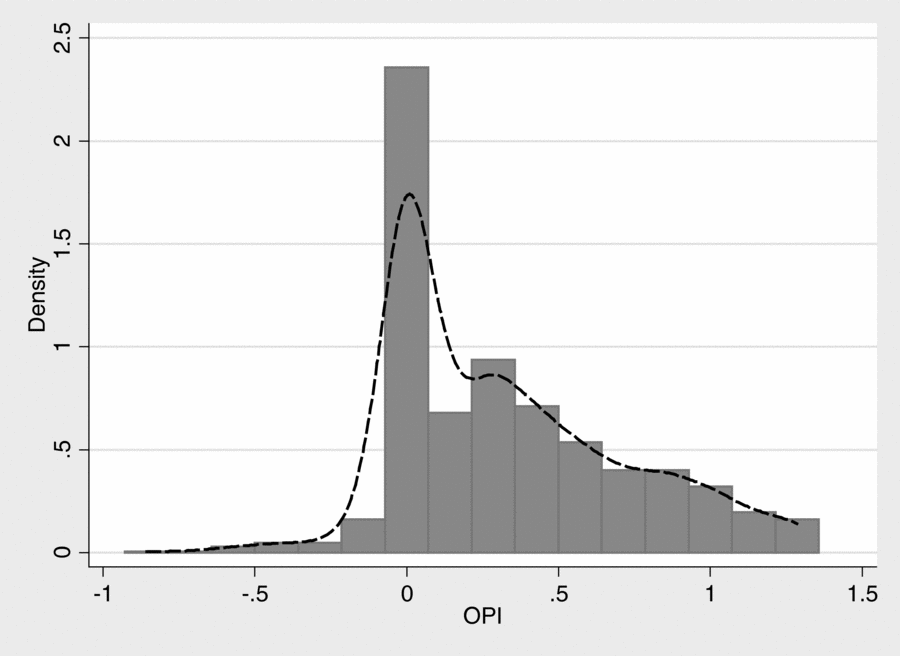
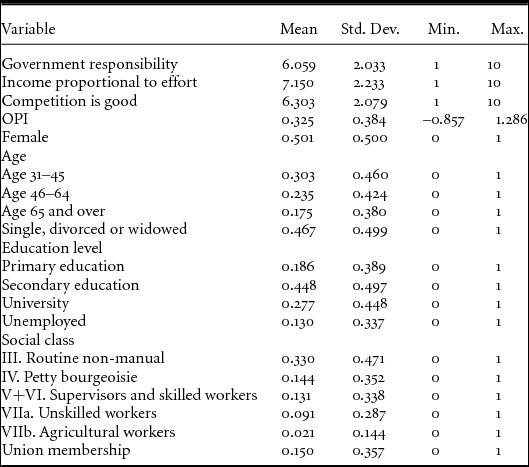
Figure 2 shows the distribution of OPI, using a Gaussian kernel density function and histogram. The distribution is single-peaked but positively skewed (0.683), since only 4.3 per cent of the values in the sample are negative. Nevertheless, a large share of the sample has a zero score in OPI (33.7 per cent), meaning that one-third of those interviewed believe they live in a society in which the son of an agricultural worker has the same chances of becoming a doctor or a lawyer as the son of a doctor or lawyer. Over the full sample, OPI ranges from –0.857 to 1.285, with mean 0.325 and standard deviation 0.384. This means that the average individual believes that the difference in the chances of entering the service class between the top and the bottom of the social ladder is above 20 per cent (0.032*7 = 0.224), while the real difference according to the mobility rates in Figure 1(b) is closer to 40 per cent (0.388). However, there are important differences in OPI by socio-economic characteristics, as the high-income and well-educated groups tend to underestimate the extent of inequality of opportunities. OPI ranges from 0.258 for the service class to 0.532 for agricultural workers and from 0.254 for those having a college degree to 0.411 for those having primary education. Men and middle-aged persons also have a higher score in OPI, but gender and age differences are not statistically significant.
Inequality of Opportunities Index: histogram and kernel density Notes: Gaussian kernel. Source: ERSA (2011).

Testing the impact of beliefs about inequality of opportunities: methodological approach
If beliefs about inequality of opportunities matter for attitudes and behaviours, they should have an impact on individuals’ preferences in three important domains: government responsibility, attitudes toward meritocracy and values regarding competition. According to several theoretical accounts, individuals who believe they live in a society in which opportunities are unevenly distributed will support the redistribution of income from the rich to the poor, and greater government responsibility in the provision of welfare, since inequality of income is assumed to be the result of inherited disadvantages and not the outcome of differences in effort level (Alesina and La Ferrara, Reference Alesina and Ferrara2005; Benabou and Tirole, Reference Benabou and Tirole2006; Piketty, Reference Piketty1995). These persons will also be unsupportive of rewarding individual effort and stimulating competition. Following this reasoning, we hypothesise that our index of inequality of opportunities will have a positive impact on preferences regarding government responsibility and a negative effect on preferences regarding meritocracy and competition.
In order to test these hypotheses, we have run an OLS regression of each of the following dependent variables taken from the World Value Survey questionnaire: government responsibility, ranging from 1 (‘Individuals should take more responsibility for providing for themselves’) to 10 (‘The state should take more responsibility to ensure that everyone is provided for’); meritocracy, ranging from 1 (‘Incomes should make more equal’) to 10 (‘There should be more incentives for individual effort’); and preference for competition, ranging from 1 (‘Competition is harmful. It brings out the worst in people’) to 10 (‘Competition is good. It stimulates people to work hard and develop new ideas’).
Three types of explanatory variables are included in each model: the inequality of opportunities index (as previously described), socio-demographic characteristics and mobilisation variables. Socio-demographic variables include those that reflect differences in income sources in the labour market, which correlate with preferences for redistribution in different studies across countries (Alesina and Giuliano, Reference Alesina, Giuliano, Benhabib, Jackson and Bisin2011). These variables are: gender (0 = male, and 1 = female); age (0 = age 16–30, 1 = age 31–45, 2 = age 46–64, and 3 = age 65 and older); marital status (0 = married or living together, and 1 = single, divorced or widowed); education level (0 = no formal education, 1 = primary education, 2 = secondary education, and 3 = university); unemployed (0 = working or not in the labor market, 1 = unemployed); and social class. Social class is measured using the well-known EGP schema (see above for explanation). To avoid sparse categories we use a six-class schema (1 = I+II, service class; 2 = III, routine non-manual; 3 = IV, petty bourgeoisie; 4 = V+VI, supervisors and skilled workers; 5 = VIIa, unskilled workers; and 6 = VIIb, agricultural workers). We also include union membership (0 = not member and 1 = member) as a variable measuring political mobilisation (Svallfors, Reference Svallfors2006). A descriptive analysis of the dependent and the explanatory variables is reported in Table 1.
Main findings
We begin this section with a descriptive analysis of preferences for government responsibility, meritocracy and competition in our sample. Data reported in Table 1 show a mixed picture if we compare the data to other Western societies. In comparative terms, there is strong support for meritocracy (7.15 on average) and competition (6.30) but also for government responsibility in the provision of welfare (6.06). These findings are in line with previous studies of the Spanish population as a whole, which stress the high demand for redistributive policies in the country (Calzada and Del Pino, Reference Calzada, Del Pino, Guillén and León2011), but reveal increasing support for market values, such as meritocracy and competition.
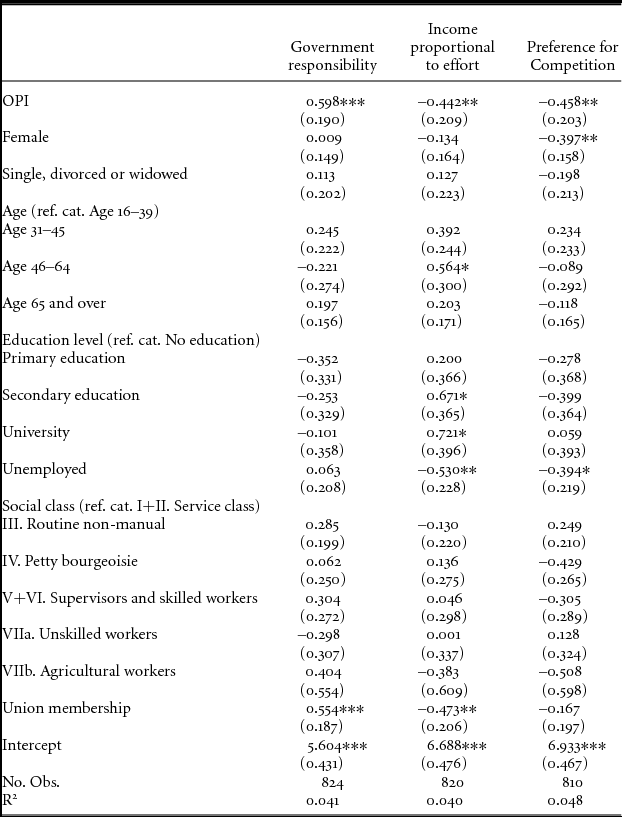
In Table 2, we report the results of an OLS regression for each of the dependent variables. As previously hypothesised, the index of inequality of opportunities has a positive and highly significant impact on support for government responsibility and also a negative and significant impact on meritocracy and attitudes toward competition. Individuals who believe that there is a high level of inequality in opportunities are more supportive of state intervention and redistributive policies and reject market values such as meritocracy and competition. In contrast, individuals who think they live in an open society, where opportunities to move up are equally distributed, do not support redistribution and are supportive of meritocracy and market competition. As Kluegel and Smith (Reference Kluegel and Smith1986: 166) noted, ‘redistributive policies seem to be evaluated on the basis of fairness in principle rather than on the basis of people's beliefs about the current state of inequality’.
Preferences for government responsibility, redistribution and competition
Notes: ***, **, and * indicate significance level at 1%, 5% and 10%, respectively. Standard errors in brackets.
Source: ERSA (2011).
One particularly interesting finding is that socio-demographic variables play a very limited role in explaining attitudes toward state and market in our sample, despite the wide diffusion of the self-interest approach in the literature (Jaeger, Reference Jaeger2006). Age and education have a small but still significant impact on meritocracy, as the well-educated are more willing to reward effort. And women are found to be less supportive of competition as experimental economics has already shown (Gneezy et al., Reference Gneezy, Niederle and Rustichini2003). However, social class has no significant effect on any of the three dependent variables, and being unemployed reduces support for meritocracy and competition but has no significant effect on government responsibility. That is, the ‘real’ individual opportunity structure, in terms of class-dependent opportunities, has a limited explanatory power as compared to the perceived inequality of opportunities. These results are in line with previous studies about the Spanish population, which showed social class having no significant effect on the support for different models of welfare provision (Calzada and Del Pino, Reference Calzada and Del Pino2008). Similarly, in a comparative study of thirty-nine countries Blekesaune (Reference Blekesaune2007) found that employment status was not as strongly correlated to preferences regarding government responsibility and belief in meritocracy as subjective evaluations such as financial satisfaction. Finally, union membership does have an impact on preferences for government responsibility (positive) and meritocracy (negative) as it is assumed to be linked to political mobilisation of working-class interests (Svallfors, Reference Svallfors2006).
The estimated coefficients are quite robust to different specifications. Significance levels for the rest of the explanatory variables remain unchanged if OPI is removed from the models and the significance of OPI itself does not change after removing socio-demographic variables. Furthermore, introducing additional controls does not change the main findings. All in all, our results indicate that attitudes and preferences for state intervention and market values are primarily shaped by beliefs about inequality rather than by the real position of individuals on the social ladder, as suggested by previous research (Kelley and Kelley, Reference Kelley, Kelley, Haller, Jowell and Smith2009). When people believe they live in an open society, those who are at the bottom may think that they (or their children) can still get to the top and, therefore, not support state intervention or the placing of limits on competition and meritocracy. At the same time, the well-off feel entitled to enjoy their comparative advantage as they believe they deserve it, whereas they might support state intervention if they believed that the distribution of outcomes was unfair and feel guilty about their own success.
Finally, the effect of OPI on each of the three dependent variables is quite similar in size, though greater for government responsibility. Preference for government intervention increases by 6 per cent for one unit increase in OPI, while preference for meritocracy and competition decreases by 4.4 per cent and 4.6 per cent respectively. Therefore, beliefs about inequality of opportunities seem to have stronger impact on preferences regarding redistributive policies than on the values organising society. This suggests that when people perceive an unfair distribution of opportunities, they might prefer that the state intervene to equalise outcomes, rather than that they themselves dismiss the values of meritocracy and competition deeply rooted in market societies.
Conclusions
Several theoretical perspectives have stressed the role of beliefs in explaining certain social processes. However, the operational measurement of beliefs poses a difficult research problem. The main aim of this paper has been to study the influence of beliefs about social fluidity on redistributive preferences. We introduced a new measure of beliefs about inequality of opportunities, asking respondents, in a representative sample of the Spanish region of Andalusia, about the probability of individuals from different social classes reaching the service class. We have shown that beliefs about the distribution of opportunities are consistent with reality in the sense that individuals tend to assign higher probability of reaching the service class to those who come from higher positions on the social ladder. However, individuals also tend to overestimate the probability of upward mobility for every social class. This is consistent with many previous studies, where it was also found that individuals underestimate the extent of inequality in society (Evans and Kelley, Reference Evans and Kelley2004; Lane, Reference Lane1959).
More importantly, we have found, after controlling for other relevant factors, that beliefs about inequality of opportunities are correlated with preferences for redistributive policies. As we expected, those who believe that opportunities are fairly distributed oppose government responsibility while those who believe that there is a great deal of inequality tend to prefer more government responsibility. At the same time, a higher perception of inequality is associated with a lower preference for meritocracy and competition.
In addition, the fact that preferences towards redistribution are based on beliefs implies some degree of autonomy from socio-economic variables. In other words, there is not a mechanical relationship between social position and attitudes towards social policy. Individuals bear a practical relationship with the reality around them (Bourdieu, Reference Bourdieu1998). Our results suggest that further research, using qualitative approaches such as biographical methods, will be needed in order to know how beliefs about social mobility emerge (Chamberlayne et al., Reference Chamberlayne, Bornat and Wengraf2000; Merrill and West, Reference Merrill and West2009). As Bertaux and Thompson (Reference Bertaux and Thompson1997: 34) pointed out, these methods ‘provide a valid and rich raw material for both social history and for the interpretation of social mobility’. Thus further investigation should address the contexts in which the discourses concerning social mobility emerge and reproduce. Such research must focus on processes rather than outputs of social mobility (Becker, Reference Becker2007; Patton, Reference Patton2002).
Some additional questions remain open for further investigation. First, we need to know more about the mechanisms through which beliefs are generated and how individuals process information about the outside world in order to come up with their own beliefs about social inequality: what relevant pieces of information do they take into account and how are confirming and non-confirming tokens of information weighed? Secondly, we need to know whether beliefs are generated through a unique process or if different individuals use different amounts of information depending on their personal traits and cognitive skills. Finally, more comparative research will be needed in order to understand the extent to which beliefs about social inequality, their causes and consequences, vary across different institutional settings.
Ackowledgements
The authors gratefully acknowledge financial support from the Spanish Ministry of Economy and Competitiveness to conduct this research (CSO2011-29346). Earlier versions of this paper were presented at the II Conference of the Spanish Network on Social Policy (2010) and at the Workshop ‘Europe 2020: Contributions to Smart, Green and Inclusive Growth’ held by the Spanish National Research Council (CSIC) (2011). We are grateful to María Cascales-Mira for research assistance at the Andalusian Studies Center (Centro de Estudios Andaluces) and Inés Calzada, Xavier Coller, Eloísa del Pino, Juan J. Fernández, José A. Noguera, two anonymous referees and the Editors of Journal of Social Policy for helpful comments and suggestions to earlier versions of this paper. However, the usual disclaimer applies.