Independent component analysis (ICA) is a promising computational and statistical technique that is being increasingly applied to analysis of brain imaging data Reference McKeown and Sejnowski(1). To date, since its emergence data analysis in functional neuroimaging has been dominated by the use of mass-univariate multiple linear regression models, especially in functional magnetic resonance imaging (fMRI) studies. Indeed the general linear model (e.g. http://www.fil.ion.ucl.ac.uk/spm/software/spm5/) has become the standard tool for testing imaging hypotheses. However, regression requires response dynamics to be exactly specified beforehand, and this limits its use to experiments where such responses are predictable. In contrast, using ICA, data can be decomposed into independent components (ICs) with a meaningful neurophysiological interpretation, irrespective of any prior information about the experimental paradigm. Thus ICA along with functional neuroimaging allows us to study brain function during complex active states and also when it is putatively at rest.
ICA enables us to disentangle and identify components that are ‘mixed’. For example, consider three people are speaking in the same room and their speech is recorded using a microphone and we are interested in only one speaker's speech. It would be useful to be able to filter out each of the voices in turn, so that we can produce a recording of just the voice we are interested in, rather than having a recording of the voice we are interested in mixed with the other voices overlaid. This is commonly known as ‘cocktail party’ problem and ICA was originally developed to solve this problem by separating independent ‘sources’ (i.e. voices) that have been mixed together Reference Bell and Sejnowski(2). There are, of course, a number of other signal processing techniques such as principle component analysis, and factor analysis, which can also separate signals and extract components. The difference between these techniques and ICA, however, is that they extract signals that are uncorrelated whereas ICA draws upon higher-order signal statistics to determine a set of ‘components’ that are maximally independent of each other. This is the key.
With the application of ICA, data can be separated into either spatially or temporally ICs Reference McKeown and Sejnowski(1,Reference Calhoun, Adali, Pearlson and Pekar3). Each yields a corresponding timecourse or component map. Temporal ICA is primarily used in electroencephalogram (EEG) studies whereas spatial ICA is applied largely to fMRI. There are several reasons for this, the most important of which is that the spatial dimension is much larger than the temporal dimension in fMRI, whereas conversely in EEG, the temporal dimension is much larger than the number of sources.
Throughout the early history of neurology and neuroscience, most theoretical accounts of brain function have emphasised either aspects of localisation or distributed properties but modern views focus extensively on the structure and dynamics of large-scale neuronal networks. Brain functional connectivity is often assessed from fMRI data either using seed-based methods, such as those of detecting temporal correlation between a predefined region (seed) and all other regions in the brain, or using ICA where IC spatial maps represent constellations of brain regions that are partially synchronised with the corresponding component timecourses and this therefore represents a functional connectivity map. Seed-based approaches require a choice of seed region and/or an a priori timecourse. In contrast ICA does not, and this makes it an ideal choice for exploratory studies. In fact in some cases, ICA can be more sensitive, specific and accurate in revealing functionally connected regions than seed-based approaches.
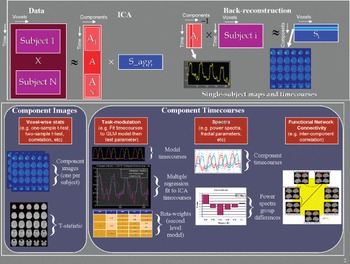
Blood oxygen level dependent (BOLD) signal from a given brain voxel is a linear combination of different interesting (haemodynamic changes) and non-interesting (movements and machine artefacts) sources. ICA has not only been used to identify interesting components but also to remove noise/artefacts from fMRI data. Unlike univariate methods (e.g. regression analysis), ICA does not naturally generalise to a method suitable for drawing inferences about groups of subjects. But now group ICA method has been developed Reference Calhoun, Adali, Pearlson and Pekar(3) which allows to work on either ICA image or timecourses to draw inference on a group or between group level. Timecourses from group ICA has also been used to understand relationship among ICs, i.e. functional network connectivity Reference Jafri, Pearlson, Stevens and Calhoun(4). Figure 1 provides a graphical representation of the group ICA approach implemented in the GIFT software (http://icatb.sourceforge.net).
Graphical illustration of group independent component analysis (ICA): Group ICA as implemented in GIFT incorporates temporal concatenation plus a back-reconstruction step to produce single-subject maps and timecourses. The individual subject data is projected onto the subject-specific partition of the mixing matrix to compute the corresponding single-subject component image (top panel). Which of these components is of interest depends upon the question being asked which can draw upon comparisons of the component images or timecourses. Group ICA enables voxel-wise testing of the components images or fitting of a model to the component timecourses (bottom panel). The timecourses can be tested for (1) modulation during different task stimuli, (2) spectral power or (3) relationships among components (functional network connectivity).

Fusion of information from different modalities that have complementary strengths and weakness, allows us to obtain reliable and more brain activity mapping information than is possible with a single modality, or from separate analyses of fused modalities. Several new techniques such as joint ICA (jICA) and parallel ICA (paraICA) have been recently used to fuse information Reference Calhoun, Liu and Adali(5). For instance, jICA identifies components by jointly analysing data from multiple modalities that has been collected in the same set of subjects. This method has been applied to combine information from fMRI with structural MRI or event-related potentials (ERPs). Similarly, paraICA integrates data from different modalities but does so by identifying components from each modality while jointly enhancing intrinsic interrelationships. This approach has been applied to link fMRI/ERP data and also fMRI and genetic data Reference Calhoun, Liu and Adali(5). Results thus far suggest that paraICA provides reliable results and can identify the linked components with relatively high accuracy.
The byte
While ICA is a powerful and versatile data-driven approach for studying brain dynamics there are some caveats that should be kept in mind while interpreting ICA results. The first of these is that any given IC may not in itself be reliable. But software package (http://www.cis.hut.fi/projects/ica/icasso/about+download.shtml) has been developed for analysing the reliability of the estimated ICs. Secondly, selecting the optimum number of ICs is a variable process that remains suboptimal. There is no consensus as to the best method for estimating the number of ICs and this is an area of active investigation. Generally, selection of ICs is a trade-off between the burden of computation and the loss of information. Regardless, ICA is a promising tool and a valuable addition to the analytical armamentarium, though like all tools it requires sharpening.