1 Introduction
The interaction between heterogeneous hollow droplets embedded with a cavity and a rigid wall occurs in the fields of controllable biomedicine (Wang et al. Reference Wang, Kang, Lee, Luo, Huang and Yeh2012) and coating engineering (Solonenko, Gulyaev & Smirnov Reference Solonenko, Gulyaev and Smirnov2008; Gulyaev Reference Gulyaev2015). For biological precision medicine, the droplets commonly serve as supports to transport a gene or drug. When a droplet reaches the required target, cavitation is triggered to release the inner substance (Mountford, Thomas & Borden Reference Mountford, Thomas and Borden2015; Rapoport Reference Rapoport2016; Sheeran et al. Reference Sheeran, Daghighi, Yoo, Williams, Cherin, Foster and Burns2016). In coating engineering, heterogeneous hollow droplets embedded with a cavity are used to control the porosity, thermal properties and in-flight behaviours and to enhance the spray-coating properties (Rousseau et al. Reference Rousseau, Fourmond, Prima, Serif, Lavigne, Morvan and Chereau2011; Solonenko et al. Reference Solonenko, Nishiyama, Smirnov, Takana and Jang2015). In addition, cavity-containing droplets may have other potential applications, such as in ink-jet printing, spray forming, lithotripsy (Cleveland & McAteer Reference Cleveland and McAteer2012; Jamaluddin et al. Reference Jamaluddin, Ball, Turangan and Leighton2011) and sonoporation (Ohl et al. Reference Ohl, Arora, Ikink, De Jong, Versluis, Delius and Lohse2006; Stewart, Langer & Jensen Reference Stewart, Langer and Jensen2018), because of their controllable weight and embedded medium.
The droplet dynamics in a high-speed impinging process is different from that in a low-speed process (Haller et al. Reference Haller, Ventikos, Poulikakos and Monkewitz2002, Reference Haller, Poulikakos, Ventikos and Monkewitz2003). Theoretical and experimental works have been conducted to investigate the high-speed impingement of dense liquid droplets (Rein Reference Rein1993; Klinkov, Kosarev & Rein Reference Klinkov, Kosarev and Rein2005; Li et al. Reference Li, Liao, Li, Li, Coddet and Wang2006). Such high-speed droplet impact on a wall can induce significant erosion of the wall (Xiong, Koshizuka & Sakai Reference Xiong, Koshizuka and Sakai2010, Reference Xiong, Koshizuka and Sakai2011; Xiong et al. Reference Xiong, Koshizuka, Sakai and Ohshima2012), due to the impinging shock wave, usually called a water-hammer shock wave (Cook Reference Cook1928). Heymann (Reference Heymann1969) presented a theoretical formulation of the strength of the water-hammer shock wave for liquid high-speed impingement on a solid wall. Experimental investigations (Camus Reference Camus1971; Field, Lesser & Dear Reference Field, Lesser and Dear1985; Field, Dear & Ogren Reference Field, Dear and Ogren1989) were conducted to understand the complicated flow characteristics, where both the water-hammer shock wave and reflected rarefaction waves were observed through the use of high-speed photography. Through a numerical simulation (Sanada et al. Reference Sanada, Watanabe, Shirota, Yamase and Saito2008; Sanada, Ando & Colonius Reference Sanada, Ando and Colonius2011; Kondo & Ando Reference Kondo and Ando2016; Niu & Wang Reference Niu and Wang2016), the complicated waves generated inside a droplet were analysed. Because of the water-hammer shock wave and the resulting complex wave structures inside a droplet, the compressibility of the liquid droplet has to be considered, which was emphasized by Haller et al. (Reference Haller, Ventikos, Poulikakos and Monkewitz2002, Reference Haller, Poulikakos, Ventikos and Monkewitz2003). These studies of the high-speed solid droplet impaction process paved the way for further research on the impingement of heterogeneous hollow droplets embedded with various media.
It is necessary to obtain a clear understanding of the evolution dynamics of hollow droplets under high-speed impact. However, to the best of the authors’ knowledge, only two experimental study cases have been performed, in which visualizations showed the impingement of a liquid hollow droplet embedded with a gas cavity on a flat wall under low-speed impact (Gulyaev et al. Reference Gulyaev, Solonenko, Gulyaev and Smirnov2009; Gulyaev & Solonenko Reference Gulyaev and Solonenko2013). Numerical simulations were carried out for the impingement process with only the incompressible model (Kumar, Gu & Kamnis Reference Kumar, Gu and Kamnis2012; Kumar et al. Reference Kumar, Gu, Tabbara and Kamnis2013), which suited only the low-speed cases. In both the experimental and numerical works, the deformation of the hollow droplet and the formation of a centre jet were observed. The interaction of the impinging shock wave, as observed for the high-speed impacted droplet, with the embedded cavity could not be studied. Cavity collapse triggered by a planar shock in the infinite liquid region has been studied (Shima et al. Reference Shima, Takayama, Tomita and Ohsawa1983; Shima, Tomita & Takahashi Reference Shima, Tomita and Takahashi1984; Bourne & Field Reference Bourne and Field1992; Ball et al. Reference Ball, Howell, Leighton and Schofield2000; Sankin et al. Reference Sankin, Simmons, Zhu and Zhong2005; Turangan et al. Reference Turangan, Jamaluddin, Ball and Leighton2008; Hawker & Ventikos Reference Hawker and Ventikos2012; Lauer et al. Reference Lauer, Hu, Hickel and Adams2012; Betney et al. Reference Betney, Tully, Hawker and Ventikos2015; Magaletti et al. Reference Magaletti, Gallo, Marino and Casciola2016), the dynamics of which was different from that of a cavity collapsing with a confined liquid region. Because of the highly transient process and severe deformation of the cavity in a droplet, it is challenging to observe the impacted hollow droplet and visualize the detailed flow field during the high-speed impact in experiments. Therefore, further numerical simulations of the high-speed impact of droplets embedded with a cavity are needed.
In order to consider the compressibility of liquid, both accurate two-phase models (Johnsen & Colonius Reference Johnsen and Colonius2006; Coralic & Colonius Reference Coralic and Colonius2014) and numerical strategy are used to capture two-phase interface and ensure the stability of the simulation (Saurel & Abgrall Reference Saurel and Abgrall1999). As shown, the embedded gas media have a great influence on the flow dynamics of hollow droplets (Gulyaev Reference Gulyaev2015). For a vapour cavity in a droplet, the phase transition process must be triggered and therefore the adaptable phase transformation model is needed for the simulation study. The main objective of the present study is to understand the evolution mechanism of the impingement of high-speed hollow cylindrical droplets through the use of numerical simulations. The study will consider several aspects:
(i) The compressibility of the two phases and the phase transition process are considered. Hence, the dynamics of the droplet and embedded cavity will be captured more realistically.
(ii) The intensity sources of jets and collapsing waves inside the hollow cylindrical droplets are explained. The collapsing mechanisms of different embedded air/vapour cavities will be revealed in detail.
(iii) With the consideration of radius ratios and different impinging speeds, the theoretical estimation of characteristic collapse time of the embedded cavity will be formulated.
This paper is thus organized as follows. In § 2, the physical model, governing equations and phase transition modelling, and numerical treatments are presented for the present concerns. In § 3, detailed morphology and dynamical evolutions of two kinds of high-speed impinging cylindrical droplets are analysed qualitatively and quantitatively. In § 4, the influence of the size of the initial embedded cavity and the initial impinging speed is discussed. Finally, conclusions are drawn in § 5.
2 Physical model and numerical methodology
2.1 Physical model
With consideration of the computational cost and fluid physics, a two-dimensional problem will be simulated in the present study. The hollow cylindrical droplet is regarded as a cylindrical liquid column embedded with a cavity at its centre, as shown in figure 1. The water column centre (
 $C$
), initial impinging point (
 $O$
), upside surface of the cylindrical droplet (USD), downside surface of the cylindrical droplet (DSD), upside surface of the cavity (USC) and downside surface of the cavity (DSC) are depicted in figure 1.
The initial radius of the cylindrical droplet is
 $R_{0}$
, and the initial radius of the embedded central cavity is
 $r_{0}$
. Here,
 $R_{0}$
is taken as 5 mm for all cases, and
 $r_{0}$
ranges from 0 to
 $0.5R_{0}$
. The initial instant begins when the liquid column just touches the rigid wall at the initial impinging point (
 $O$
) and moves towards the wall vertically with initial impinging speed
 $V_{0}$
. In this work, the initial impinging speed
 $V_{0}$
ranges from 50 to
 $200~\text{m}~\text{s}^{-1}$
. The dimensionless parameters of the Reynolds number, Weber number and Froude number are all larger than the order of
 $10^{4}$
, which means the effects of viscosity, surface tension and gravity can all neglected compared with the inertial effect for the present study, and the problem can be regarded as a size-independent one under the present conditions. Also, the evolution process considered in the present work mainly focuses on the initial kinematic stage (
 $t(V_{0}/D_{0})\leqslant 0.2$
), which is certainly dominated by the droplet inertia (Yarin Reference Yarin2006), and hence the influence of wettability can also be ignored in this study (Rioboo, Marengo & Tropea Reference Rioboo, Marengo and Tropea2002).
Schematic diagram of the high-speed liquid column impingement problem.

2.2 Governing equations
For compressible two-phase flow involving phase transition, the governing equations consist of the Euler equations and the scalar transportation equations for the volume fraction. Referring to Saurel, Petitpas & Abgrall (Reference Saurel, Petitpas and Abgrall2008), the governing equations read as
 $$\begin{eqnarray}\displaystyle & \displaystyle \frac{\unicode[STIX]{x2202}\unicode[STIX]{x1D6FC}_{k}\unicode[STIX]{x1D70C}_{k}}{\unicode[STIX]{x2202}t}+\unicode[STIX]{x1D735}\boldsymbol{\cdot }(\unicode[STIX]{x1D6FC}_{k}\unicode[STIX]{x1D70C}_{k}\boldsymbol{u})={\dot{S}}_{\unicode[STIX]{x1D70C},k},\quad k=1,\ldots ,K, & \displaystyle\end{eqnarray}$$
 $$\begin{eqnarray}\displaystyle & \displaystyle \frac{\unicode[STIX]{x2202}(\unicode[STIX]{x1D70C}\boldsymbol{u})}{\unicode[STIX]{x2202}t}+\unicode[STIX]{x1D735}\boldsymbol{\cdot }(\unicode[STIX]{x1D70C}\boldsymbol{u}\otimes \boldsymbol{u}+p\unicode[STIX]{x1D644})=0, & \displaystyle\end{eqnarray}$$
 $$\begin{eqnarray}\displaystyle & \displaystyle \frac{\unicode[STIX]{x2202}E}{\unicode[STIX]{x2202}t}+\unicode[STIX]{x1D735}\boldsymbol{\cdot }[(E+p)\boldsymbol{u}]=0, & \displaystyle\end{eqnarray}$$
 $$\begin{eqnarray}\displaystyle & \displaystyle \frac{\unicode[STIX]{x2202}\unicode[STIX]{x1D6FC}_{k}}{\unicode[STIX]{x2202}t}+\boldsymbol{u}\boldsymbol{\cdot }\unicode[STIX]{x1D735}\unicode[STIX]{x1D6FC}_{k}={\dot{S}}_{\unicode[STIX]{x1D6FC},k},\quad k=1,\ldots ,K-1, & \displaystyle\end{eqnarray}$$
 $\unicode[STIX]{x1D70C}$
is the density,
 $p$
is the pressure,
 $\boldsymbol{u}$
is the velocity,
 $\unicode[STIX]{x1D644}$
is the unit tensor,
 $E=\unicode[STIX]{x1D70C}e+(\unicode[STIX]{x1D70C}\boldsymbol{u}^{2})/2$
is the total energy and
 $e$
is the internal specific energy of the fluid. Parameters
 $\unicode[STIX]{x1D6FC}_{k}$
,
 $\unicode[STIX]{x1D70C}_{k}$
and
 $\unicode[STIX]{x1D6FC}_{k}\unicode[STIX]{x1D70C}_{k}$
represent the volume fraction, the density and the volume mass of component
 $k$
, respectively. The saturation constraint of the volume fraction yields
 $\unicode[STIX]{x1D6FC}_{K}=1-\sum _{k=1}^{K-1}\unicode[STIX]{x1D6FC}_{k}$
. In the present work, three components are included; the subscripts
 $k$
can be 1, 2 and 3, which represent the vapour, liquid and air, respectively.
The source terms
 ${\dot{S}}_{\unicode[STIX]{x1D70C},k}$
and
 ${\dot{S}}_{\unicode[STIX]{x1D6FC},k}$
on the right-hand side of (2.1a
) describe the transfer of volume mass and volume fraction, respectively, related to the phase transition of component
 $k$
, which can be respectively expressed as
 $$\begin{eqnarray}{\dot{S}}_{\unicode[STIX]{x1D70C},1}={\dot{m}}=\unicode[STIX]{x1D708}(g_{2}-\unicode[STIX]{x1D707}_{1}),\quad {\dot{S}}_{\unicode[STIX]{x1D70C},2}=-{\dot{m}}=\unicode[STIX]{x1D708}(\unicode[STIX]{x1D707}_{1}-g_{2}),\quad {\dot{S}}_{\unicode[STIX]{x1D70C},3}=0,\end{eqnarray}$$
 $$\begin{eqnarray}{\dot{S}}_{\unicode[STIX]{x1D6FC},k}=\frac{{\dot{m}}}{\unicode[STIX]{x1D71A}_{k}}=\frac{\unicode[STIX]{x1D708}}{\unicode[STIX]{x1D71A}_{k}}(g_{2}-\unicode[STIX]{x1D707}_{1}),\quad k=1,2,\end{eqnarray}$$
where
 $\unicode[STIX]{x1D708}$
 $({\geqslant}0)$
is the relaxation parameter for the chemical potential,
 $g_{2}$
is the Gibbs free energy of the liquid phase and
 $\unicode[STIX]{x1D707}_{1}$
is the chemical potential of the vapour phase. In the present study, the parameter
 $\unicode[STIX]{x1D708}$
is taken as infinite if the phase transition condition is satisfied, otherwise it is zero. Therefore, the model is free of this parameter. Formulas for the parameters
 $\unicode[STIX]{x1D71A}_{k}$
can be found in Zein, Hantke & Warnecke (Reference Zein, Hantke and Warnecke2010, Reference Zein, Hantke and Warnecke2013). The explicit explanation of these source terms can be found in Han, Hantke & Müller (Reference Han, Hantke and Müller2017).
Because the interface will spread over a few cells due to numerical diffusion, following (Saurel et al. Reference Saurel, Petitpas and Abgrall2008), in this diffuse region, the mixture fluid variables are given as
 $$\begin{eqnarray}\displaystyle & \displaystyle \unicode[STIX]{x1D70C}=\mathop{\sum }_{k=1}^{K}\unicode[STIX]{x1D6FC}_{k}\unicode[STIX]{x1D70C}_{k}, & \displaystyle\end{eqnarray}$$
 $$\begin{eqnarray}\displaystyle & \displaystyle \unicode[STIX]{x1D70C}e=\mathop{\sum }_{k=1}^{K}\unicode[STIX]{x1D6FC}_{k}\unicode[STIX]{x1D70C}_{k}e_{k}, & \displaystyle\end{eqnarray}$$
 $$\begin{eqnarray}\displaystyle & \displaystyle p=\frac{\unicode[STIX]{x1D70C}e-\displaystyle \mathop{\sum }_{k=1}^{K}\unicode[STIX]{x1D6FC}_{k}\unicode[STIX]{x1D70C}_{k}q_{k}-\mathop{\sum }_{k=1}^{K}\frac{\unicode[STIX]{x1D6FC}_{k}\unicode[STIX]{x1D6FE}_{k}p_{\infty ,k}}{\unicode[STIX]{x1D6FE}_{k}-1}}{\displaystyle \mathop{\sum }_{k=1}^{K}\frac{\unicode[STIX]{x1D6FC}_{k}}{\unicode[STIX]{x1D6FE}_{k}-1}}, & \displaystyle\end{eqnarray}$$
 $$\begin{eqnarray}\displaystyle & \displaystyle c=\sqrt{\mathop{\sum }_{k=1}^{K}\frac{\unicode[STIX]{x1D6FC}_{k}\unicode[STIX]{x1D70C}_{k}}{\unicode[STIX]{x1D70C}}c_{k}^{2}}. & \displaystyle\end{eqnarray}$$
In the present study, the fluid thermodynamic state is described by the stiffened gas equation of state (Menikoff & Plohr Reference Menikoff and Plohr1989; Saurel et al. Reference Saurel, Petitpas and Abgrall2008), which is
 $$\begin{eqnarray}\displaystyle & \displaystyle e_{k}(p,\unicode[STIX]{x1D70C}_{k})=\frac{p+\unicode[STIX]{x1D6FE}_{k}p_{\infty ,k}}{\unicode[STIX]{x1D70C}_{k}(\unicode[STIX]{x1D6FE}_{k}-1)}+q_{k}, & \displaystyle\end{eqnarray}$$
 $$\begin{eqnarray}\displaystyle & \displaystyle \unicode[STIX]{x1D70C}_{k}(p,T)=\frac{p+p_{\infty ,k}}{C_{v,k}T(\unicode[STIX]{x1D6FE}_{k}-1)}, & \displaystyle\end{eqnarray}$$
 $$\begin{eqnarray}\displaystyle & \displaystyle c_{k}(p,\unicode[STIX]{x1D70C}_{k})=\sqrt{\frac{(\,p+p_{\infty ,k})\unicode[STIX]{x1D6FE}_{k}}{\unicode[STIX]{x1D70C}_{k}}}, & \displaystyle\end{eqnarray}$$
 $$\begin{eqnarray}\displaystyle & \displaystyle h_{k}(T)=\unicode[STIX]{x1D6FE}_{k}C_{v,k}T+q_{k}, & \displaystyle\end{eqnarray}$$
 $$\begin{eqnarray}\displaystyle & \displaystyle g_{k}(p,T)=(C_{v,k}\unicode[STIX]{x1D6FE}_{k}-q_{k}^{\prime })T-C_{v,k}T\log \frac{T^{\unicode[STIX]{x1D6FE}_{k}}}{(p+p_{\infty ,k})^{\unicode[STIX]{x1D6FE}_{k}-1}}+q_{k}, & \displaystyle\end{eqnarray}$$
 $$\begin{eqnarray}\displaystyle & \displaystyle \unicode[STIX]{x1D707}_{1}(T,g_{1},\unicode[STIX]{x1D6FC}_{1},\unicode[STIX]{x1D6FC}_{2})=g_{1}+(\unicode[STIX]{x1D6FE}_{1}-1)C_{v,1}T\log \frac{\unicode[STIX]{x1D6FC}_{1}}{1-\unicode[STIX]{x1D6FC}_{2}}, & \displaystyle\end{eqnarray}$$
where
 $\unicode[STIX]{x1D6FE}_{k}$
is the specific heat ratio,
 $p_{\infty ,k}$
is the material parameter with pressure dimension,
 $C_{v,k}$
is the specific heat capacity at constant volume,
 $q_{k}$
is the heat of formation and
 $q_{k}^{\prime }$
is the entropy constant of component
 $k$
. The corresponding values of these parameters are listed in table 1.
Parameters involved in the stiffened gas equation of state, taken from Han et al. (Reference Han, Hantke and Müller2017).

2.3 Numerical procedure
2.3.1 Method of solution
Here, the finite volume method is used to discretize governing equations (2.1a ). A fifth-order incremental-stencil weighted essentially non-oscillatory scheme (Wang, Xiang & Hu Reference Wang, Xiang and Hu2018) is applied to ensure computational stability for the spatial reconstructions. In order to solve the Riemann problem at the cell edges, a Godunov-type Harten–Lax–van Leer contact approximate Riemann solver (Toro Reference Toro2013) is used to obtain the numerical flux. A third-order total variation diminishing Runge–Kutta scheme (Gottlieb & Shu Reference Gottlieb and Shu1998) is used for time marching. Uniform grids and constant Courant–Friedrich–Lewis number, taken as 0.4, are used for all the computation cases. The treatment of the source terms related to the phase transition on the right-hand side of the system is decoupled with the hyperbolic operator (Saurel et al. Reference Saurel, Petitpas and Abgrall2008).
The condition that triggers the phase transition of vapour to liquid is determined by
 $p>p_{sat}(T)$
. Here,
 $p_{sat}(T)$
is the saturated pressure at temperature
 $T$
. When the phase transition condition is fulfilled, an instantaneous relaxation process is used to achieve local thermodynamic equilibrium (i.e.
 $\unicode[STIX]{x1D707}_{1}=g_{2}$
) realizing the phase transition. For detailed derivations, the reader is referred to Han et al. (Reference Han, Hantke and Müller2017). The numerical verification of grid sensitivity is given in appendix A. The Rayleigh collapse of a two-dimensional vapour bubble is simulated to compare with both the experimental and the theoretical results, which is presented in appendix A. The present numerical models and treatments are ready for the following study.
2.3.2 Boundary conditions and initialization
The slip wall condition is used for the bottom boundary of the computational domain, while the non-reflection boundary conditions are applied for the remaining boundaries. The initial speed of the liquid column and the initial radius and the inside medium of the cavity are specified on a case-by-case basis. The initial thermodynamic state of the computation area for each region is given in table 2, where the vapour inside the vapour cavity is initially in the saturated state. The initial static pressure of liquid water is taken as
 $1.01325\times 10^{5}~\text{Pa}$
, denoted as
 $p_{0}$
.
Initial thermodynamic state for the computation cases.

3 Dynamic analysis of droplets embedded with different cavities
In the present work, numerical studies of the impingement of two kinds of high-speed hollow cylindrical droplets are conducted to investigate the physical mechanism during impact. The droplets are embedded with an air cavity and a vapour cavity at the droplet centre. In the following analysis, the original time point is taken as when the droplet just touches the rigid wall.
3.1 The entire evolution
Numerical results of the evolution of the impinging hollow cylindrical droplets with an initial speed of
 $150~\text{m}~\text{s}^{-1}$
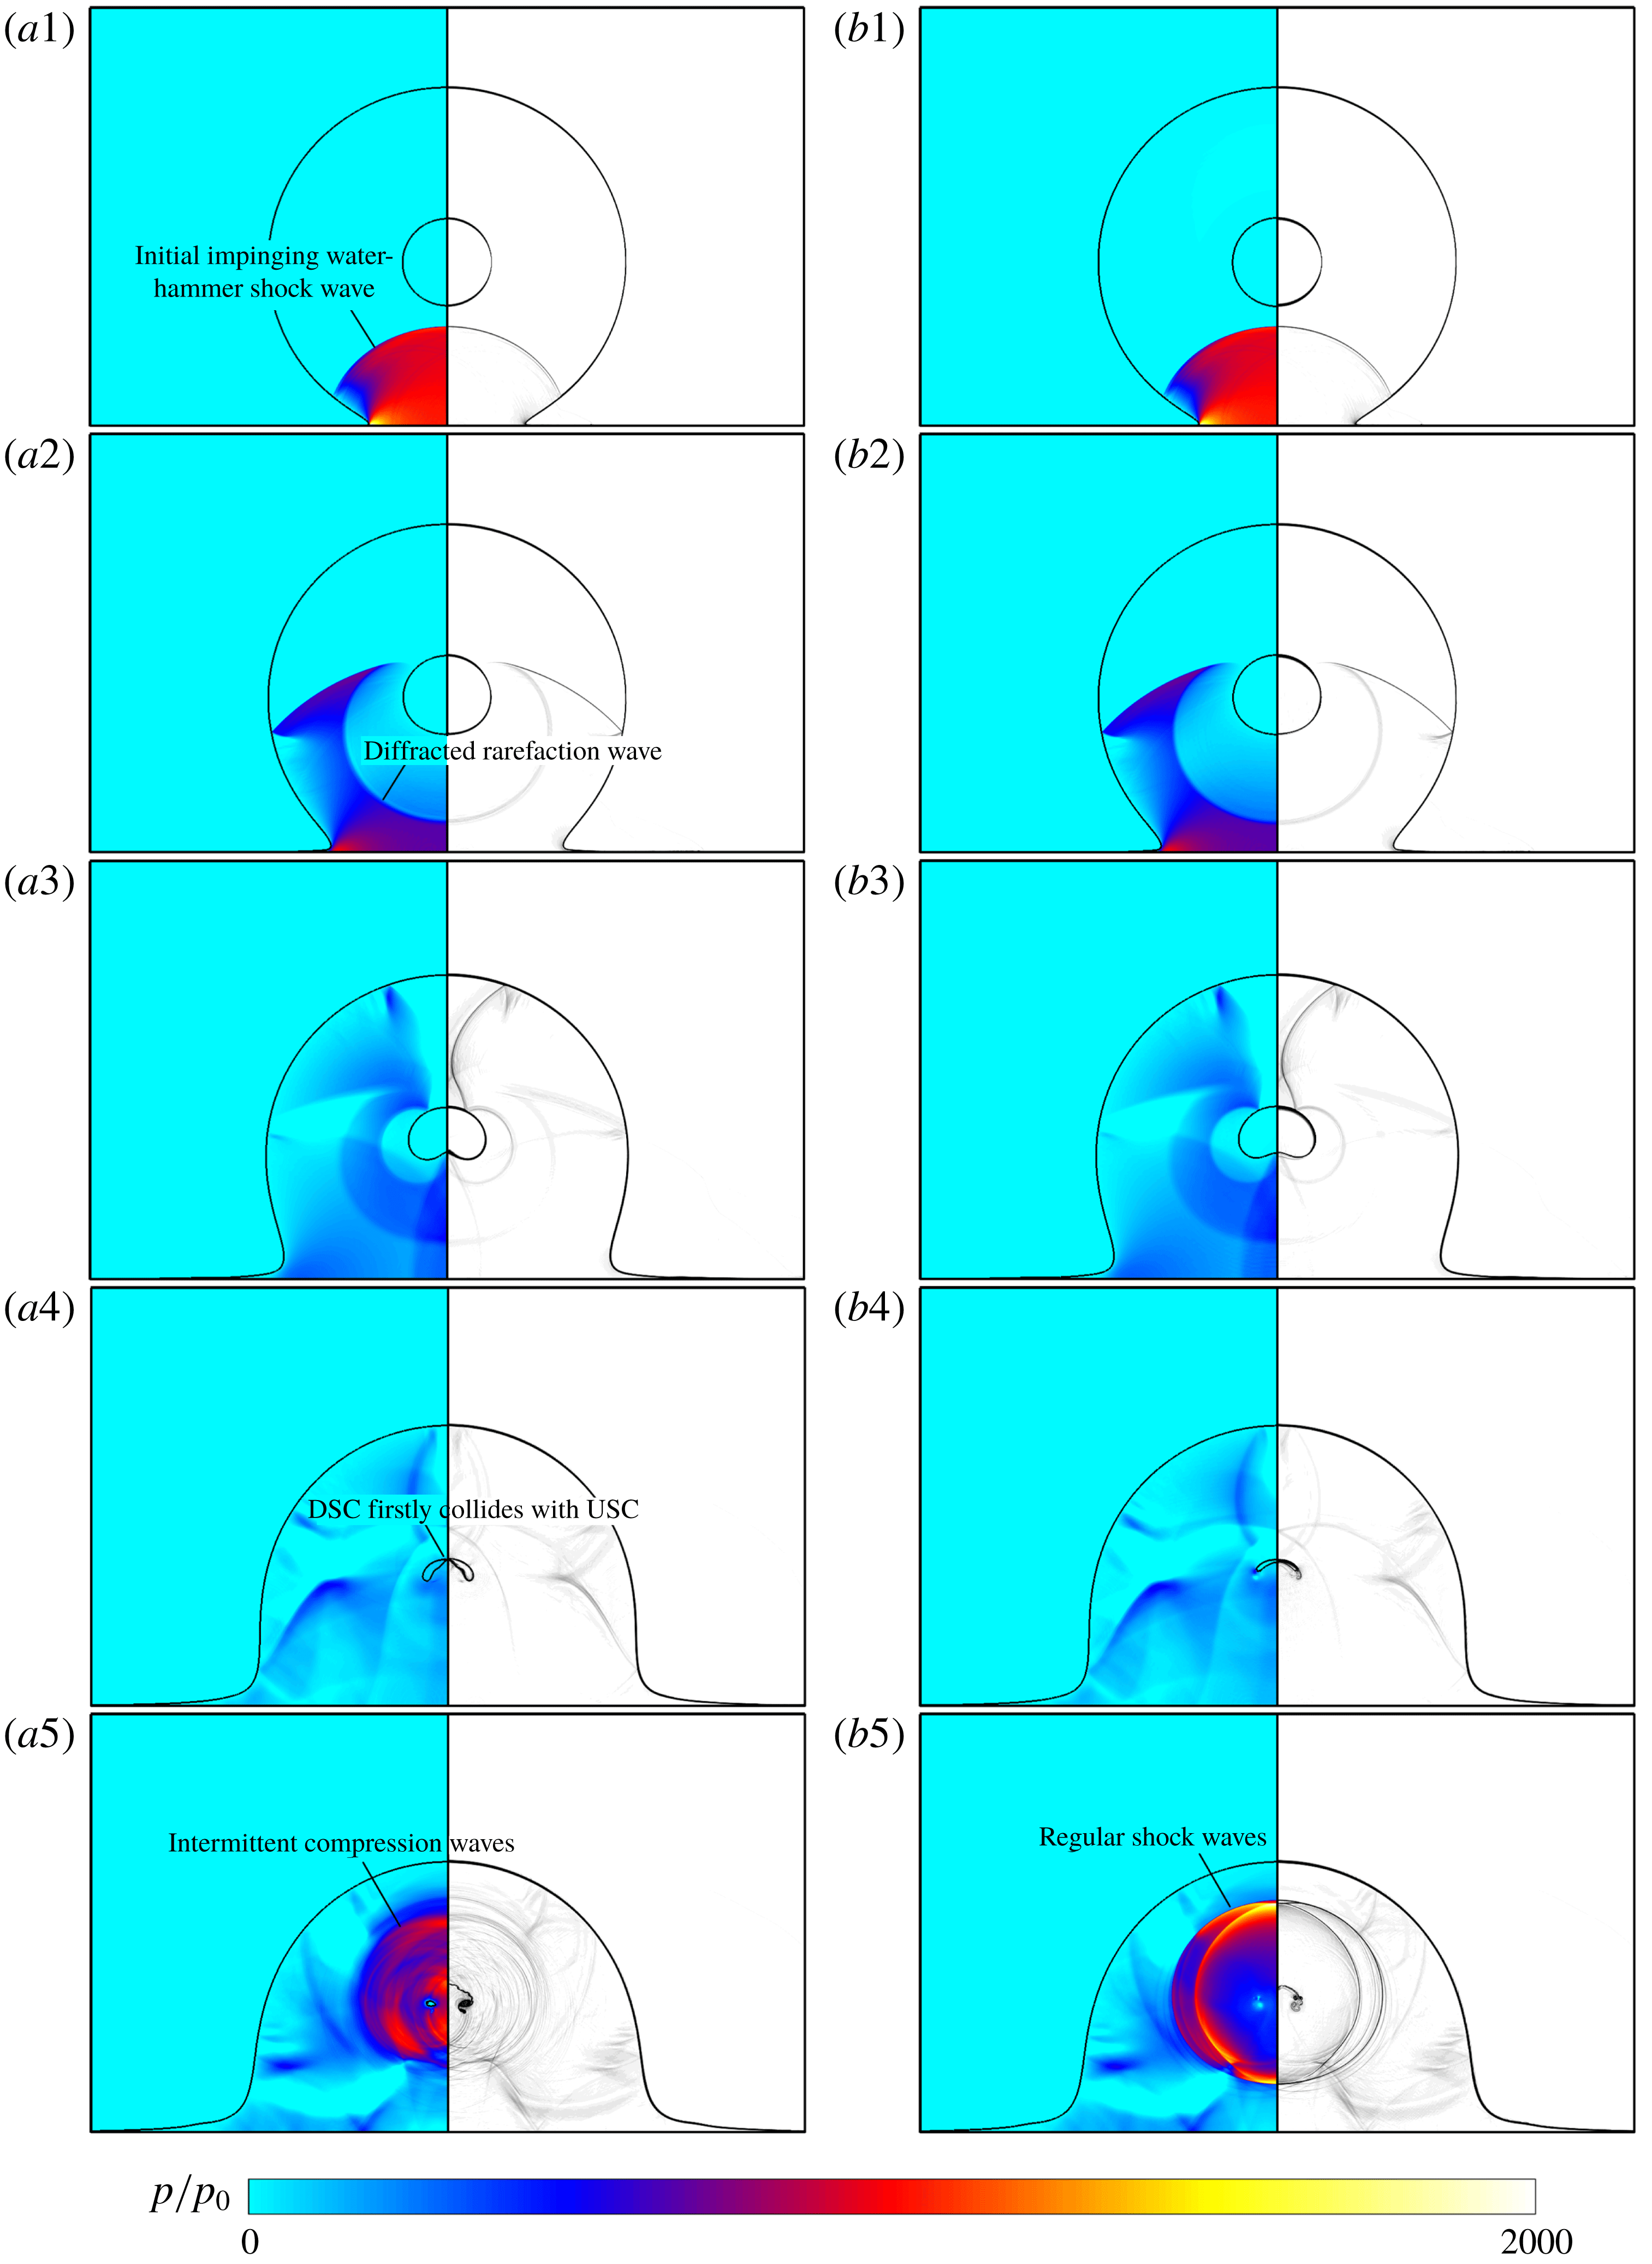
are shown in figure 2. Figure 2(a) presents the cylindrical droplet embedded with an air cavity, and figure 2(b) that embedded with a vapour cavity. The initial radii of the embedded cavities are both
 $0.25R_{0}$
. The two contours in each row are related to the same instants: (1)
 $t/(D_{0}/c_{l})=0.30$
, (2)
 $t/(D_{0}/c_{l})=0.60$
, (3)
 $t/(D_{0}/c_{l})=1.29$
, (4)
 $t/(D_{0}/c_{l})=1.98$
and (5)
 $t/(D_{0}/c_{l})=2.27$
.
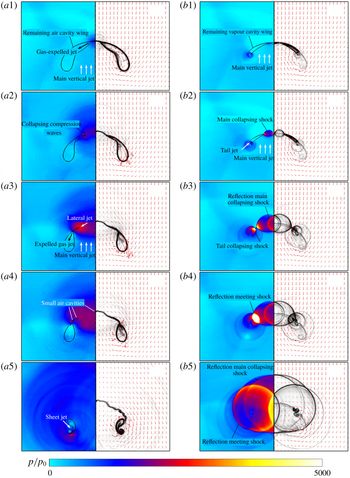
As shown in figure 2 for the numerical results of both cases, a confined shock wave is generated once the high-speed droplets impact the rigid wall and then sweeps the water columns from bottom to top. Here the confined shock wave can be effectively regarded as the impinging water-hammer shock, because the physical mechanism of generation is the same. When the shock wave propagates to the cavity, the cavity is impacted by the shock wave and the shock wave is diffracted over the interface. When the DSC collides with the USC, the collision instant is called the collapsing time
 $t_{collapse}$
in this study. At this moment, it is seen that the geometric shape of the air cavity is different from that of the vapour cavity, as shown in figure 2(a4,b4). Furthermore, the impacted cavity will collapse, as shown in figure 2(a5,b5). For the droplet embedded with an air cavity, a series of intermittent compression waves expand inside, while for that embedded with a vapour cavity, several regular shock waves are observed, whose strength is greater than that of the compression waves during the air cavity collapse. The variation in collapsing time will be analysed in the next section.
To understand the flow dynamics, the wave structures and the pressure on the rigid wall during the evolution procedure, the morphology and dynamics of the high-speed impacted droplets are analysed qualitatively and quantitatively and are presented next.
Numerical results of the impingement of two kinds of hollow cylindrical droplets, which are embedded with (a) an air cavity and (b) a vapour cavity having an initial radius of
 $0.25R_{0}$
, with initial impaction speed of
 $150~\text{m}~\text{s}^{-1}$
. The two contours in each row are related to the same instants: (1)
 $t/(D_{0}/c_{l})=0.30$
, (2)
 $t/(D_{0}/c_{l})=0.60$
, (3)
 $t/(D_{0}/c_{l})=1.29$
, (4)
 $t/(D_{0}/c_{l})=1.98$
and (5)
 $t/(D_{0}/c_{l})=2.27$
, and at each instant, numerical results of both the pressure contour (left half of each frame) and the density schlieren image (right half of each frame) are shown.

Once the high-speed liquid impacts the wall, the initial impinging water-hammer shock wave is generated due to the compressible behaviour of the liquid, which was first inferred by Cook (Reference Cook1928). Because the droplet is of a cylindrical shape, in the early stage of high-speed droplet impingement, the periphery of the contact region between the droplet and the rigid wall, also called the contact periphery, expands very quickly on the wall, and the impinging water-hammer shock front cannot overtake the contact periphery. Due to the deceleration of the expanding contact periphery, the water-hammer shock will finally overtake it. Some investigations have been conducted to study the evolution dynamics of this early stage (Heymann Reference Heymann1969; Haller et al. Reference Haller, Poulikakos, Ventikos and Monkewitz2003; Mandre, Mani & Brenner Reference Mandre, Mani and Brenner2009; Xiong et al. Reference Xiong, Koshizuka and Sakai2010, Reference Xiong, Koshizuka, Sakai and Ohshima2012), including the formation mechanism of the water-hammer shock front, determination of the instant when the shock envelope overtakes the contact periphery and the distribution of the pressure on the wall. After the impinging water-hammer shock overtakes the contact region and moves up to the free surface of the cylindrical droplet, its ending sides are reflected by the droplet interface, and the reflected rarefaction waves ensure pressure balance over the interface, as shown in figure 2(a1,b1). Meanwhile, as shown in the simulation results, the dynamics of the hollow droplets embedded with air and vapour cavities is the same before the shock front interacts with the DSC.
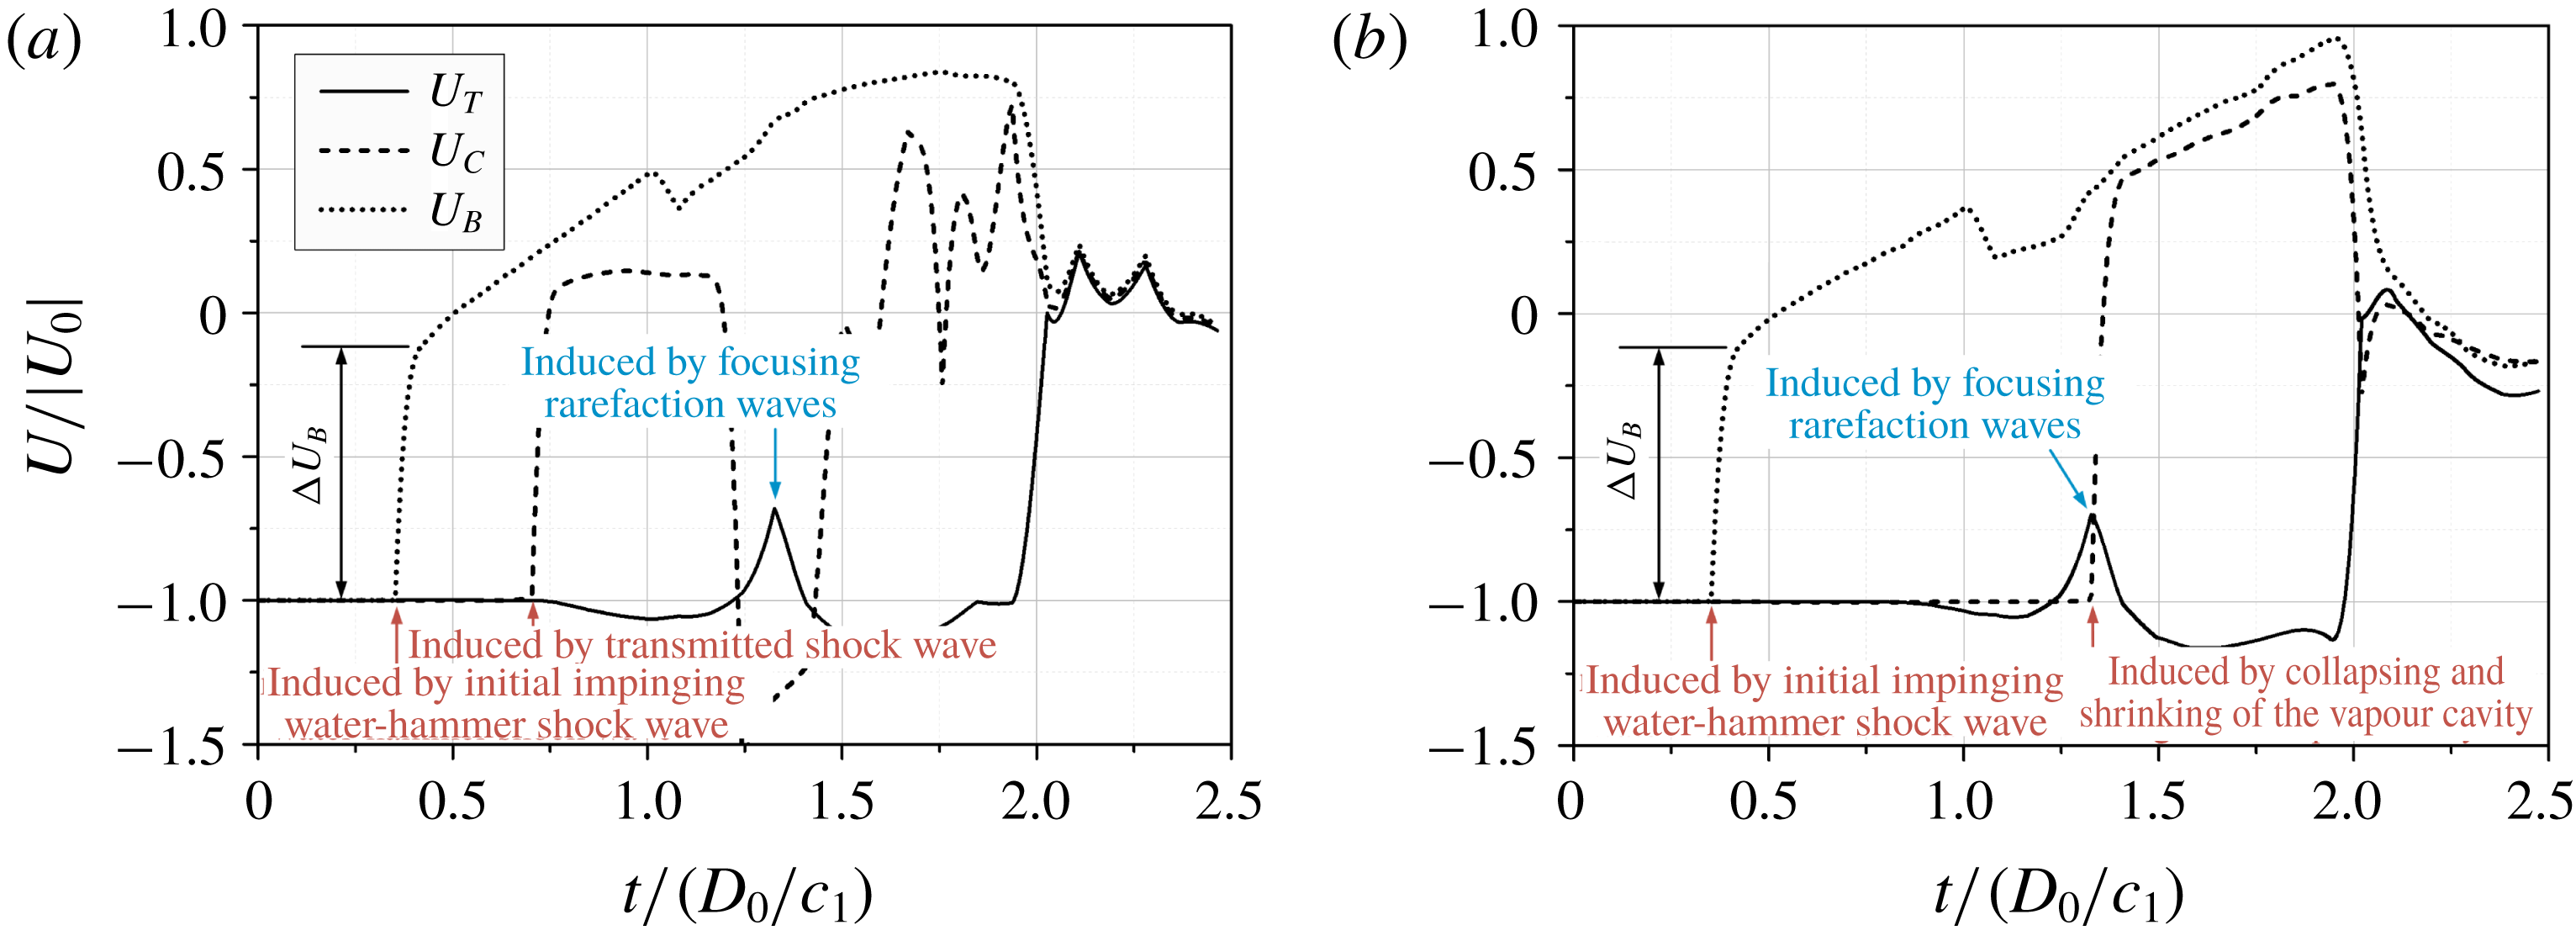
As mentioned earlier, after the impinging water-hammer shock wave interacts with the cavities inside the droplets, the cavity will be highly compressed and will finally collapse. Figure 3 compares the velocity–time variations at three monitoring points for the air cavity and the vapour cavity. These three Lagrange points are initially arranged on the top pole (
 $T$
), the centre point (
 $C$
) and the bottom pole (
 $B$
) of the cavity, as schematically shown in figure 1.
The velocity–time variations at the monitoring points for (a) a cylindrical droplet embedded with an air cavity and (b) a cylindrical droplet embedded with a vapour cavity, in which the dotted line, dashed line and the solid line correspond to the velocity variations at the bottom pole (
 $T$
), centre point (
 $C$
) and top pole (
 $B$
) of the cavities, respectively.

A step arises around
 $t/(D_{0}/c_{l})=0.37$
in both figures 3(a) and 3(b) for the velocity variation at the bottom pole (
 $T$
), where
 $\unicode[STIX]{x0394}U_{B}$
is about
 $130~\text{m}~\text{s}^{-1}$
for both cases. The velocity step is induced by the water-hammer shock wave because at this instant the shock wave just interacts with DSC. Based on the theoretical analysis of the contact discontinuity in the Riemann problem, the interface velocity can be regarded as the velocity of the contact discontinuity when it is impacted by the shock from the side with higher impedance. Referring to Johnsen & Colonius (Reference Johnsen and Colonius2009), since the ratio of acoustic impedance is very large, the interface velocity can be approximately obtained (see § 4.9 in Thompson (Reference Thompson1988)):
 $$\begin{eqnarray}u_{interface}\approx 2\frac{p_{s}-p_{cavity}}{\unicode[STIX]{x1D70C}_{l}c_{l}},\end{eqnarray}$$
where
 $\unicode[STIX]{x1D70C}_{l}$
and
 $c_{l}$
are the density and sound speed of the liquid, respectively;
 $p_{cavity}$
is the initial pressure inside the cavity; and
 $p_{s}$
is the value of the pressure after the shock front when the shock wave just interacts with the cavity. Here
 $p_{s}$
is about 1000
 $p_{0}$
. Because
 $p_{cavity}$
is much smaller than
 $p_{s}$
, the theoretical values of
 $u_{interface}$
for the two cases are quite close, both of them being about
 $130~\text{m}~\text{s}^{-1}$
, which is the same value as
 $\unicode[STIX]{x0394}U_{B}$
at point
 $B$
as shown in figure 3.
For both cases, rarefaction waves are generated due to the diffraction of the shock wave over the two-phase interface. However, the evolutions of flow structures inside the two kinds of cavities are different as shown by the velocity variations at the centre monitoring point
 $C$
(the dashed line) in figure 3. When the air cavity is impacted by a shock wave propagating in the liquid water, the shock wave will transmit inside the air cavity and then the transmitted shock generates. As shown in figure 3(a), at a time around
 $t/(D_{0}/c_{l})=0.7$
, there is a rising step in the velocity variation and this rising step is induced by the acceleration of the transmitted shock wave. At a time around
 $t/(D_{0}/c_{l})=1.2$
, there is a declining step, which is induced by the acceleration in the opposite direction of the reflected transmitted shock coming from the USD. At a time around
 $t/(D_{0}/c_{l})=1.4$
, there is another rising step due to the acceleration of the re-reflected transmitted shock resulting from the further reflection of the reflected transmitted shock from the DSD. Furthermore, due to the influence of the interaction of the complicated wave structures, such as the multi-reflected shock waves and the transmitted rarefaction waves, there are a series of steps in the following velocity–time variation. These complicated wave structures inside the air cavity have only a weak influence on the flow dynamics of the liquid cylindrical droplet, and for similar phenomena one can refer to previous studies of the planar-shock-induced air cavity collapse in liquid (Ball et al.
Reference Ball, Howell, Leighton and Schofield2000; Hawker & Ventikos Reference Hawker and Ventikos2012; Betney et al.
Reference Betney, Tully, Hawker and Ventikos2015).
For the case of the vapour cavity impacted by a shock wave, the flow dynamics inside the vapour cavity is significantly different from that for the case of the air cavity. The vapour is supposed to be in the saturated state in the present study. Once the local pressure of the vapour is higher than the saturated pressure, the saturated vapour will condense into the liquid water instantaneously. Hence, for the present problem, when the shock wave interacts with the vapour cavity, the vapour cavity will rapidly shrink, accompanied by local condensation, and no transmitted shock will be formed. Referring to figure 3(b), for the velocity variation at the centre monitoring point
 $C$
, there is no rising step corresponding to the transmitted shock, reflected transmitted shock wave or other complicated wave structures as in the case of the air cavity. Here, the first rising step in the velocity variation is induced by the shrinking and local condensation of the vapour cavity, when the DSC is transferred to the monitoring point at the instant around
 $t/(D_{0}/c_{l})=1.3$
.
As the impinging water-hammer shock wave propagates along the column surface, it is reflected by the column surface. The reflection generates a series of rarefaction waves. After the shock wave is totally reflected from the USD, the reflected rarefaction waves concentrate and tend to be focused inside the column due to the curved shape of the USD. The numerical results at the focusing instant are seen in figure 2(a3,b3). The influence of focusing rarefaction waves can also be observed in the velocity–time variation at the monitoring point
 $T$
, where a pin-like kink arises at
 $t/(D_{0}/c_{l})=1.29$
; see both figures 3(a) and 3(b). The focusing effects of the reflected rarefaction wave inside the cylindrical droplet had been observed and discussed in previous studies (Chizhov & Schmidt Reference Chizhov and Schmidt2000; Kondo & Ando Reference Kondo and Ando2016). It was known that the focus zone is around the middle symmetry axis at a distance of
 $D_{0}/3$
from the top pole of the cylindrical droplet (Obreschkow et al.
Reference Obreschkow, Dorsaz, Kobel, de Bosset, Tinguely, Field and Farhat2011), and the focusing rarefaction waves will cause high-intensity negative pressure, which may even induce local cavitation (Field et al.
Reference Field, Dear and Ogren1989). In the present work, due to the pre-existence of the embedded cavity, the water-hammer shock wave is partially reflected by the concave cavity interface before it reaches the convex USD, and hence the focusing effect of reflected rarefaction waves is weakened and no cavitation occurs around the focusing zone.
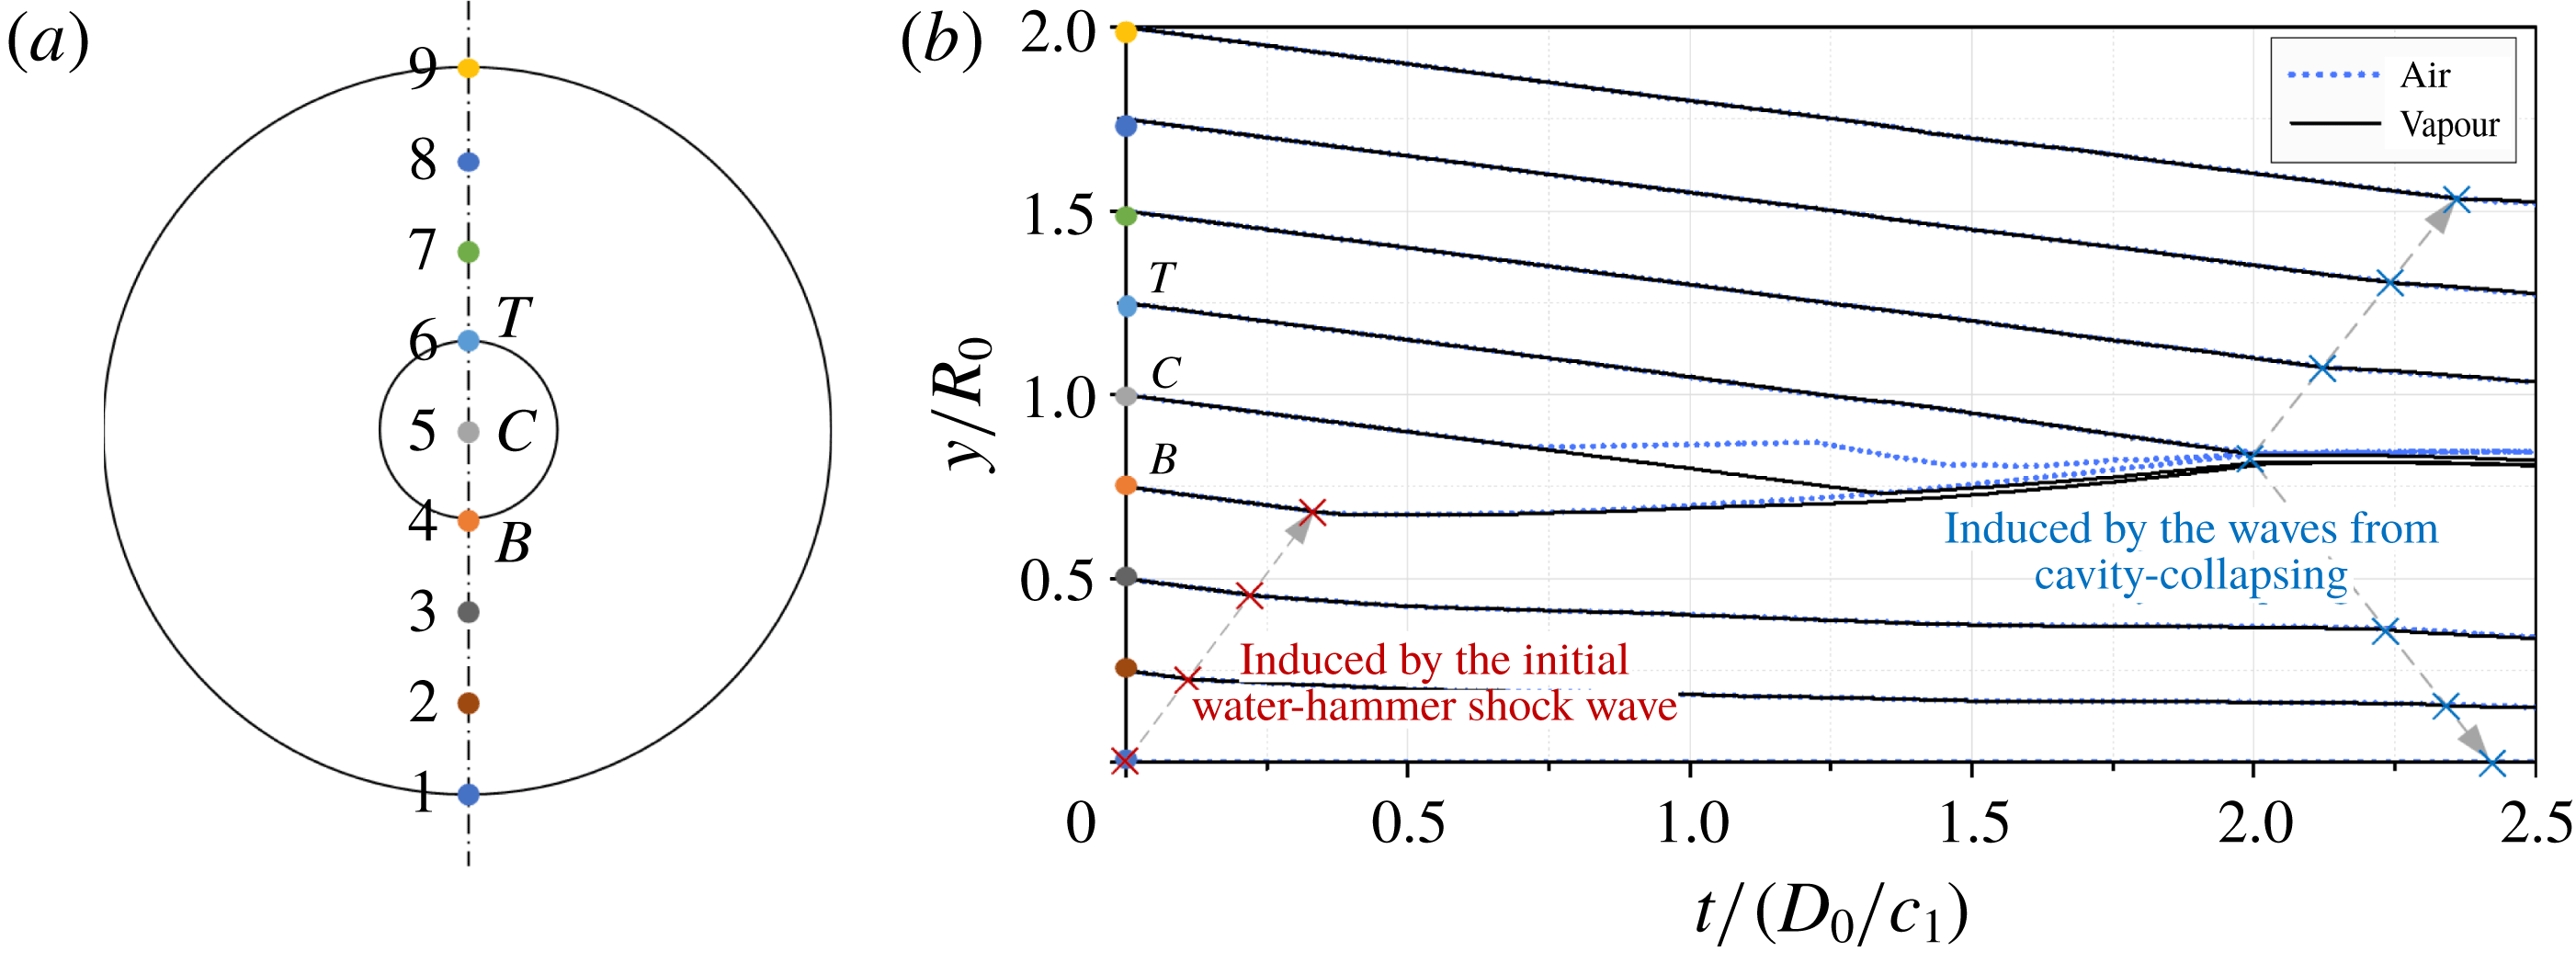
To further compare with the evolution dynamics, nine equally spaced Lagrange points from the bottom pole to the top pole of the droplets are arranged along the
 $y$
-axis. The initial locations of these points are shown schematically in figure 4(a). The numerical results of motion tracks are shown in figure 4(b). Except for the bottom point of the cylindrical droplet (i.e. the initial impinging point), the motion tracks of the other points have the same slope in the beginning, and the slope value is
 $150~\text{m}~\text{s}^{-1}$
, which means the whole cylindrical droplet moves towards the wall with the initial impinging velocity in the beginning for both cases.
A schematic diagram for the location positions (a) and the corresponding numerical results of the motion tracks (b) of nine equally spaced Lagrange points from the bottom pole to the top pole of the cylindrical droplets along the
 $y$
-axis. The dotted lines correspond to the motion tracks of monitoring points for the droplet embedded with the air cavity, and the solid lines correspond to the motion tracks of monitoring points for the droplet embedded with the vapour cavity.

Then, because of the generation and propagation of the water-hammer shock, the fluid velocity will change after the shock front. The turning points (marked by crosses in figure 4) in the motion tracks successively appear when the shock wave sweeps the monitoring points in sequence from bottom to top. The connecting line of the turning points (left-hand dashed arrow in figure 4) for the lower four points is linear with a slope value of about
 $1800~\text{m}~\text{s}^{-1}$
, which corresponds to the propagation velocity of the shock front. The slope of the connecting line of the turning points changes from the fourth monitoring point (point
 $B$
) initially located at the bottom pole of the cavity. After impact by the shock wave, the shape of the cavity begins to deform and the slopes of motion tracks for the monitoring points on the cavity (the fourth, fifth and sixth points) change more obviously. Meanwhile, the motion tracks for the monitoring points on the air cavity begin to be different from those on the vapour cavity after interaction with the shock wave.
As shown in figure 4, for the air cavity, the first turning point for the motion track at the monitoring point
 $C$
occurs at
 $t/(D_{0}/c_{l})=0.7$
, which is related to the instant of the rising velocity step due to the transmitted shock referred to in figure 3(a). After the first turning point, the motion track of this monitoring point has the same slope as that of the monitoring point
 $B$
until the second turning point arrives. This second turning point occurs at around
 $t/(D_{0}/c_{l})=1.2$
, which corresponds to the declining step in the velocity variation induced by the reflected transmitted shock. After that, the slope of the motion track of the monitoring point
 $C$
of the air cavity changes frequently due to the influence of the complicated wave structures, as shown in the velocity–time variation in figure 3(a).
Regarding the motion track at monitoring point
 $C$
of the vapour cavity, the turning point does not occur until the motion track of monitoring point
 $B$
almost intersects the motion track of this point at the instant around
 $t/(D_{0}/c_{l})=1.3$
, as shown in figure 4. As shown in figure 3(b), there is a velocity step at monitoring point
 $C$
at the same instant, which is induced by shrinking accompanied by local condensation of the vapour cavity when the DSC is transferred to this monitoring point. The motion track at monitoring point
 $C$
is very close to the motion track at monitoring point
 $B$
after this turning point, and because the vapour cavity condenses along the shrinking procedure, both of the monitoring points correspond to the flow particles located in liquid phase from then on.
As shown in figure 4, whether in the air cavity or the vapour cavity, there is a turning point at the instant around
 $t/(D_{0}/c_{l})=2.0$
for the motion tracks of monitoring points initially on the cavity (monitoring points
 $B$
,
 $C$
and
 $T$
). This turning point is induced by the collapse of the cavity when the DSC meets the USC, which are also represented in the velocity variations at three monitoring points in figure 3. Meanwhile, the connecting lines of the turning points of the monitoring points inside the cylindrical droplets after
 $t/(D_{0}/c_{l})=2.0$
(right-hand dashed arrows in figure 4) are induced by the waves from cavity collapse. In addition, before the instant
 $t/(D_{0}/c_{l})=2.0$
, there is no turning point in the motion track at monitoring point
 $T$
of the cavity for both cases, which means this monitoring point moves towards the wall with the velocity approximating the initial impinging velocity until the DSC meets the USC.
3.2 Cavity deformation and collapsing
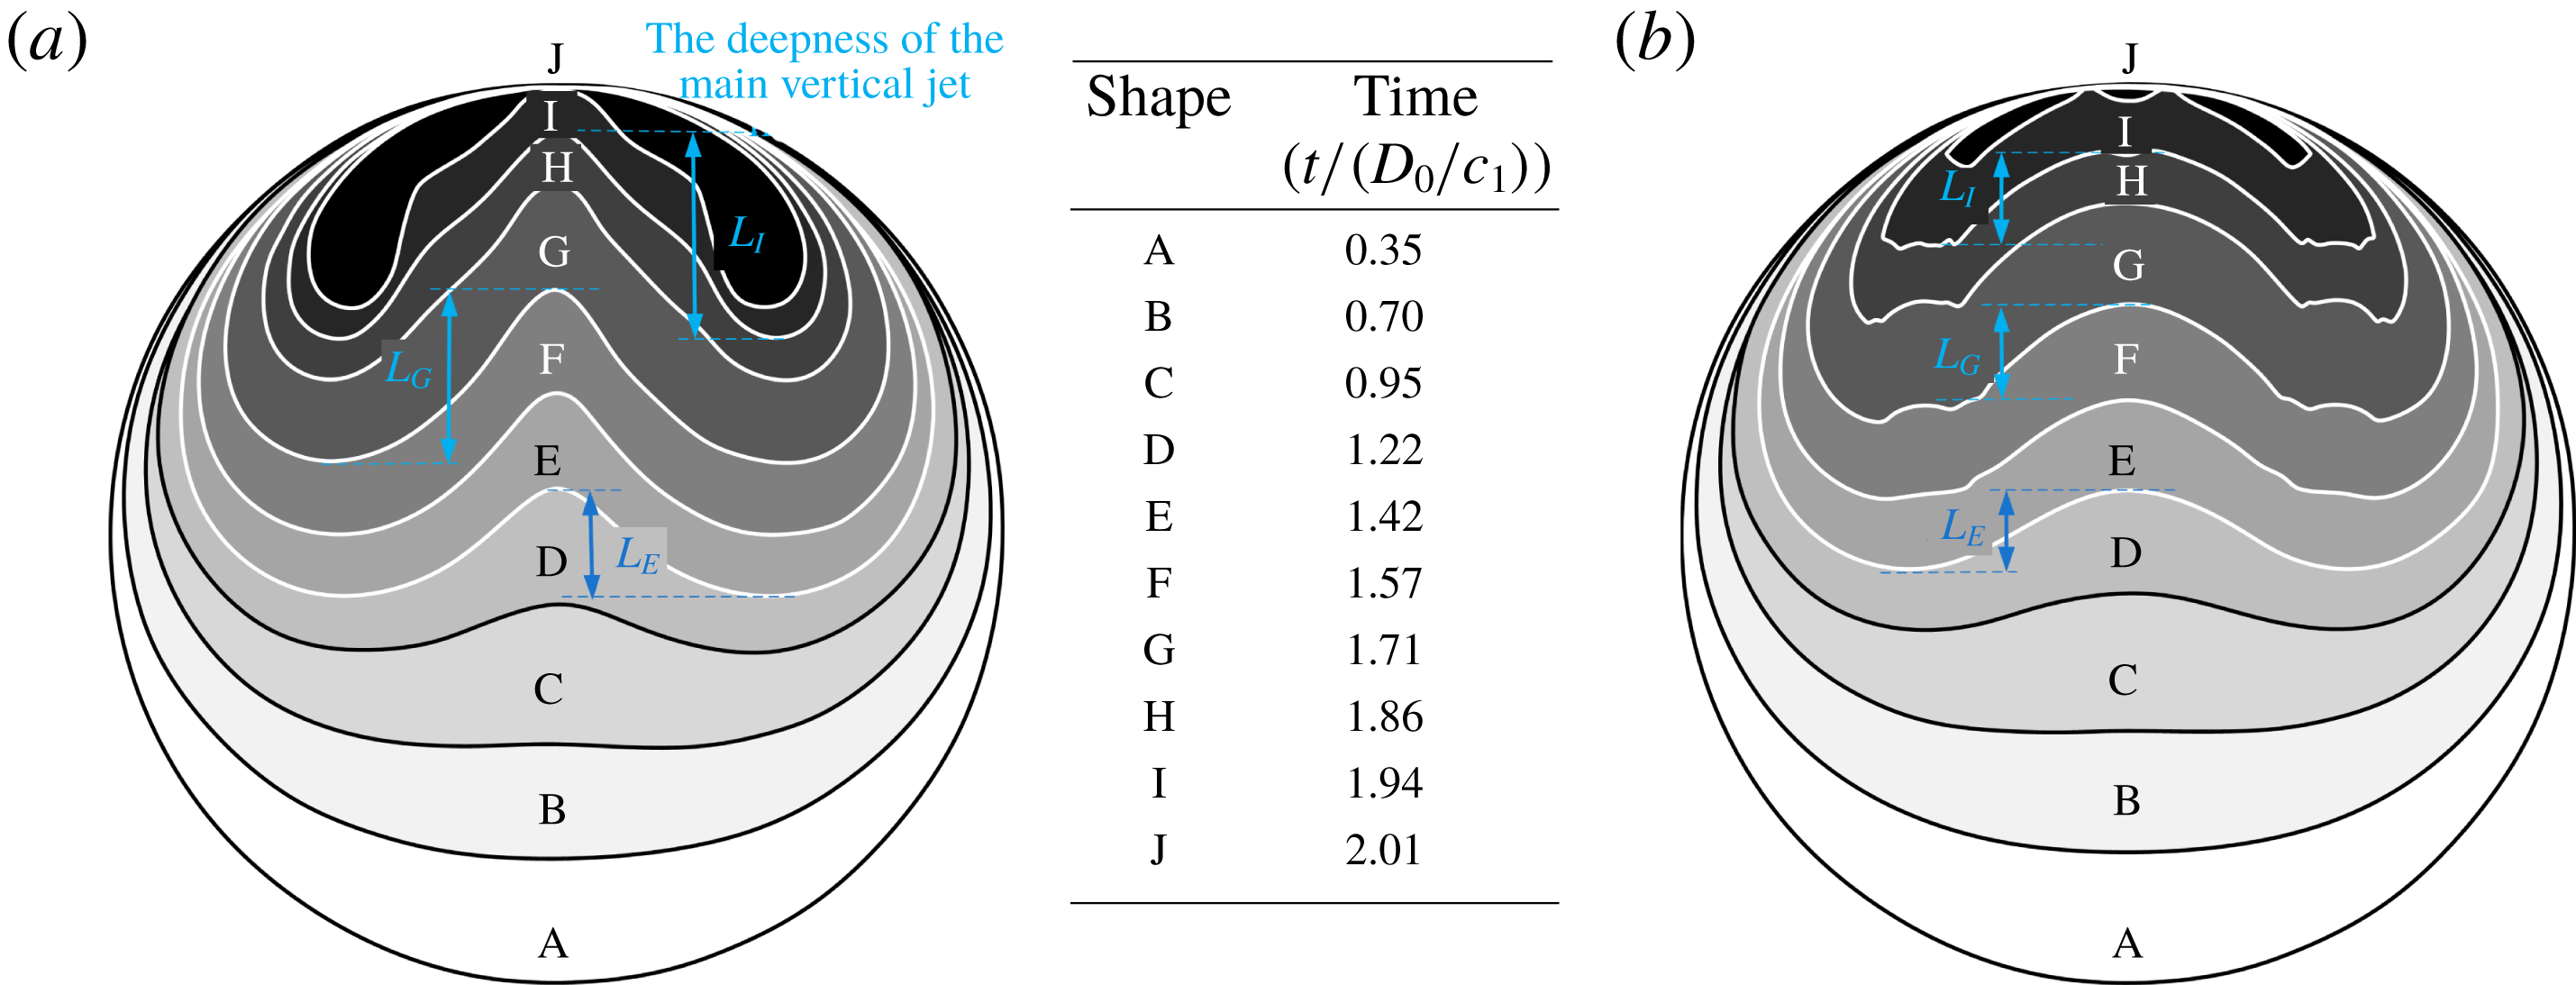
To intuitively understand the deformation and evolution procedure of cavities, the numerical results of the contour shapes based on the gas volume fraction of the air cavity and the vapour cavity at 10 different time instants are shown in figure 5. As discussed earlier, once the water-hammer shock wave interacts with the DSC, the cavity interface moves upstream and a series of reflected rarefaction waves are generated due to the diffraction of the shock wave, all of which accelerate the flow. As the interaction progresses, the curve shape of the cavity interface causes the accelerated flow to concentrate, which eventually causes the interface to become involute and form a main vertical jet, and the main vertical jet further enhances the cavity deformation.
Numerical results of the contour shapes based on the volume fraction of the internal gases of the air cavity (a) and the vapour cavity (b). The corresponding instants of the contour shapes are given in the central table.

In the case of air cavity evolution, the air cavity is gradually compressed and the air is continually expelled to the remaining cavity wings in the two sides with a high expelling velocity
 $({\sim}500~\text{m}~\text{s}^{-1})$
. The pressure inside the remaining wings gradually rises during the compression process, which makes it increasingly difficult to compress the air cavity, and hence the deepness of the main vertical jet (
 $L$
in figure 5) is increased along its propagation direction, as seen in figure 5(a). The result also shows that the expelled air is swirling around the tail of the remaining wings along the interface with a velocity of about
 $300~\text{m}~\text{s}^{-1}$
, and therefore the edges of the tail of the air cavity wings remain smooth-shaped.
As for the evolution of the vapour cavity, the internal saturated vapour will condense into the liquid water once the local vapour pressure is higher than the saturated value as the cavity interacts with the main vertical jet. Hence, different from the air cavity, no gas is expelled inside the vapour cavity, and the deepness of the main vertical jet almost remains unchanged along its propagation direction, seen in figure 5(b). In addition, the local condensation process not only occurs on the front of the main vertical jet but also at the tails of the remaining vapour cavity wings. As shown in figure 5(b), the tail of the remaining vapour cavity wing gradually shrinks to an irregular-shaped edge rather than the smooth-shaped edge as in the case of the air cavity. Hence, in the last several instants in figure 5, the remaining volume of the vapour cavity is obviously smaller than that of the air cavity.
As mentioned earlier, the instant when the involute DSC finally touches the USC is the collapsing time
 $t_{collapse}$
, that is, the time instant of J in figure 5. As shown in figure 5, the collapsing instants of the two cases are very close to each other, although the inside wave structure and the collapsing dynamics are quite different. The results also show that the remaining cavity volume and shape for both cases are very different at the later period of cavity collapse.
After the instant of
 $t_{collapse}$
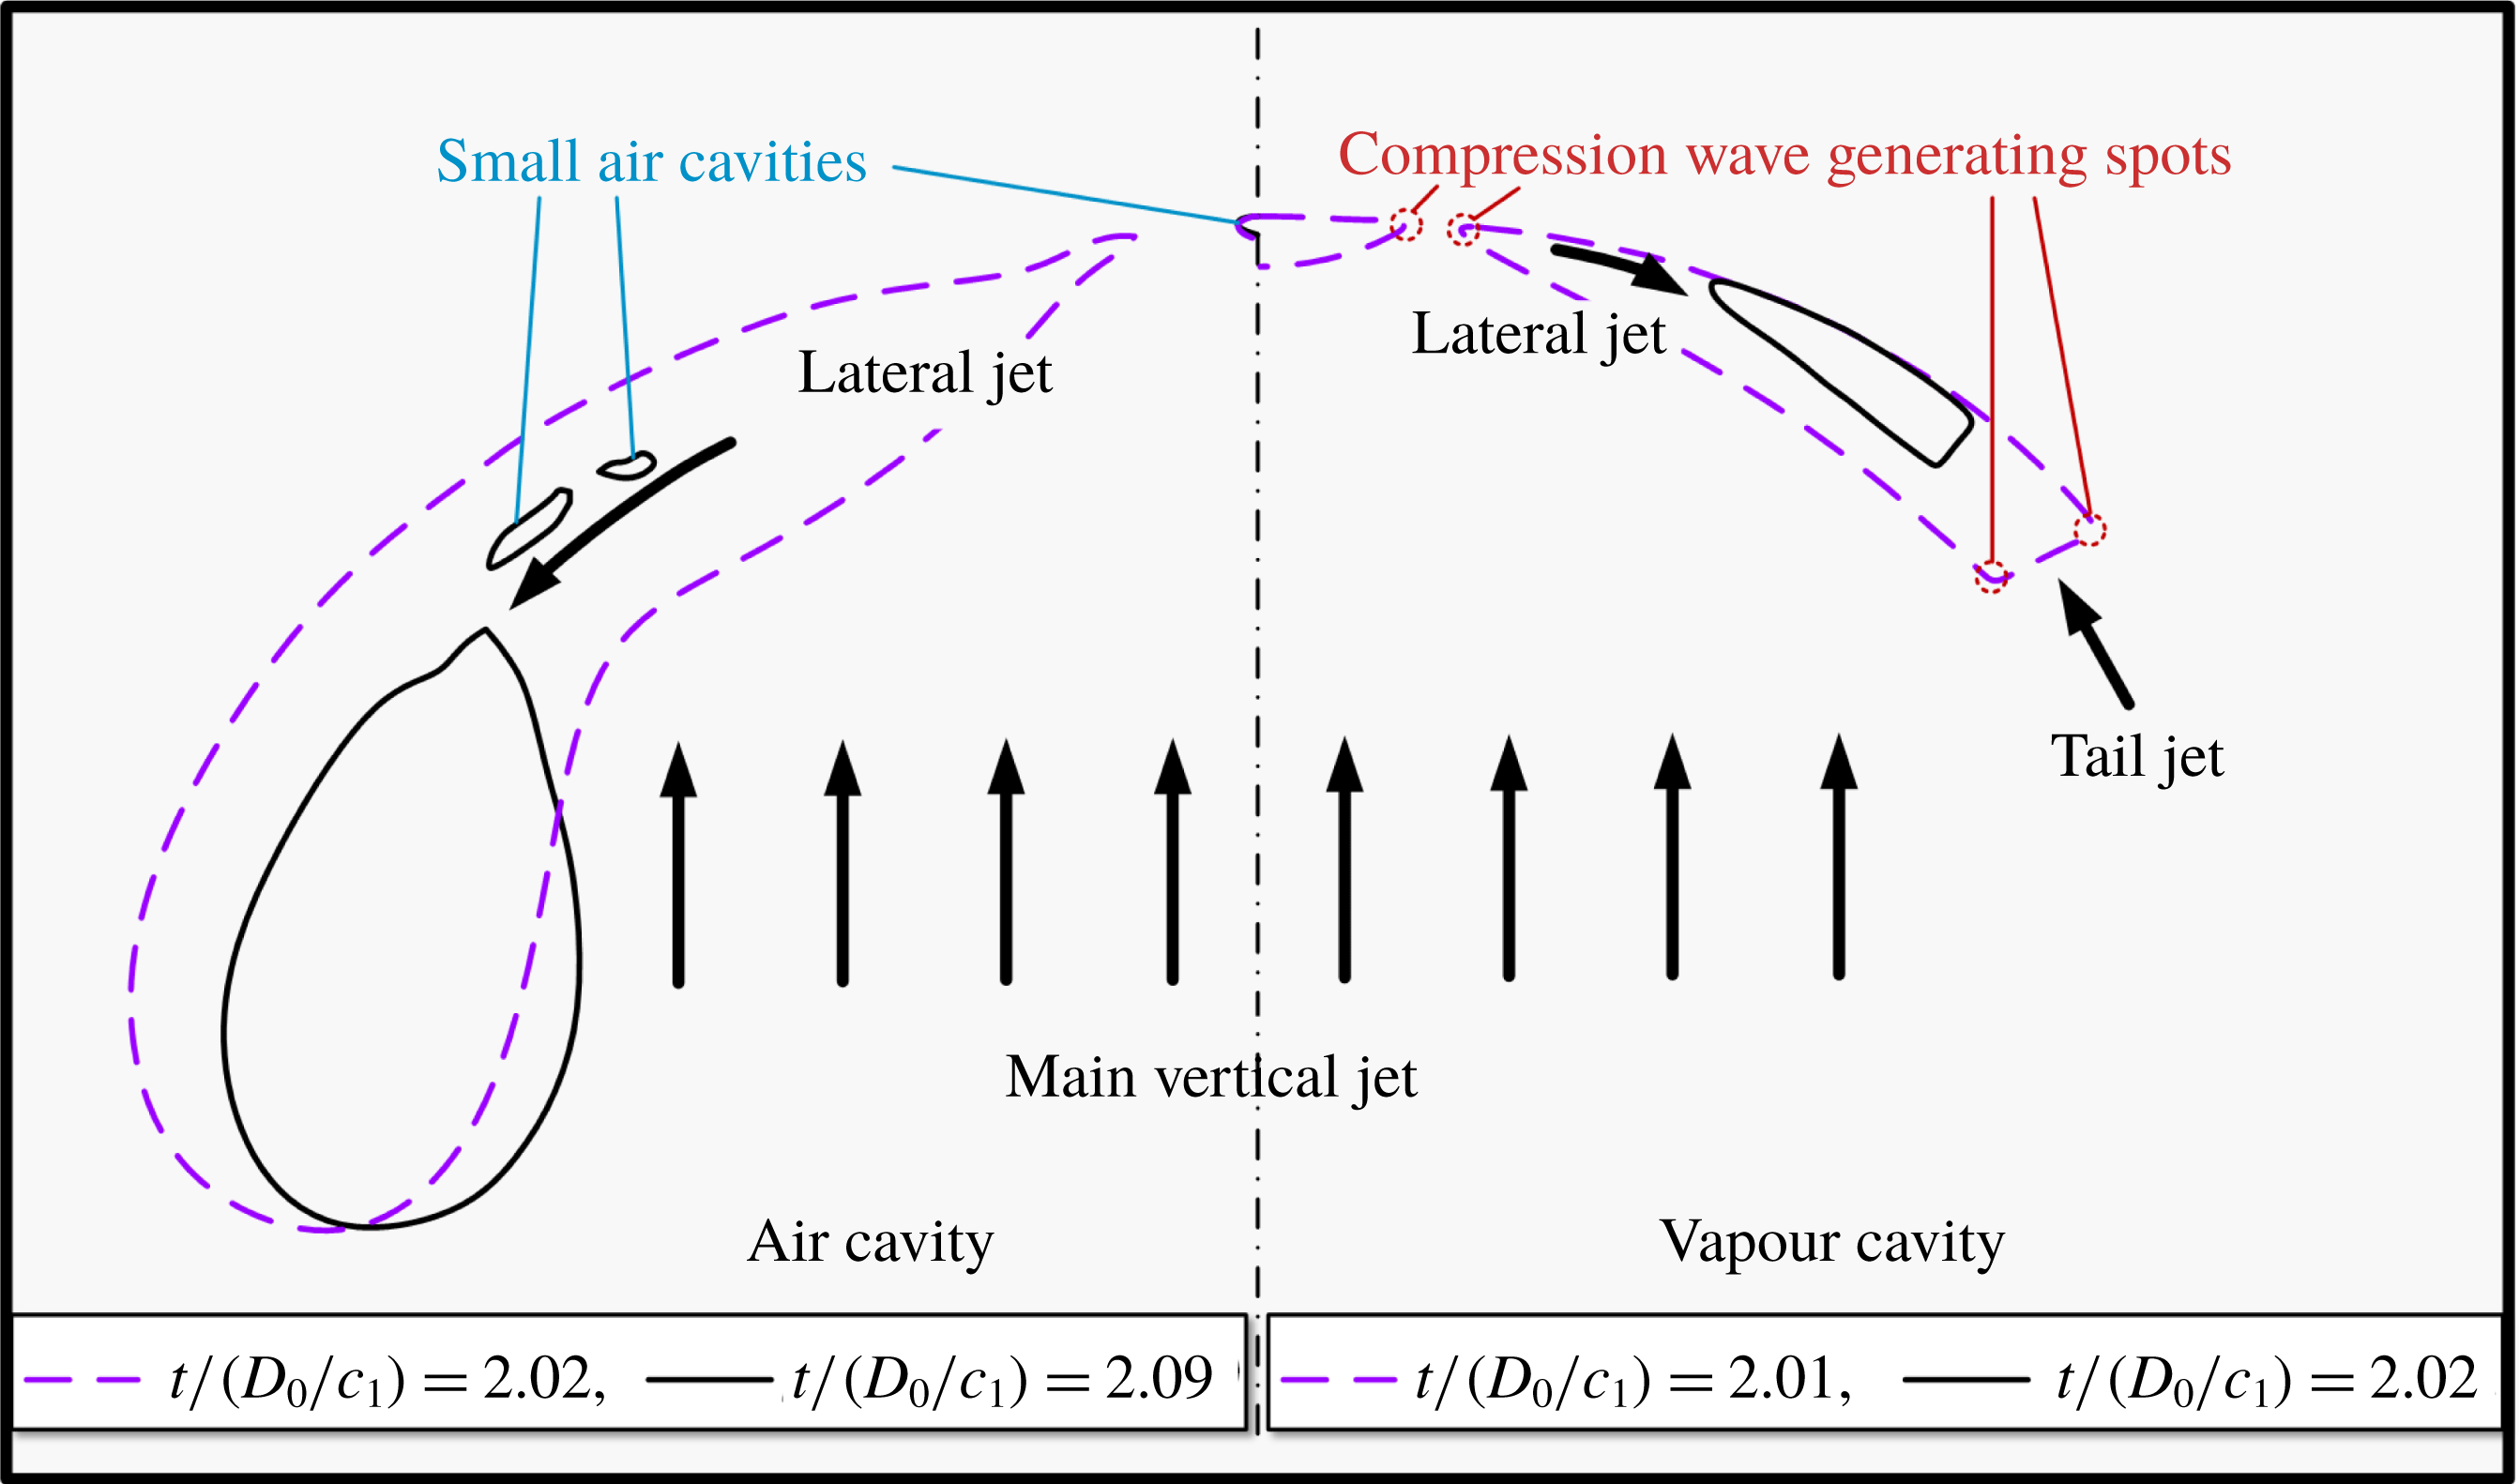
, the further evolution procedures of the remaining cavities for the two cases are shown in figure 6, which demonstrates enlarged views for the area of the remaining cavity inside the cylindrical droplet; a schematic diagram of these evolution processes is shown in figure 7. At the instant of
 $t_{collapse}$
, the pressure rises due to the collision between the DSC and USC, which are also called blast waves (Ball et al.
Reference Ball, Howell, Leighton and Schofield2000), are close to each other for both cases, as shown in figure 6(a1,b1). The pressure rise can be evaluated as
 $$\begin{eqnarray}p_{wh}=\unicode[STIX]{x1D70C}_{l}c_{l}v_{j}\frac{\unicode[STIX]{x1D70C}_{l}c_{l}}{\unicode[STIX]{x1D70C}_{l}c_{l}+\unicode[STIX]{x1D70C}_{l}c_{l}}=\frac{1}{2}\unicode[STIX]{x1D70C}_{l}c_{l}v_{j},\end{eqnarray}$$
where
 $v_{j}$
is the velocity difference between the impacting jet and the impacted liquid surface. As shown in figure 3, the velocity difference between monitoring points
 $T$
and
 $B$
of the air cavity is close to the value for the vapour cavity before
 $t_{collapse}$
, so the pressure rises due to the surface collision are the same, about
 $2\times 10^{8}~\text{Pa}$
, which conforms to the numerical results. During the further collapse of the remaining cavity, the wave structure and strength are different for the two cases, as shown in figure 2(a5,b5). The reason for the distinction during the further evolution process is discussed next.
Enlarged view for the remaining cavities after
 $t_{collapse}$
(the frame width is
 $0.2R_{0}$
). (a) Evolution of the droplet embedded with the air cavity at time series (1)
 $t/(D_{0}/c_{l})=2.01$
, (2)
 $t/(D_{0}/c_{l})=2.06$
, (3)
 $t/(D_{0}/c_{l})=2.08$
, (4)
 $t/(D_{0}/c_{l})=2.09$
and (5)
 $t/(D_{0}/c_{l})=2.17$
. (b) Evolution of the droplet embedded with the vapour cavity at time series (1)
 $t/(D_{0}/c_{l})=2.01$
, (2)
 $t/(D_{0}/c_{l})=2.02$
, (3)
 $t/(D_{0}/c_{l})=2.03$
, (4)
 $t/(D_{0}/c_{l})=2.04$
and (5)
 $t/(D_{0}/c_{l})=2.07$
. Left-hand side of each panel: pressure contour non-dimensionalized by
 $p_{0}$
where the position of the gas/liquid interface is located exactly by the volume fraction of the gas. Right-hand side of each panel: numerical density schlieren image and velocity vectors.

Schematic diagram of the collapsing mechanism of the remaining cavities after
 $t_{collapse}$
. The left-hand side half corresponds to the air cavity and the right-hand side to the vapour cavity.

Once the DSC meets the USC, the cavity will be divided into two parts, if the first collision point is on the
 $y$
-axis, or three parts, if the first collision point is not on the
 $y$
-axis. As shown in figure 6(a1,b1), due to the different curvatures of the involute DSC and USC, both first collision points for the present two cases are not on the
 $y$
-axis; thus, the cavity is divided into one smaller cavity lying on the
 $y$
-axis and two larger symmetric cavity wings on both sides.
For the case of the air cavity, the two larger symmetric air cavity wings are sharp-nosed shaped, and the centre air cavity is very small. The existence of the centre smaller air cavity can also be confirmed by the velocity variations and the motion tracks of monitoring point
 $T$
,
 $C$
and
 $B$
as shown in figures 3(a) and 4. As for the two larger remaining cavity wings, as shown in figure 6(a1), the air is continually expelled to the blunt ends (smooth-shaped tail) of the remaining cavity wings via interaction of the jets. The highest velocity of the gas-expelled jet can reach about
 $1500~\text{m}~\text{s}^{-1}$
. Meanwhile, these remaining cavity wings shrink laterally from the sharp-nosed side to the blunt end, which generates the lateral liquid jet with a velocity of about
 $600~\text{m}~\text{s}^{-1}$
. Under the combined effect of the main vertical jet and the lateral jet, the remaining cavity wings are divided into additional parts. As shown in figure 6(a2,a3), during the jet-induced division process of the remaining cavity wings, the interface collision is accompanied and the collapsing waves are generated with maximum local transient pressure (
 $p_{max}$
) of about
 $3.2\times 10^{8}~\text{Pa}$
. The maximum value depends on the velocity difference between the two collision interfaces along the collision direction. Thereafter, the remaining cavity wings are further divided into a series of small air cavities on the sharp-nosed side, as shown in figure 6(a4) and the schematic diagram of this collision process in figure 7. During this process, the compression wavelets are generated intermittently when the interface collision occurs. Subsequently, the remaining larger air cavity is further compressed and broken up, as shown in figure 6(a5), where the cavity is interacting with the sheet jet.
After
 $t_{collapse}$
, due to the strong interaction of the main vertical jet, the impacted vapour cavities continually collapse and condense. A sequence of compression waves are continuously generated at the tip of the remaining cavities when the collisions of the interfaces take place, as shown in figure 6(b1) and in the schematic diagram of this collision process (figure 7). Typically, at the tips of both sides of the centre small cavity and the tips of the sharp-nosed sides of two larger symmetric cavity wings, the compression waves are continuously generated to form two symmetric main collapsing shocks, as shown in figure 6(b2). Once the centre small cavity completely vanishes, the two main collapsing shocks from the left- and right-hand sides meet at the
 $y$
-axis. Then, they are reflected by each other, forming the reflection main collapsing shock, as shown in figure 6(b3). The local transient pressure can reach
 $5.7\times 10^{8}~\text{Pa}$
at the instant when the two shock waves just meet each other. Referring to the velocity variations at monitoring points
 $T$
,
 $C$
and
 $B$
of the vapour cavity in figure 3(b), the velocity variations are non-overlapping after
 $t_{collapse}$
because these three monitoring points represent the particles of the condensation liquid. This is different from the result for the air cavity in figure 3(a). Also, the other two larger cavity wings collapse both at the sharp-nosed sides and at the irregular-shaped tails of the wings. At the sharp-nosed side, the compression waves are continuously generated due to the continuous interface collision, which enhances the strength of the main collapsing shock. At the irregular-shaped tails of the wings, the compression waves are also continually generated and these compression waves form the tail collapsing shock, as shown in figure 6(b3). Because of the collapse of the remaining cavity wings from both sides, the liquid jets are generated differently. The lateral jet with a jet velocity of about
 $400~\text{m}~\text{s}^{-1}$
is similar to the case of the air cavity but in a smaller region. The tail jet can hold the velocity at about
 $800~\text{m}~\text{s}^{-1}$
, as shown in figure 6(b3) and in figure 7. At the moment that the vapour cavity wings completely vanish, the lateral jet impacts the tail jet with a very high velocity difference, where the maximum local transient pressure (
 $p_{max}$
) can reach about
 $14.9\times 10^{8}~\text{Pa}$
. Once the main and tail collapsing shock waves meet, they are reflected by each other. At this moment, a high-intensity shock wave is formed, which is called the reflection meeting shock here, as shown in figure 6(b4). After the complete vanishing of the vapour cavity, these shock waves generated during vapour collapse (also collectively called collapsing shock waves in a later section) continue to propagate and the pressure behind the shock wave front gradually decreases along its propagation, as shown in figure 6(b5).
Through a comparison of the evolutions of the impacted cavities for both cases after
 $t_{collapse}$
, it is found that the collapsing mechanism leads to different flow structures and wave propagation behaviours. For the case of the air cavity, the collapsing mechanism is mainly due to compression. The expelled air space will be occupied by water, and then the different liquid jets generate, including the main vertical jet, lateral jet and sheet jet. The collapsing air cavity finally results in a series of small air cavities. The intermittent interface collision induces a series of intermittent compression wavelets. No intensified shock waves are observed in the air cavity collapse in the present simulation. For the case of the vapour cavity, the collapsing mechanism is mainly due to the continuous condensation triggered by the initial confined shock wave. The condensation would lead to continuous interface collisions, until the complete vanishing of the remaining vapour cavities. The compression waves are generated continuously and form strong collapsing shock waves. The maximum local transient pressure during the collapse of the vapour cavity is more than four times the strength of the air cavity, because of very strong collapsing shock waves and their interaction.
3.3 Pressures on the wall due to cavity collapse
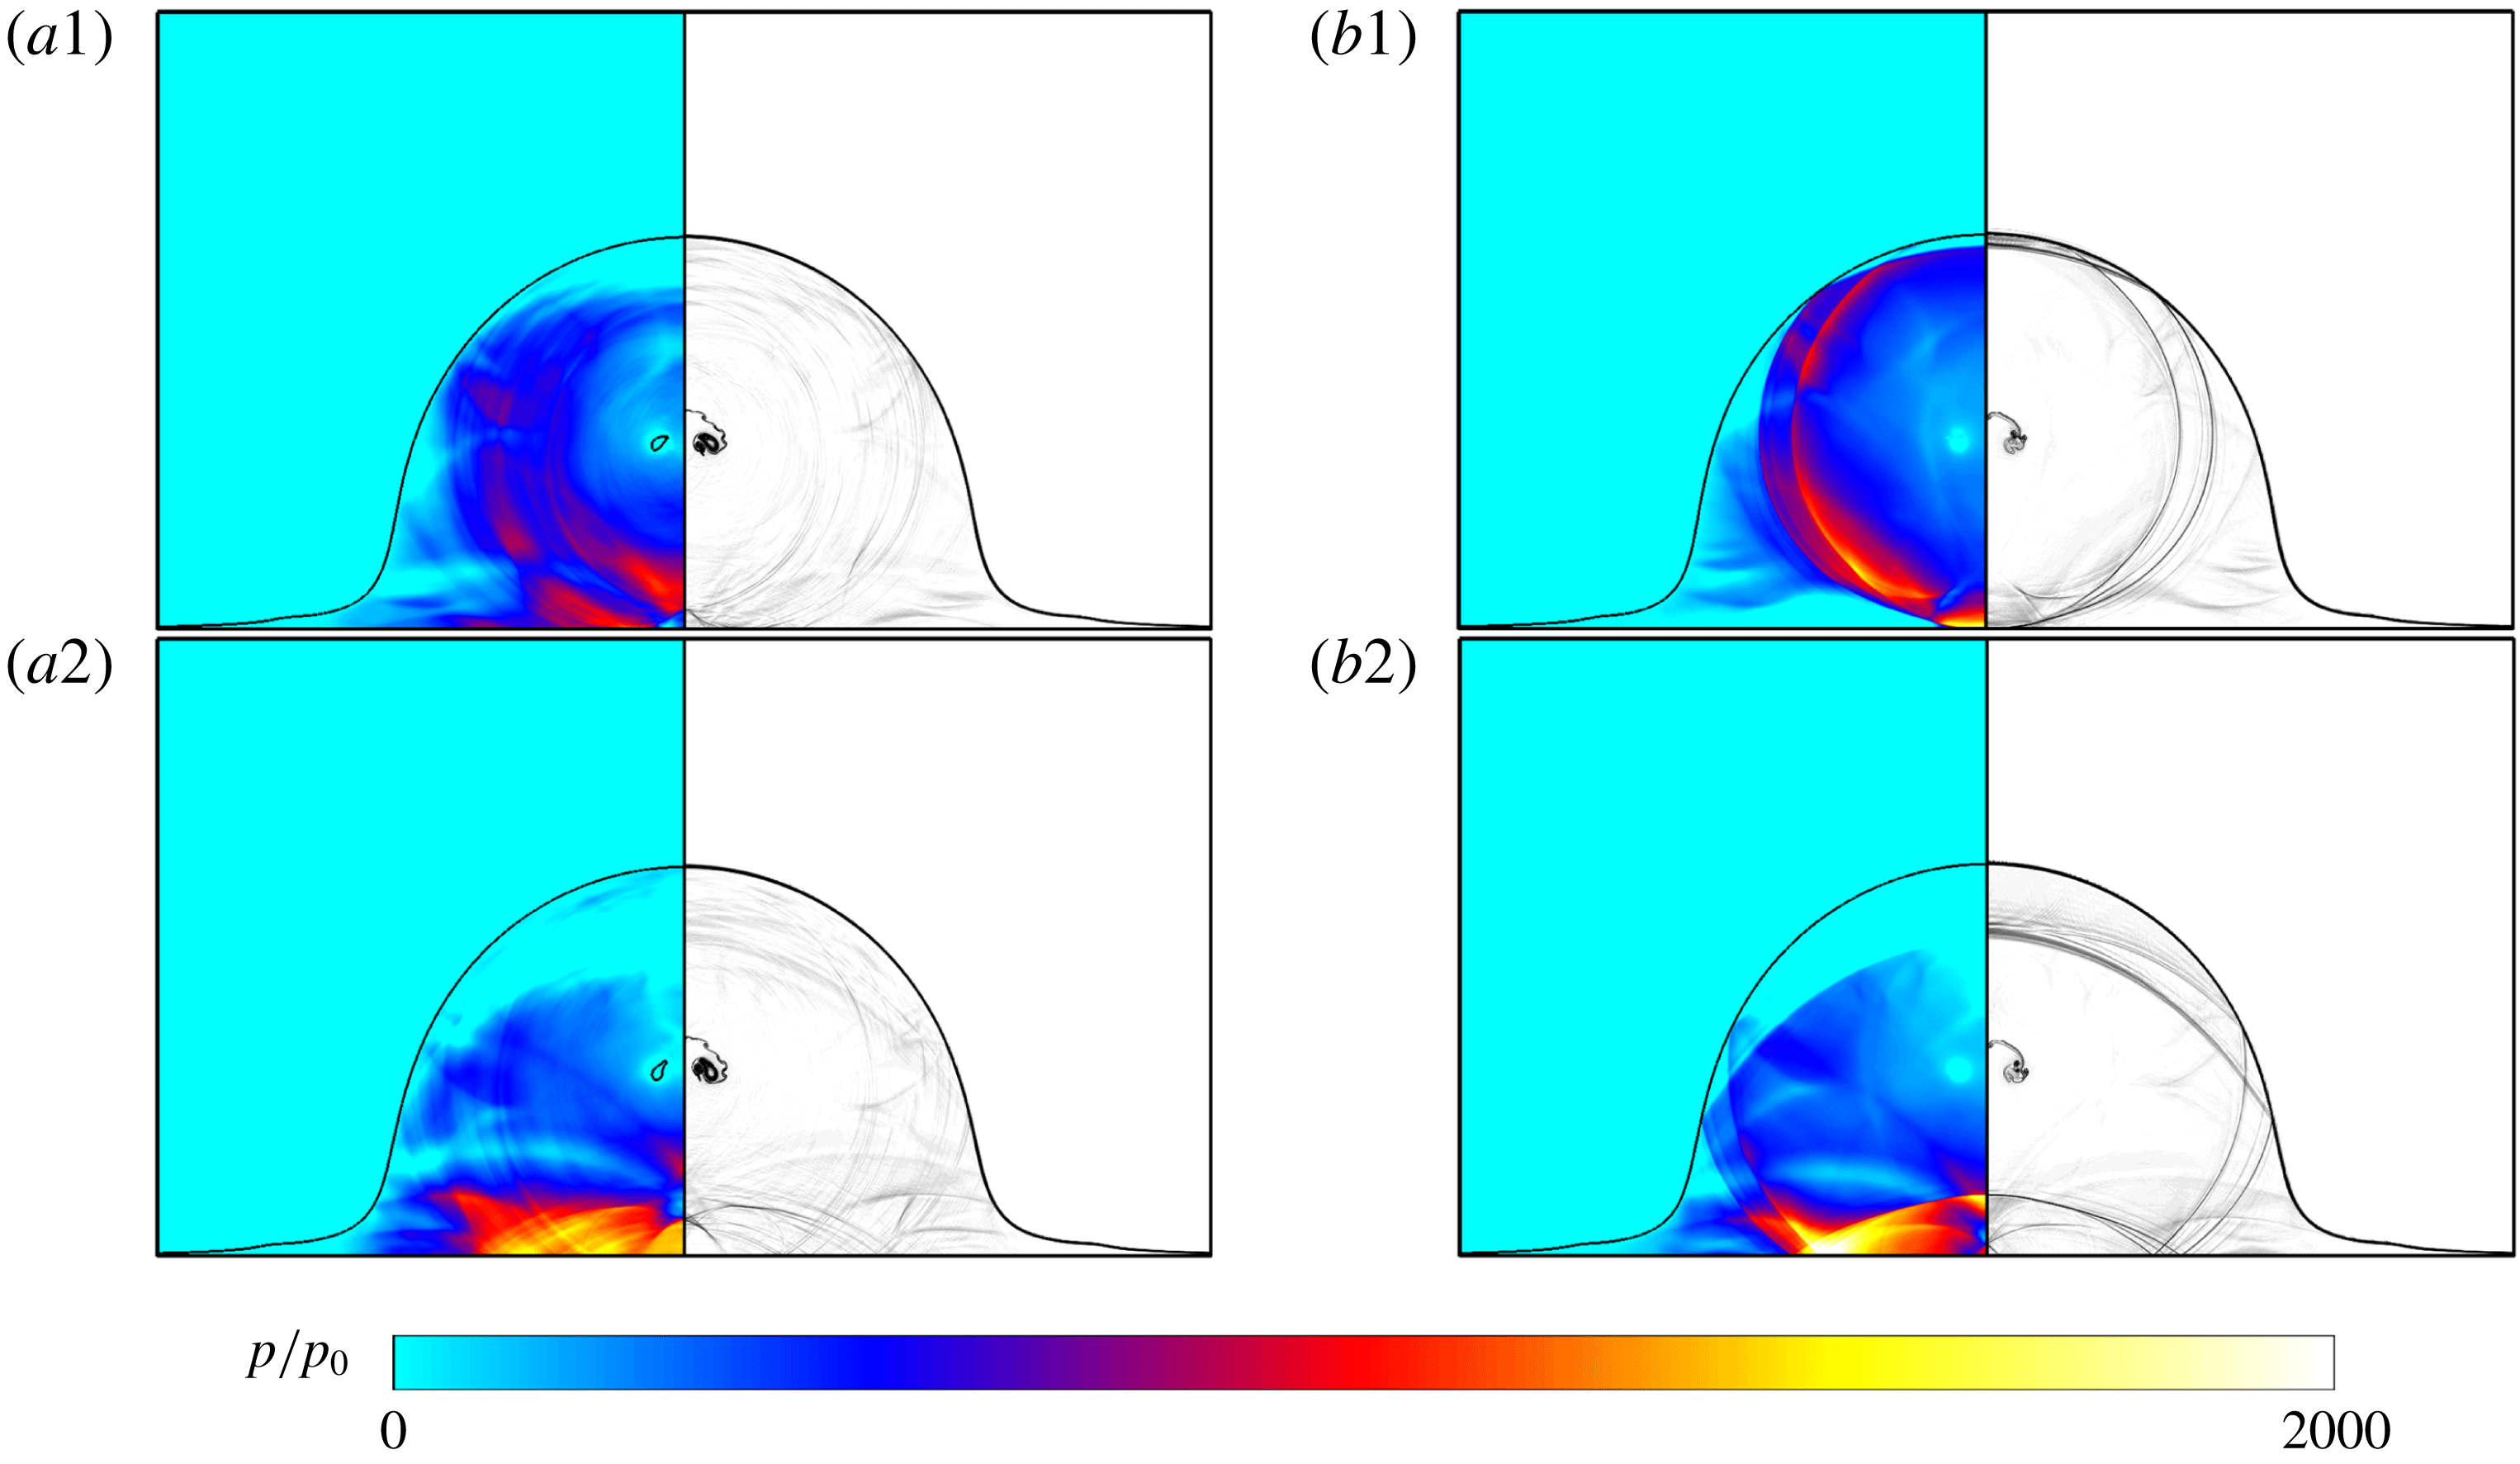
The collapse of the cavity finally results in different wave structures and increases pressures on the impacting wall. This section discusses the pressures on the wall during the cavity collapsing process. For the cylindrical droplet embedded with an air cavity, as shown in figure 8(a), a range of intermittent compression waves expand inside the cylindrical droplet, which are reflected by the cylindrical droplet surface and the rigid wall in sequence. For the case of the cylindrical droplet embedded with a vapour cavity, as shown in figure 8(b), the compression waves are generated continuously to form collapsing shock waves, which are reflected by the cylindrical droplet surface and the rigid wall during the expanding procedure.
The numerical results of the evolution of collapsing waves: (a) evolution of a cylindrical droplet embedded with an air cavity at time series (1)
 $t/(D_{0}/c_{l})=2.47$
and (2)
 $t/(D_{0}/c_{l})=2.57$
; (b) evolution of a cylindrical droplet embedded with a vapour cavity at time series (1)
 $t/(D_{0}/c_{l})=2.40$
and (2)
 $t/(D_{0}/c_{l})=2.52$
. Left half of each panel: pressure contour non-dimensionalized by
 $p_{0}$
where the position of the gas/liquid interface is located exactly by the volume fraction of the gas. Right half of each panel: numerical density schlieren image.

Because the acoustic impedance of water is much larger than that of air but much smaller than that of the rigid wall (the acoustic impedance of the rigid wall can be regarded as infinite in the present study), the reflection wave of the compression wave and that of the shock wave on the cylindrical droplet surface are rarefaction waves, while the reflection wave of the compression wave and that of the shock wave on the rigid wall are still compression waves or shock waves, as shown in figure 8. The reflection of the compression wave and shock wave on the rigid wall enables the wall to sustain considerable pressure in the reflection region. It is observed that the maximum pressure on the wall is
 $2.28\times 10^{8}~\text{Pa}$
for the air cavity case but
 $2.76\times 10^{8}~\text{Pa}$
for the vapour cavity case during the collapsing wave reflection. The highest local pressure on the wall is more than 2000 times the initial pressure
 $p_{0}$
. In addition, the area on the wall influenced by these collapsing compression waves and shock waves is larger than that impacted by the initial water-hammer shock because the cylindrical droplet spreads sufficiently. Furthermore, this larger area with an increase in wall pressure may not exist in the dense droplet impinging process. The wall pressure is monitored to evaluate the withstanding force of the wall around the impinging zone in the range of
 $[-R_{0},R_{0}]$
at the
 $x$
-axis. The mean pressure at each time instant is calculated by means of averaging the pressure distribution within the monitoring range. The maximum value of mean pressure on the wall in the monitoring range,
 $p_{wall\_max}$
, during the reflection of the collapsing waves is
 $0.95\times 10^{8}~\text{Pa}$
for the air cavity, but it is
 $1.04\times 10^{8}~\text{Pa}$
for the vapour cavity. Both of these values are about 1000 times that of
 $p_{0}$
. Different from the high-speed dense droplet impingement process, which leads to intense pressure on the rigid wall in only a rather small region in the very early impinging stage, the high-speed hollow droplet impingement process further causes high pressure on the wall in a much larger region, comparable to the size of the droplet, due to the collapse of the embedded cavity.
For a droplet embedded with a cavity of initial radius of
 $0.25R_{0}$
, the maximum local transient pressure,
 $p_{max}$
, during the collapse of the vapour cavity is
 $14.9\times 10^{8}~\text{Pa}$
, and it is
 $3.2\times 10^{8}~\text{Pa}$
during the collapse of the air cavity. The former value is almost five times as great as the latter one. The occurrence of such very high local transient pressure inside the droplet may have potential application in biomedical engineering, such as for targeted drug delivery (Sheeran et al.
Reference Sheeran, Luois, Dayton and Matsunaga2011). The collapsing behaviours of the cavity strongly depend on the strength of the impinging shock wave, and the evolution characteristics and pressures on the rigid wall will change when the initial size of the cavity is different. This will be analysed in the next section.
4 Effects of cavity radii and initial impinging speeds
The effects of the impinging speed and the size of the embedded cavity on the droplet dynamics are investigated in this section. The sizes of the embedded air/vapour cavity
 $r_{0}$
are specified as
 $0.125R_{0}$
,
 $0.25R_{0}$
,
 $0.375R_{0}$
and
 $0.5R_{0}$
of the cylindrical droplets under the same initial impinging speed of
 $150~\text{m}~\text{s}^{-1}$
. The impinging speeds of droplets are taken as
 $50$
,
 $100$
,
 $150$
and
 $200~\text{m}~\text{s}^{-1}$
under the same initial size of embedded cavity of
 $r_{0}=0.25R_{0}$
.
4.1 Collapsing times
As shown in figure 5, the collapsing time corresponds to the collision instant when the involute DSC just meets the USC. If the starting time point is taken as when the droplet touches the rigid wall, the collapsing time
 $t_{collapse}$
is thus the sum of the time when the shock wave just reaches the cavity and the characteristic collapsing time duration of
 $\unicode[STIX]{x1D70F}_{c}$
:
 $$\begin{eqnarray}t_{collapse}=\unicode[STIX]{x1D70F}_{c}+\frac{R_{0}-r_{0}}{V_{s}},\end{eqnarray}$$
where
 $R_{0}$
is the initial radius of the cylindrical droplet,
 $r_{0}$
is the initial radius of the cavity and
 $V_{s}$
is the shock wave velocity. Referring to the work of Haller et al. (Reference Haller, Ventikos, Poulikakos and Monkewitz2002), in water droplets,
 $V_{s}$
can be approximately calculated as
 $V_{s}\approx c_{l}+2V_{0}$
. The characteristic collapsing time duration
 $\unicode[STIX]{x1D70F}_{c}$
is defined as the time difference between the time instant when the water-hammer shock wave just interacts with the cavity and the time instant when the DSC impacts the USC.
In order to obtain a theoretical estimation of characteristic collapsing time,
 $\unicode[STIX]{x1D70F}_{c}$
, for the cavity collapse inside the cylindrical droplets in the present case, one considers the previous theoretical result of the evolution dynamics of a cylindrical cavity that undergoes uniform pressure at infinite place (Lohse et al.
Reference Lohse, Bergmann, Mikkelsen, Zeilstra, van der Meer, Versluis, van der Weele, van der Hoef and Kuipers2004; Quinto-Su, Lim & Ohl Reference Quinto-Su, Lim and Ohl2009; Quinto-Su & Ohl Reference Quinto-Su and Ohl2009; Ilinskii et al.
Reference Ilinskii, Zabolotskaya, Hay and Hamilton2012). For the symmetric collapse of a cylindrical vapour cavity resulting from higher ambient pressure (also called the Rayleigh collapse), the theoretical expression of the characteristic collapsing time (also called the Rayleigh time),
 $\unicode[STIX]{x1D70F}_{c\_R}^{2D}$
, which corresponds to the instant of the cavity first shrinking to its minimum radius, is given in appendix A. The main factors that influence the characteristic collapsing time are the initial cavity size and the pressure difference over the cavity interface. In the present work, though the collapse does not occur in the confined space, the collapse process is still mainly triggered by the pressure difference across the interface which is the same as the Rayleigh collapse. Here, the triggering pressure is taken as
 $p_{s}$
, the value of the pressure after the shock front when the shock wave just interacts with the cavity, and a different value of the collapsing parameter
 $C_{R}$
can be taken to involve the unsymmetric collapse.
Considering the effects of the relative size of the embedded cavity and the influence of the initial impinging speed, the theoretical estimations of the characteristic collapsing time of the embedded cavity,
 $\unicode[STIX]{x1D70F}_{c\_R}$
, and the coefficient,
 $C_{R}$
, are
 $$\begin{eqnarray}\unicode[STIX]{x1D70F}_{c}=C_{R}r_{0}\sqrt{\frac{\unicode[STIX]{x1D70C}_{l}}{p_{s}-p_{cavity}}},\quad C_{R}=\sqrt{\frac{V_{s}}{2V_{0}(1-r_{0}/R_{0})}},\end{eqnarray}$$
where
 $R_{0}$
is the initial radius of the hollow cylindrical droplet,
 $r_{0}$
is the initial radius of the embedded cavity and the expression for
 $C_{R}$
is obtained through data fitting. Because the value of
 $p_{cavity}$
is much smaller than that of
 $p_{s}$
, regardless of whether the air cavity or the vapour cavity is involved, the influence of
 $p_{cavity}$
can be negligible. Hence,
 $\unicode[STIX]{x1D70F}_{c}$
values calculated from (4.2) for the two cases are very close to each other, consistent with the numerical results. The theoretical estimations of characteristic collapsing time,
 $\unicode[STIX]{x1D70F}_{c}$
, of the cavity embedded in the hollow cylindrical droplet for different initial radii and different initial impinging speeds are shown in figure 9.
The simulation results of the collapsing times for the air/vapour cavities with different initial radii but for the same initial impinging speed of
 $150~\text{m}~\text{s}^{-1}$
are shown in figure 9(a). The results show that
 $\unicode[STIX]{x1D70F}_{c}$
increases with increasing initial cavity radius, and the simulation results are very close to the theoretical ones. The collapsing times for the two kinds of cavities almost coincide, which also conforms to the theoretical analysis that
 $\unicode[STIX]{x1D70F}_{c}$
mainly depends on the values of
 $p_{s}$
and
 $r_{0}$
. Hence, though the collapsing mechanisms for the two kinds of embedded cavities are different, the collapsing times are quite close to each other because the main decisive factors are the same.
The simulation results are shown in figure 9(b) for the collapsing time of vapour cavities with the same initial radius of
 $0.25R_{0}$
under different initial impinging speeds. The results show that
 $\unicode[STIX]{x1D70F}_{c}$
gradually decreases, due to the strength of the impinging water-hammer shock increasing with the initial impinging speed. The simulation results generally agree with the theoretical results, and deviation gradually increases when the initial impinging speed decreases.
Moreover, since the embedded vapour cavity is initially in a non-equilibrium state, Rayleigh collapse will occur even without the impact. However, Rayleigh collapse induced by the initial pressure difference is a slower process compared to the collapse induced by the impact. The time duration of the present shock-induced cavity collapse is much shorter. Taking the case of
 $[r_{0}=0.25R_{0},V_{0}=150~\text{m}~\text{s}^{-1}]$
in the current study as an example, the Rayleigh collapse time of the cylindrical cavity is about
 $170~\unicode[STIX]{x03BC}\text{s}$
, which is much longer than the time duration of the shock-induced cavity collapse for the present case (about
 $10~\unicode[STIX]{x03BC}\text{s}$
). Hence, Rayleigh collapse is not the dominating process in the present cases, and its influence is not discussed in this paper.
Comparisons of characteristic collapsing times
 $\unicode[STIX]{x1D70F}_{c}$
. (a) The embedded air/vapour cavity droplet with different initial radii and (b) the embedded vapour cavity droplet for different initial impinging speeds (the filled circle denotes the case of the air cavity, the filled square denotes the case of the vapour cavity and the dashed line denotes to the present theoretical prediction from (4.2)).

4.2 Maximum collapsing pressures
The maximum pressure in the whole flow field can represent the severity of the collapsing process. In this section, the maximum pressure values during cavity collapse are analysed.
Figure 10 shows the simulation results of maximum local transient pressure,
 $p_{max}$
, during the collapse of cavities embedded in droplets. The pressure after the shock front when the shock wave just interacts with the cavity (i.e.
 $p_{s}$
) is also presented as the dashed line. The values of
 $p_{max}$
during the collapse of both air cavities and vapour cavities for the present cases are both larger than
 $p_{s}$
; that is, the interaction between cavity and shock wave may lead to pressure amplification due to forced collapse. As shown in figure 10(a), the values of
 $p_{max}$
for the air cavities barely change for different initial radii, but they are always smaller than the corresponding values for the vapour cavities. However, regarding the results for vapour cavities in the present case, the values of
 $p_{max}$
are changed significantly as the size of cavity changes, as shown in figure 10(a,b). The value of
 $p_{max}$
strongly depends on the flow structures and wave evolution in the flow field during the collapse of the cavities. Taking figure 10(a) as an example, the largest value appears in the case of the initial vapour cavity radius of
 $0.375R_{0}$
, and it can reach about
 $30\times 10^{8}~\text{Pa}$
, nearly 30 times larger than the initial triggering pressure. As discussed in § 3.2, the maximum pressure occurs at the moment when the lateral jet impacts on the tail jet. From
 $0.125R_{0}$
to
 $0.375R_{0}$
, the strengths of the lateral jet and the tail jet both increase, which induces a larger velocity difference at the moment of jet impingement. Hence, the value of
 $p_{max}$
increases, whereas for the case of
 $0.5R_{0}$
, because the curvature of the cavity is comparable to that of the confined water-hammer shock front, the width of the induced main vertical jet becomes less than the initial cavity diameter. Hence, no obvious tail jet is generated during the
 $0.5R_{0}$
cavity collapse. The high transient local pressure is not induced in this case, and thus the value of
 $p_{max}$
decreases compared with the smaller embedded cavities, as shown in figure 10(a).
Comparisons of
 $p_{max}$
during cavity collapse with
 $p_{s}$
(a) for different initial radii and (b) for different initial speeds (the filled circle denotes the case of the air cavity and the filled square denotes the case of the vapour cavity).

4.3 Mean pressure on the rigid wall
The pressure that is sustained by the rigid wall is of concern when considering the adhesion properties of a coating or the delivery effectiveness of a medicine when droplets impact the wall. In this section, the mean wall pressures are compared for the cases of droplets embedded with the air/vapour cavity for different initial cavity radii and for different impinging speeds.
Figure 11 gives the profiles of the maximum value of mean pressure on the wall in the monitoring range of [
 $-R_{0},R_{0}$
],
 $p_{wall\_max}$
, during the cavity collapse for different cases. As shown in figure 11(a), in general, the value of
 $p_{wall\_max}$
is increased with increasing initial cavity radius for the case of the vapour cavity, because more compression waves are generated by the larger interface fusion during the longer collapse. Those compression waves can merge to be a stronger shock wave, and the shock impinges further on the rigid wall. However, an exception exists for the case of the
 $0.5R_{0}$
air cavity, as shown in figure 11(a). The value of
 $p_{wall\_max}$
is significantly decreased, compared with the other cases. If the initial air cavity is larger, the earlier compression wavelets induced by the earlier interface collision will expand. The intensity of the compression waves is reduced, and no stronger shock wave can be formed immediately to impact the rigid wall. We did not perform simulations for cavities larger than
 $0.5R_{0}$
because it is out of the range of small cavities. As expected, if the cavity size is increased, the cavity may deform apparently before it collapses with the spreading of the high-speed impinging droplet, and the droplet may break up with the evolution of the embedded cavity, which is out of the scope of the present work.
In addition,
 $p_{wall\_max}$
induced by the collapse of the vapour cavities is higher than that induced by the collapse of the air cavities, as shown in figure 11(a). Referring to the analysis of the collapsing mechanism in § 3.2, the strength of the collapsing waves for the vapour cavity is greater than that of the intermittently generated collapsing waves for the air cavity. The pressures imparted to the rigid wall are greater for the vapour cavity case.
Figure 11(b) shows the results of
 $p_{wall\_max}$
for different initial impinging speeds. In general, the value of
 $p_{wall\_max}$
is increased with an increase of the initial impinging speed of the hollow droplets, because stronger impinging water-hammer shock waves are generated. The time instants when
 $p_{wall\_max}$
occurs, denoted as
 $t_{interaction}$
, are also compared in figure 11(b), where the filled triangle denotes the interaction time
 $t_{interaction}$
and the open triangle denotes the time difference between
 $t_{interaction}$
and collapsing time
 $t_{collapse}$
. As shown in figure 11(b),
 $t_{interaction}$
decreases while the time difference between
 $t_{interaction}$
and
 $t_{collapse}$
is almost unchanged with increasing initial impinging speed, which means that the decrease in
 $t_{interaction}$
is mainly driven by the decrease in
 $\unicode[STIX]{x1D70F}_{c}$
as discussed in § 4.1.
The values of
 $p_{wall\_max}$
during the collapse of cavities embedded in high-speed impinging cylindrical droplets: (a) the results for different initial radii (the filled circle denotes the case of the air cavity and the filled square denotes the case of the vapour cavity) and (b) the results of the vapour cavity for different initial impinging speeds. The corresponding interaction times are also given (the filled triangle denotes the interaction time
 $t_{interaction}$
and the open triangle denotes the time difference between
 $t_{interaction}$
and collapse time
 $t_{collapse}$
).

The present work is mainly focused on the planar two-dimensional problem; the primary evolution process and physical mechanism of both two- and three-dimensional cases are inherently similar. However, there may be a difference between the two- and three-dimensional results. Therefore, in order to discuss the three-dimensional effect, rotationally symmetric simulations are given in appendix C which are approximated to the three-dimensional problem.
5 Conclusion
Numerical studies of the impingement of high-speed hollow water droplets were conducted to investigate the evolution dynamics of droplets and cavities interacting with a rigid wall. The air and vapour cavities are initially embedded in the centre of the droplets. The geometry morphology of droplet and cavity, the evolution of impinging water-hammer shock wave, the collapsing wave structures and the corresponding pressures on the rigid wall are compared for both types of cavities. Finally, the influences on the impact dynamics are discussed in terms of different initial sizes of the embedded cavity and impinging speeds of the hollow droplet. The main research conclusions are the following.
An impinging water-hammer shock wave is generated and confined in the droplet. When the embedded cavities are impacted by the impinging water-hammer shock, flow structures and waves differ in flow dynamics. For the case of the embedded air cavity, transmitted shock waves are formed, and they further compress the air cavity. Intermittent interface fusion is induced by the main vertical jet, lateral jet and sheet jet. A series of small air cavities and a range of intermittent collapse compression wavelets are generated during the collapse. However, for the case of the vapour cavity in the saturated state, initially no transmitted waves are generated as the vapour cavity rapidly shrinks accompanied by local condensation. As the cavity completely vanishes, strong collapsing shock waves are observed in the flow field.
Although the evolution dynamics are different, the collapsing times for the two kinds of embedded cavities are very close to each other. The collapsing time of the cavity depends on the intensity of the water-hammer shock wave and the cavity configuration. A theoretical formula to predict the collapsing time
 $t_{collapse}$
is improved based on the regulation of Rayleigh collapse. For different initial radii and initial impinging speeds, the collapse times are predicted well by the theoretical model. The values of
 $p_{max}$
during the collapse of the air cavities with different initial radii are smaller than those during the collapse of the vapour cavities. It is found that the highest pressure appears in the case of a vapour cavity collapsing with an initial radius of
 $0.375R_{0}$
, and it reaches about
 $30\times 10^{8}~\text{Pa}$
, nearly 30 times higher than the triggering pressure.
In general, the pressures on the rigid wall in the entire impaction process are compared to evaluate the action due to the collapse of the cavities. They increase with an increased initial size of the vapour cavity. The value of
 $p_{wall\_max}$
induced by the collapse of the vapour cavities is larger than that induced by the collapse of the air cavities. Such an increase in pressure on the rigid wall will enhance the adhesion properties during a coating procedure using hollow droplets, compared with the dense droplet impinging process.
Acknowledgements
The authors acknowledge partial financial support from the Natural Science Foundation of China (no. 51676111&11628206, no. NSAF-U1730104), State Key Laboratory of Chemical Engineering (no. SKL-ChE-16A02) and the Tsinghua University Initiative Scientific Research Program.
Appendix A
To examine the computation result in terms of grid sensitivity, three different grid resolutions are chosen in this study as 1.2 (grid-level I), 4.8 (grid-level II) and 10.8 million cells (grid-level III). Correspondingly, the grid cells per column diameter are 500, 1000 and 1500, respectively.
The numerical results of a cylindrical water droplet impinging the wall with an initial speed of
 $150~\text{m}~\text{s}^{-1}$
are compared for three different grid resolutions. The pressure contours and numerical schlieren images at the same instant are shown in figure 12(a). The pressure profile near the wall
 $p(x,Y_{wall})$
as a function of
 $x$
, the pressure profile along the
 $y$
-axis
 $p(X_{centre},y)$
as a function of wall distance
 $y$
and
 $p(x,Y_{shock})$
are compared in figure 12(b). Here,
 $Y_{shock}$
is the distance away from the wall where the water-hammer shock intersects with the droplet surface.
The pressure contours and pressure profiles under the three grid resolutions,
 $t/(D_{0}/c_{l})=0.5$
. (a) Left half of each panel: pressure contour non-dimensionalized by
 $p_{0}$
where the position of the gas/liquid interface is located exactly by the volume fraction of the gas. Right half of each panel: numerical density schlieren image. (b) The non-dimensionalized pressure profiles for
 $p(x,Y_{wall})$
,
 $p(X_{centre},y)$
and
 $p(x,Y_{shock})$
.

As shown, very similar distributions are obtained for the numerical results under the three different grid resolutions. It can be found that there exists an obvious pressure jump due to the confined shock wave at the same position. The pressure distribution and wave structures are also quite similar for the three grid resolutions, as shown by the pressure and density schlieren contours in figure 12(a). There are some slight deviations in the pressure profiles behind the shock wave for grid-level I, while the pressure profiles for the other two higher grid resolutions are overlapped well, as shown in figure 12(b).
With consideration of computational efficiency and mesh resolution, grid-level II is finally chosen in the present study. The validation of the present numerical procedure has also been done in previous work (Wu, Xiang & Wang Reference Wu, Xiang and Wang2018), in which a comparison has been made for the numerical results against the experimental visualization for the high-speed droplet impingement problem.
Appendix B
In order to validate the phase transition model and its numerical procedures, the Rayleigh collapse of a two-dimensional vapour bubble is simulated. In this case, a cylindrical vapour bubble with a radius of
 $58~\unicode[STIX]{x03BC}\text{m}$
is initially surrounded by liquid water, where the states of the vapour cavity and surrounding water are the same as those presented in table 2. The calculation parameters are taken the same as those in the experiment by Quinto-Su et al. (Reference Quinto-Su, Lim and Ohl2009).
The initial configuration (a) and the simulation results (b) of the time–radius variation for the Rayleigh collapse of a vapour bubble (the radius of the vapour bubble at different instants: the solid line, filled rhombus and dashed line denote the present numerical results, experimental results from Quinto-Su et al. (Reference Quinto-Su, Lim and Ohl2009) and two-dimensional theoretical estimation results, respectively).

The configuration of the computational domain is demonstrated in figure 13(a), and the simulation results for the time–radius variation are shown in figure 13(b). Both experimental and theoretical results are also presented for comparison. The error bar of the time is
 $\pm 0.5~\unicode[STIX]{x03BC}\text{s}$
and the standard deviation of the radius over five simulation runs is
 $\pm 2~\unicode[STIX]{x03BC}\text{m}$
for each experimental data point. The theoretical prediction results shown in figure 13(b) are calculated via the two-dimensional Rayleigh equation (Lohse et al.
Reference Lohse, Bergmann, Mikkelsen, Zeilstra, van der Meer, Versluis, van der Weele, van der Hoef and Kuipers2004; Quinto-Su et al.
Reference Quinto-Su, Lim and Ohl2009; Quinto-Su & Ohl Reference Quinto-Su and Ohl2009; Ilinskii et al.
Reference Ilinskii, Zabolotskaya, Hay and Hamilton2012), which is simplified from the well-known three-dimensional Rayleigh equation (Rayleigh Reference Rayleigh1917; Franc & Michel Reference Franc and Michel2006; Brennen Reference Brennen2013).
Additionally, the three-dimensional Rayleigh equation can provide a theoretical expression for the characteristic collapsing time, also called the Rayleigh time,
 $\unicode[STIX]{x1D70F}_{c\_R}^{3D}$
(Franc & Michel Reference Franc and Michel2006). This corresponds to the instant when the cavity first shrinks from its maximum radius to its minimum one:
 $$\begin{eqnarray}\unicode[STIX]{x1D70F}_{c\_R}^{3D}=0.915R_{ max}\sqrt{\frac{\unicode[STIX]{x1D70C}_{l}}{p_{\infty }-p_{cavity}}}.\end{eqnarray}$$
Referring to Quinto-Su et al. (Reference Quinto-Su, Lim and Ohl2009), the two-dimensional Rayleigh equation, however, gives the expression of
 $\unicode[STIX]{x1D70F}_{c\_R}^{2D}$
as
 $$\begin{eqnarray}\unicode[STIX]{x1D70F}_{c\_R}^{2D}\sim \unicode[STIX]{x1D70F}_{c\_R}^{3D}[\log (R_{\infty }/R_{\max })]^{1/2},\end{eqnarray}$$
where the coefficient can be approximated as
 $[\log (R_{\infty }/R_{\max })]^{1/2}\sim 1.5$
. With the help of the theoretical expression of
 $\unicode[STIX]{x1D70F}_{c\_R}^{2D}$
, an estimation of the collapsing time for the present two-dimensional shock-induced collapse time,
 $\unicode[STIX]{x1D70F}_{c}$
, can be theoretically obtained, as discussed in § 4.1.
As shown in figure 13(b), the simulation results, demonstrating the cavity radius evolution process, show good agreement with both the experimental and the theoretical data. The present mathematical model and numerical procedure show good capability for solving the problem of the vapour bubble collapse.
Appendix C
The simulation results for the impingement of a rotationally symmetric droplet are presented here, with an initial impact speed of
 $150~\text{m}~\text{s}^{-1}$
. The embedded cavity is taken as either water vapour or air with an initial radius of
 $0.25R_{0}$
for comparison. The flow field is symmetric around the
 $y$
-axis (
 $y$
is the axial direction and
 $x$
is the radial direction), and the rotationally symmetric droplet impingement problem is considered to approximate the three-dimensional problem. The detailed expressions of the geometric source terms related to the rotationally symmetric system can be found in Toro (Reference Toro2013).
The numerical results for a droplet embedded with a vapour cavity are shown in figure 14 for different time instants. The primary evolution processes are quite similar for the previous planar two-dimensional and current rotationally symmetric cases, but there are some differences.
Instantaneous numerical results for the impingement of a hollow rotationally symmetric droplet, which is embedded with a vapour cavity (
 $r_{0}=0.25R_{0}$
), with an initial impact speed of
 $150~\text{m}~\text{s}^{-1}$
: (a)
 $t/(D_{0}/c_{l})=0.30$
, (b)
 $t/(D_{0}/c_{l})=1.32$
, (c)
 $t/(D_{0}/c_{l})=2.07$
, (d)
 $t/(D_{0}/c_{l})=2.14$
, (e)
 $t/(D_{0}/c_{l})=2.41$
and (f)
 $t/(D_{0}/c_{l})=2.62$
. Left half of each panel: pressure contours non-dimensionalized by
 $p_{0}$
. Right half of each panel: numerical schlieren images.

Typical pressure values obtained for the rotationally symmetric simulations.

Comparing the results in figure 14(a) with those in figure 2, the strengths of the impinging shock wave for the rotationally symmetric case are lower than those for the planar two-dimensional cases at the same time instant. The pressure behind the shock front can be determined with the help of the linear approximation. Referring to the work by Lesser (Reference Lesser1981), the instantaneous pressure can be related to curvature of the shock wave front for the two-dimensional case (or the cylindrical wave front) as follows:
 $$\begin{eqnarray}p_{s}(t_{2})=p_{s}(t_{1})\sqrt{\frac{R_{s}(t_{1})}{R_{s}(t_{2})}},\end{eqnarray}$$
where
 $p_{s}(t)$
is the pressure value after the shock front and
 $R_{s}(t)$
is the radius of the curvature of the wave front at the instant of
 $t$
. Whereas, for the three-dimensional spherical wave front, the pressure is then formulated as
 $$\begin{eqnarray}p_{s}^{3D}(t_{2})=p_{s}^{3D}(t_{1})\frac{R_{s}(t_{1})}{R_{s}(t_{2})}.\end{eqnarray}$$
Hence, the pressure behind the shock wave gradually decreases as the confined shock front expands. However, the post-wave pressure decreases more quickly for the case of the spherical wave generated in the rotationally symmetric droplet, comparing (C 1) with (C 2).
Several typical pressure values are captured and shown in table 3. Due to the quicker decay for the rotationally symmetric case,
 $p_{s}$
(the value of the pressure after the shock front when the shock wave just interacts with the cavity, i.e. the triggering pressure of cavity collapse) is lower than for the planar two-dimensional cases. Furthermore, the rotationally symmetric configuration can intensify the focus effect of the waves. As shown in figure 14(b), there exists a local high-pressure zone close to the top pole of the droplet due to the focus of the second reflected compression waves, where the instantaneous peak pressure can reach
 $450~\text{MPa}$
, compared with
 $110~\text{MPa}$
for the planar two-dimensional case. Due to the intensified focus effect of the waves, the maximum local transient pressure (
 $p_{max}$
) during the embedded vapour cavity collapse is higher for the rotationally symmetric case, though the triggering pressure value (
 $p_{s}^{3D}$
) is lower. However, the values of
 $p_{max}$
are slightly different for the air cavity collapse in both the planar two-dimensional and rotationally symmetric cases.
After the embedded cavity collapse, similar to the planar two-dimensional cases, collapse waves are generated. As shown in figure 14(e,f), the pressure behind the compression waves decreases more quickly during the expansion of the waves, and the collapse waves will be weaker when they propagate towards the solid wall for the rotationally symmetric situation. Meanwhile, as shown in table 3, the values of
 $p_{wall\_max}$
(the maximum value of mean pressure on the solid wall over the monitoring range) for the rotationally symmetric case are lower than those for the planar two-dimensional case for both the air and vapour cavities. According to the above analysis, the rotationally symmetric configuration can intensify both the expansion and focus effect during wave propagation inside the droplet.