Introduction
Calcareous benthic foraminifera are important components of modern and ancient marine ecosystems and a key tool in paleoceanography (Sen Gupta Reference Sen Gupta1999). The majority of benthic foraminifera colonize oxygenated pore waters and surface sediments, yet a considerable number of living species belonging to this group are known to tolerate short or long term anoxic to dysoxic and even sulfidic conditions (e.g., Bernhard 1993; Moodley et al. Reference Moodley, van der Zwaan, Herman, Kempers and van Breugel1997; Bernhard and Reimers Reference Bernhard and Reimers1991; Geslin et al. Reference Geslin, Risgaard-Petersen, Lombard, Metzger, Langlet and Jorissen2011, Reference Geslin, Barras, Langlet, Nardelli, Kim, Bonnin, Metzger and Jorissen2014; Langlet et al. Reference Langlet, Baal, Geslin, Metzger, Zuschin, Riedel, Risgaard-Petersen, Stachowitsch and Jorissen2014) by means of diverse physiological and respiratory adaptations such as complete or bacterially mediated denitrification, kleptoplastidy (sequestration of algae plastids by an organism) or other symbiotic associations with bacteria or archaea (Gooday et al. Reference Gooday, Bernhard, Levin and Suhr2000; Bernhard Reference Bernhard2003; Bernhard et al. Reference Bernhard, Visscher and Bowser2003; Bernhard et al. Reference Bernhard, Habura and Bowser2006; Risgaard-Petersen et al. Reference Risgaard-Petersen, Langezaal, Ingvardsen, Schmid, Jetten, Op den Camp, Derksen, Piña-Ochoa, Eriksson, Nielsen, Revsbech, Cedhagen and van der Zwaan2006; Høgslund et al. Reference Høgslund, Revsbech, Cedhagen, Nielsen and Gallardo2008; Pucci et al. Reference Pucci, Geslin, Barras, Morigi, Sabbatini, Negri and Jorissen2009; Bernhard et al. Reference Bernhard, Goldstein and Bowser2010; Leiter and Altenbach Reference Leiter and Altenbach2010; Piña-Ochoa et al. Reference Piña-Ochoa, Høgslund, Geslin, Cedhagen, Revsbech, Nielsen, Schweizer, Jorissen, Rysgaard and Risgaard-Petersen2010; Bernhard et al. Reference Bernhard, Casciotti, McIlvin, Beaudoin, Visscher and Edgcomb2012a,Reference Bernhard, Edgcomb, Casciotti, McIlvin and Beaudoinb; Koho and Piña-Ochoa Reference Koho and Piña-Ochoa2012; Tsuchiya et al. 2015). Recent studies have also shown that these foraminifera are able to calcify under anoxic conditions, at various depths in the sediment, with or without nitrates (Geslin et al. Reference Geslin, Barras, Langlet, Nardelli, Kim, Bonnin, Metzger and Jorissen2014; Nardelli et al. 2014). These adaptations allow them to survive and even be active in the most extreme oxygen minimum zones, such as those prevailing in modern upwelling systems (Høgslund et al. Reference Høgslund, Revsbech, Cedhagen, Nielsen and Gallardo2008).
The discovery of these versatile adaptations among phylogenetically diverse and geographically widespread appearances of foraminifers (e.g., denitrification in Piña-Ochoa et al. Reference Piña-Ochoa, Høgslund, Geslin, Cedhagen, Revsbech, Nielsen, Schweizer, Jorissen, Rysgaard and Risgaard-Petersen2010), presents a new and potentially groundbreaking challenge to the field of paleoceanography. The geologic record bears many episodes of widespread bottom water anoxia and benthic foraminifera were reported in some of these strata (Friedrich Reference Friedrich2010). Yet so far no direct evidence has been reported to validate the notion that certain fossil benthic foraminifera were able to survive anoxia by utilizing similar physiological adaptations as their modern descendants.
A major obstacle for such interpretation is providing direct evidence for the co-occurrence of benthic foraminifera and anoxic environments. Friedrich (Reference Friedrich2010) termed the difficulty to prove this co-occurrence within mid Cretaceous oceanic anoxic events (OAE) as the “anoxic benthic foraminifera paradox,” likely resulting from an artifact of sample spacing; i.e., the merging of hundreds to thousands of years in a single sample.
Here we present new evidence from the Late Cretaceous Levantine high productivity sequence (upper Menuha, Mishash, and lower Ghareb formations), which show that different benthic foraminifera species with diverse morphologies were able to tolerate and successfully colonize anoxic-dysoxic (i.e., anoxic=no dissolved oxygen, dysoxic=0.1–1 ml/l; Bernhard and Sen Gupta Reference Bernhard and Sen Gupta1999; Altenbach et al. Reference Altenbach, Bernhard and Seckbach2012) bottom water environments. This unique depositional environment was investigated using a combination of foraminiferal records and diverse geochemical proxies analyzed in the same samples. This approach allowed us to recognize faunal shifts and their environmental settings and to take a further step in inferring specific biological adaptations that enabled benthic foraminifera to successfully colonize anoxic to dysoxic environments, in a similar manner as their modern successors.
The Upper Cretaceous Tethyan Upwelling System
The Upper Cretaceous Levantine high productivity sequence is a product of an extensive upwelling system that prevailed in the Southern Tethys (Fig. 1) for ~19 Ma from late Coniacian to mid Maastrichtian (Soudry et al. Reference Soudry, Glenn, Nathan, Segal and VonderHaar2006; Meilijson et al. Reference Meilijson, Ashckenazi-Polivoda, Ron-Yankovich, Illner, Alsenz, Speijer, Almogi-Labin, Feinstein, Berner, Püttmann and Abramovich2014). The upwelling induced a high nutrient regime with extremely high primary productivity in the upper part of the water column and oxygen depletion at the seafloor (Almogi-Labin et al. Reference Almogi-Labin, Bein and Sass1993; Ashckenazi-Polivoda et al. Reference Ashckenazi-Polivoda, Abramovich, Almogi-Labin, Schneider-Mor, Feinstein, Puttmann and Berner2011).
Paleogeographic reconstruction showing the upwelling belts that developed along the Southern Tethys margin during the late Coniacian–Maastrichtian. The star marks the location of the study area (modified after Ashckenazi-Polivoda et al. Reference Ashckenazi-Polivoda, Abramovich, Almogi-Labin, Schneider-Mor, Feinstein, Puttmann and Berner2011).

The diverse upper Coniacian, Santonian, and Campanian sedimentary sequence (upper Menuha and Mishash formations) is enriched in silica (e.g., porcellanite beds, chert nodules and massive and brecciated chert beds) and phosphate (carbonate fluorapatite). These lithologies disappear above the Campanian/Maastrichtian boundary (~72.1 Ma) when oil shale becomes the dominant deposit throughout the entire region, accompanied by significantly elevated organic carbon levels, during the lower part of the Ghareb Formation. This lithological shift was triggered by a change in the dominant forms of primary producers in the upper water column: from diatoms along the siliceous Campanian to calcareous nannoplankton (e.g., coccolithophorids) in the Maastrichtian, as also evident by thiophenic biomarkers (Sinninghe Damsté et al. Reference Sinninghe Damsté, Kohnen and de Leeuw1990).
Our study focuses on the high productivity deposits from two basins in southern (Negev; Saraf and PAMA sections) and central (Shefela; Aderet core) Israel (Fig. 2), which represent proximal and distal locations respectively, within the upwelling belt. These deposits contain highly abundant and diverse benthic and planktic foraminiferal assemblages, and therefore provide an ideal test case to study the association of benthic foraminifera and anoxic environments.
Location map of the studied sections projected on the Top Judea Group horizon structural map (Fleischer and Gafsou Reference Fleischer and Gafsou2003). Black arrows represent the Syrian Arc structural pattern.
Materials and Methods
Foraminifera
175 samples were analyzed from the Shefela and Negev basins. Samples were disaggregated and soaked in a 3% sodium hypochlorite solution at 45°C for 3–9 days to remove the organic matter (OM) from the sediment. From each sample, ~300 benthic foraminiferal specimens from the >63 μm size fraction were picked from a split aliquot representing the entire sample. Statistical analysis of the relative abundances of species was done using the PAST software package (Hammer et al., Reference Hammer, Harper and Ryan2001; Hammer and Harper, Reference Hammer and Harper2006).
Petrography
60 samples from the Shefela basin were prepared as thin sections and studied under reflected light, following the compilation of Flügel (Reference Flügel2010 and references therein). Organic petrology analysis was carried out by Core Lab, Houston, Texas on 10 samples from the two basins. The whole rock and kerogen concentrate polished slabs were analyzed under reflected light and oil immersion. The kerogen concentrates placed on glass slides were analyzed using transmitted white and reflected UV light. This analysis was carried out in order to identify the type of kerogen present in the samples, particularly if it dominantly originated from marine or terrestrial OM (e.g., Hutton Reference Hutton1987, Reference Hutton1991; Dyni Reference Dyni2005).
Total organic carbon (TOC), total carbon (TC) and total sulfur (TS)
Carbon and sulfur content were measured using an SC632 LECO carbon and sulfur determinator on a total of 400 samples from the two basins.
δ15Norg and δ13Corg
Analysis was performed on 118 samples selected from the two basins using an elemental analyzer (1112 Flash EA, Thermo Finnigan) interfaced with an isotope ratio mass spectrometer (EA IRMS Delta V Plus, Thermo Scientific) for the Aderet core samples, and a Carlo Erba EA1110 elemental analyzer in line with Finnigan MAT252 stable isotope ratio mass spectrometer for the PAMA section samples (see full description of analysis in Schneider-Mor et al. Reference Schneider-Mor, Alsenz, Ashckenazi-Polivoda, Illner, Abramovich, Feinstein, Almogi-Labin, Berner and Puttmann2012). The carbon and nitrogen isotopes were measured simultaneously from the same sample by peak jumping with mean standard deviation of 0.19‰ and 0.28‰ for δ13Corg and δ15Norg, respectively. All results are reported relative to PDB for δ13Corg and relative to air for δ15Norg.
Bulk and clay mineralogy
XRD analysis was performed on 49 samples from the two basins using a Philips PW 1830 diffractometer. The procedure used for the kerogen removal is based on the Jackson Treatments (Jackson Reference Jackson2005).
Kerogen pyrolysis
Rock Eval 6 pyrolysis was performed on 103 samples from the Shefela basin to identify the type and maturity of the OM, following Tissot and Welte (Reference Tissot and Welte1984), Emeis and Kvenvolden (Reference Emeis and Kvenvolden1986), Lafargue et al. (Reference Lafargue, Espitalié, Marquis and Pilot1998), and Behar et al. (Reference Behar, Beaumont, De and Penteado2001).
Trace elements
351 samples from the two basins were investigated by means of energy dispersive X ray fluorescence analysis (ED XRF) using an Epsilon 5 spectrometer (PANalytical). The results of the trace elements analyses have been interpreted by means of multivariate statistical methods in order to assess the inter element relationships. This method groups related variables into a limited number of factors that account for a substantial proportion of the variance of the data. Details from this method are given in Costello and Osborne (Reference Costello and Osborne2007) and Suhr (Reference Suhr2009). The program STATISTICA 6.0 was used for principal component analysis (PCA). After extraction of principal components, factor axes were rotated by normalized Varimax method to facilitate the interpretation loadings and consequent interpretations of the depositional environment.
Biomarker analysis
GC MS biomarker analyses were performed on a Trace GC Ultra gas chromatograph coupled with a dual stage quadrupole (DSQ II) mass spectrometer (Thermo Fisher) on 113 samples from the two basins. The data were recorded, processed, and quantified with Xcalibur software (see full description of analysis in Schneider-Mor et al. Reference Schneider-Mor, Alsenz, Ashckenazi-Polivoda, Illner, Abramovich, Feinstein, Almogi-Labin, Berner and Puttmann2012).
Results
Depositional Environment
The environmental proxies analyzed in this study indicate a predominantly marine depositional environment with a very low contribution of continentally derived material. The lithology of the studied sequence is mainly composed of marine carbonates, a relatively low amount of clays (<20%) and minor contribution of continentally derived minerals, such as quartz (Fig. 6). The marine origin of these sediments and lack of continentally derived sedimentation is also supported by the dominance of smectite IS (interstratified illite/smectite rich in smectite layers) in the clay fraction which has originated by conversion of the smectite transported from the open marine environment to the synclinal depositional basins (Shoval Reference Shoval2004).
The petrographic classification is dominantly foraminiferal bioclastic wackestone. Some of the grains have undergone micritization at different extents, while bioerosion is very rare. The matrix and non skeletal grains throughout most of the section are made of dense dark micrite characteristic of pelagic settings, peloids and very few quartz and dolomite grains (Fig. 3). Dark mottles appear in the matrix throughout the section, as well as areas of dense black round peloid like grains floating in the matrix and within cavities such as foraminiferal tests. These forms, as seen in transmitted light microscopy, are OM concentrations or pyrite crystals. No evidence, e.g., accumulation of shells, graded bedding, parallel and cross lamination, ripple bedding, and/or erosion surfaces, (cf. Boggs Reference Boggs2009; Flügel Reference Flügel2010) supporting turbidities, tempestites, or mass flows were recognized.
A–H, Selected images from the organic petrology analysis. A, (reflected light), sapropelic vitrinitic kerogen particle (SKgn) with slight granularity (Ro=0.32%); B, (reflected light), unicellular marine Tasmanales algae (Ta) (Ro=0.44%); C, (reflected light), an allochthonous fragment of inertinite (Int) showing open cell structure; Ghareb Formation, Shefela; D, (reflected UV light), a large dinoflagellate (Din); E, (reflected UV light), fluorescing amorphous matrix (Fl am) and a broken dinocyst fragment (Din); F, (reflected light), fecal pellets (Fec; Ro=0.252%), a bivalve fragment (Biv) is seen on the left, Q=quartz grain; lower Oil Shale Member, Negev; G, (reflected UV light), fluorescing sapropelinite (Sap); H, (transmitted light), amorphous kerogen resembling type II. I–L, selected images from the sedimentary petrology analysis. Photographs were taken under transmitted light. Ghareb Formation, Shefela, I, large uniserial foraminifera (Siphonodosaria; Uni); Mishash Formation, Shefela (J) and Negev (K) Phosphate grain (P); Ghareb Formation, Shefela; L, Peleoidal organic matter in a micritic matrix.
The organic petrology analysis classifies the OM as marinite indicating that it is derived from marine phytoplankton, with a negligible contribution of terrestrial OM (Fig. 3). The analyzed samples typically contain sapropelic kerogen (H rich); fluorescing amorphous matrix bituminite, minor laminate alginite, Tasmanales marine algae, and minor inertized spores and oxidized fragments. The matrix is calcareous, with few rhombohedral dolomite grains, pyrite, and plenty of foraminiferal shells, which are typical of marine oil shale (cf. Hutton Reference Hutton1987, Reference Hutton1991; Dyni Reference Dyni2005).
The marine source for the OM is also supported by the kerogen type II (Hutton et al. Reference Hutton, Bharati and Robl1994) as indicated by Rock Eval pyrolysis (Fig. 4). Ts/(Ts+Tm) is the ratio between 18α and 17α trisnorhopanes, which depends on the lithology and source and maturity of the OM (Moldowan et al. 1986). We assume that the very low Ts/(Ts+Tm) ratio in the Upper Cretaceous OM in Israel (Fig. 5) reflects a low maturity clay poor marine carbonate source rock (Mckirdy et al. 1983; Peters et al. Reference Peters, Walters and Moldowan2005). The low maturity of the OM is also implied by the low Rock Eval Tmax mean value of 412°C. The very low dia/regular sterane ratio (Fig. 5) is also indicative of a carbonate marine environment (Peters et al. Reference Peters, Walters and Moldowan2005). This further supports a marine depositional environment with negligible continental contribution to the mineralogy or OM content of the sediments.
Rock Eval data (hydrogen and oxygen indexes) plotted on a Van Krevelen diagram showing a predominant type II kerogen.
Ion chromatogram of steranes (m/z 217) and terpanes (m/z 191) in bitumen extract from an Upper Cretaceous Ghareb Formation oil shale. Despite the relatively low thermal maturity, molecular parameters in the bituminous fraction such as very low Ts/(Ts+Tm), C35/C34 homohopanes >1, gammacerane (G) abundance (m/z 191) and regular/dia steranes and C28/C29 ratios (m/z 217) indicate lack of clastic contribution and an oxygen depleted depositional environment (Grantham and Wakefield Reference Grantham and Wakefield1988; Mello et al. Reference Mello, Gaglianone, Brassell and Maxwell1988; Peters and Moldowan Reference Peters and Moldowan1991). The abundance of which reflects stratified water and restricted circulation at the depositional area (Sinninghe Damsté et al. Reference Sinninghe Damsté, Kenig, Koopmans, Koster, Schouten, Hayes and de Leeuw1995).
Geochemical Evidence for an Anoxic to Dysoxic Bottom Water Environment
Geochemical proxies used in this study provide ample evidence indicating anoxic to dysoxic bottom water conditions throughout the high productivity sequence. These include: (1) the very high TOC content, reaching 22 wt.% and averaging at 11 wt.% (Fig. 7), characterized by low oxygen index (OI averaging at 28 mg CO2/g TOC) and very high hydrogen index (HI averaging at 726 mg HC/g TOC; Fig. 4); (2) the very low pristane/phytane ratio averaging at 0.5 (Fig. 7); (3) C35/C34 homohopane ratio higher than 1 (Fig. 5); (4) high sulfur content reaching 5% and averaging at 2% (Fig. 7); and (5) the common occurrences of chalcophile and redox sensitive trace elements (e.g., Zn, Cu, Ni, Cr, Y, As; Figs. 7–8).
Representative X ray diffraction results from the Aderet (AD) and PAMA (OSP, SAOA) samples, and X ray diffraction histogram (Sample AD-394).
Lithological and geochemical data from the Shefela and Negev basins. A, regional age (determined using planktic foraminifera), Stage, Formation, and biozone columns are reproduced from Meilijson et al. (Reference Meilijson, Ashckenazi-Polivoda, Ron-Yankovich, Illner, Alsenz, Speijer, Almogi-Labin, Feinstein, Berner, Püttmann and Abramovich2014). B, data from the Shefela basin (the Aderet core); Depth, lithology column and SR (sedimentation rates) are from Meilijson et al. (Reference Meilijson, Ashckenazi-Polivoda, Ron-Yankovich, Illner, Alsenz, Speijer, Almogi-Labin, Feinstein, Berner, Püttmann and Abramovich2014); TOC (total organic carbon); TE (trace elements) oxygen ranking—the curve represents an interpretation of the trace element factor analysis, using redox sensitive elements for describing unitless changes in oxygen content (see caption Fig. 8 for details); stable isotope records of δ13Corg and δ15Norg (isotope data for the Negev basin is from Schneider-Mor et al. 2012); Pristane/Phytane (Pr/Ph) ratio. C, data from the Negev basin (combined section of the Saraf and PAMA outcrops). Depth scale is linearly accommodated according to the regional ages. Columns are as in (B).
Trace elements analyses (representative data in Fig. 8A) have been interpreted by means of multivariate statistical methods in order to assess the inter element relationships. The calculated factor loadings are shown in Figure 8B in the form of horizontal bars. Only factor loadings that show values higher than 0.7 were used. The largest two eigenvalues were found to account for 82% of the total variance. Thereby, two factors have been selected. Factor 1 summarizes 44% of the total variance, that is characterized by elements with high positive factor loadings for Fe2O3(t), TiO2, Co, Ga, K2O, Rb, V, MnO, and SiO2. Only CaO comprises a negative sign, but with a high absolute value. This factor may be interpreted as a combined interplay between terrigenic and biogenic (carbonate) sedimentation. Factor 2 accounts for 38% of the total variance and mirrors the degree of bottom water oxygenation (Cu, Ni, Zn, Cr, S, Corg). However, this factor also includes elements that might represent conditions that promote phosphorite deposition (Y, As). The oxygen index is used for interpreting changes in the paleo bottom water oxygen content. The validity of the oxygen index as calculated by the trace element analysis is further established by its high correlation with TOC values (r=0.94, p>0.05; Fig. 8C), i.e., with low TOC levels correlating with increased oxygen levels and visa versa.
The HI and OI indicate mainly the hydrogen and oxygen richness of the OM, which reflects both its original composition and diagenetic conditions. In general, marine OM accumulated under anoxic or dysoxic conditions is characterized by high HI and low OI (Tissot and Welte Reference Tissot and Welte1984; Emeis and Kvenvolden Reference Emeis and Kvenvolden1986).
In most anoxic environments H2S originating from sulfate reduction will preferentially react with reduced iron to form iron monosulfides, which are transformed during diagenesis to pyrite (Berner Reference Berner1970). However, the fact that in the studied sequence most of the sulfur is incorporated into the OM indicates that the supply of reduced iron in the water column was limited (Bein et al. Reference Bein, Almogi-labin and Sass1990; Amrani et al. Reference Amrani, Lewan and Aizenshtat2005; Alsenz et al. Reference Alsenz, Illner, Ashckenazi-Polivoda, Meilijson, Abramovich, Feinstein, Almogi-Labin, Berner and Püttmann2015). Such conditions are typical of highly productive upwelling systems with a restricted input of iron from terrigenous systems (Eglinton and Repeta Reference Eglinton and Repeta2011).
Pristane (Pr) and phytane (Ph) (C19 and C20 isoalkanes, respectively) are very common constituents of oil and solvent extract of the organic fraction in hydrocarbon source rocks. The ratio of pristane to phytane is widely attributed mainly to the redox conditions at the depositional environment of the source rock (e.g., Didyk et al. Reference Didyk, Simoneit, Brassell and Eglinton1978). This notion stems from the initial assumption that both Pr and Ph are mainly diagenetic products of the phytyl side chain of chlorophyll due to differential reactions, which are dependent on the depositional redox conditions (Maxwell et al. Reference Maxwell, Cox, Ackman and Hooper1972; Powell and McKirdy Reference Powell and McKirdy1973). However, several other factors (e.g., thermal maturity, variable biomolecules sources, diagenetic effects) have been shown to influence the level of the Pr/Ph ratio determined from crude oils, coal, and sedimentary OM and suggest that its use as an indicator for redox conditions should be done in conjunction with other paleoenvironmental proxies (e.g., Ten Haven et al. Reference Ten Haven, de Leeuw, Rullkotter and Sinninghe-Damsté1987; Rowland Reference Rowland1990; Kohnen et al. 1990; Peters et al. Reference Peters, Walters and Moldowan2005). Nevertheless, the very low Pr/Ph ratio obtained in this study (averaging at 0.5; Fig. 7), and in concurrence with the very high TOC values and other geochemical proxies, appears to mainly reflect redox depositional conditions and is indicative of anoxic to dysoxic conditions.
The C35/C34 homohopane ratio is often used as an indicator of the redox potential during and immediately after deposition of the source sediments (Peters and Moldowan Reference Peters and Moldowan1991; Peters et al. Reference Peters, Walters and Moldowan2005). In this study, the high C35/C34 homohopane ratio (>1; Fig. 5) supports the occurrence of anoxic conditions. The very low dia/regular sterane ratio (Fig. 5) is also considered as indicative of an anoxic environment (Peters et al. Reference Peters, Walters and Moldowan2005).
Changes in the degree of water oxygenation are marked by a factor which includes redox sensitive and chalkophile elements, the content of which increases during times of low redox conditions (Fig. 8). A high correlation (R=0.94) is recorded between changes in the degree of oxygenation and TOC (Fig. 8C). The trace element analysis further suggests that within this sequence, a conspicuously distinct indication for anoxic conditions occurred following the Campanian/Maastrichtian boundary, within the TOC rich zone (Figs. 7–8).
Denitrification In An Oxygen Depleted Environment
The δ13Corg values are very low (−30‰ to −26‰) throughout the high productivity sequence (Fig. 7), possibly reflecting selective removal of 13C enriched carbohydrates and protein fractions via denitrification or anammox under oxygen deficient conditions in bottom waters (Meyers Reference Meyers1994; Lehmann et al. Reference Lehmann, Bernasconi, Barbieri and McKenzie2002; Schneider-Mor et al. Reference Schneider-Mor, Alsenz, Ashckenazi-Polivoda, Illner, Abramovich, Feinstein, Almogi-Labin, Berner and Puttmann2012). However, these values might also represent periods of elevated pCO2 or a more dense stratification of the surface ocean in the high productivity environment (Meyers Reference Meyers2014).
The positive shift in δ15Norg records from 0‰ to ~7‰ from the Santonian to the Maastrichtian (Fig. 7), can be interpreted in several ways by comparison with studies of present day oceanography. If the mean marine δ15N values in the Late Cretaceous had a different base line than today, then this shift might be equivalent to a shift from present day deep ocean δ15N of ~5‰ to 12‰, which is considered as indicative of denitrification (Sigman et al. Reference Sigman, Altabet, McCorkle, Francois and Fischer2000; Galbraith et al. Reference Galbraith, Kienast, Albuquerque, Altabet, Batista, Bianchi, Calvert, Contreras, Crosta, De Pol-Holz, Dubois, Etourneau, Francois, Hsu, Ivanochko, Jaccard, Kao, Kiefer, Kienast, Lehmann, Martinez, McCarthy, Meckler, Mix, Mobius, Pedersen, Pichevin, Quan, Robinson, Ryabenko, Schmittner, Schneider, Schneider-Mor, Shigemitsu, Sinclair, Somes, Studer, Tesdal, Thunell and Yang2013). If so, then denitrification in the water column was more substantial during the Maastrichtian relative to the lower part of the sequence.
Conversely, if present day and Cretaceous normal marine δ15N values distribute similarly, then those acquired in the present study might represent an earlier stage of the δ15N cycle (as presented by Quan et al. Reference Quan, van de Schootbrugge, Field, Rosenthal and Falkowski2008, Reference Quan, James and Falkowski2013). Nitrifying bacteria are obligate aerobes, while denitrifiers are facultative anaerobes (Quan et al. Reference Quan, van de Schootbrugge, Field, Rosenthal and Falkowski2008). When there is no oxygen in the water column, nitrate cannot be formed and, as a result, the only available nitrogen is fixed through atmospheric N2 by diazotrophic bacteria with a δ15N value close to zero (Quan et al. Reference Quan, van de Schootbrugge, Field, Rosenthal and Falkowski2008; Higgins et al. Reference Higgins, Robinson, Husson, Carter and Pearson2012; Robinson et al. Reference Robinson, Kienast, Albuquerque, Altabet, Contreras, De Pol-Holz, Dubois, Francois, Galbraith, Hsu, Ivanochko, Jaccard, Kao, Kiefer, Kienast, Lehmann, Martinez, McCarthy, Möbius, Pedersen, Quan, Ryabenko, Schmittner, Schneider, Schneider-Mor, Shigemitsu, Sinclair, Somes, Studer, Thunell and Yang2012). As oxygen levels rise in the water column to dysoxic conditions, so do the nitrate concentrations, leading to an increase in the levels of denitrification that, in turn, removes isotopically light nitrate. Denitrification processes peak towards (but not at) the establishment of oxic conditions reaching δ15N value of 12‰, which drop back to ca. 6‰ during the oxygenated phase. According to this model, the δ15Norg records obtained in this study represent complete anoxia at the lower Santonian to lower Campanian part of the section and dysoxic conditions during the Maastrichtian. While the scope of this study does not provide a definitive explanation for the δ15N values, both models presented above support the up section increasing occurrence of denitrification processes, which were much more substantial following the Campanian/Maastrichtian boundary.
Faunal and Morphotype Analyses of Benthic Foraminifera
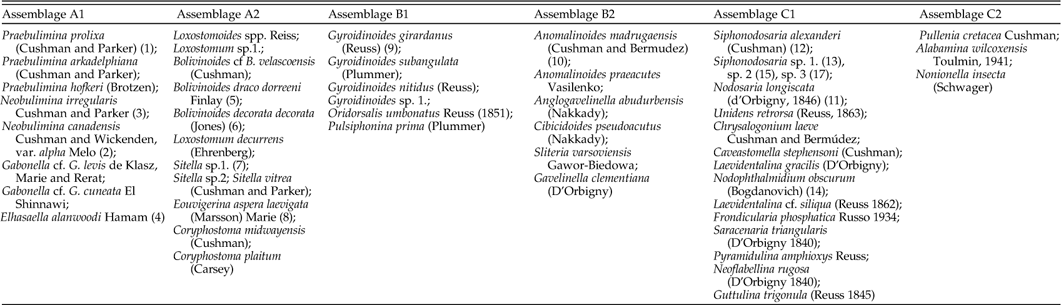
A high number of 160 species of benthic foraminifera were identified in the studied sequence (representation of the most abundant species appears in Table 1), indicating that the prevalence of long term anoxic to dysoxic bottom water conditions of the upwelling regime actually supported diverse benthic communities. Moreover, the distinct blooming events of particular species during the Santonian and Campanian intervals (Figs. 9–10) suggest that certain adaptations enabled them to effectively colonize these environments.
Faunal and environmental variations in the Shefela and Negev basins. A, regional data after Meilijson et al. (Reference Meilijson, Ashckenazi-Polivoda, Ron-Yankovich, Illner, Alsenz, Speijer, Almogi-Labin, Feinstein, Berner, Püttmann and Abramovich2014): Santonian (Sant.), Dicarinella asymetrica (D. asym.), Contusotruncana plummerae (C. plumm). B, data from the Shefela basin, Aderet core; sedimentation rates (SR), total organic carbon (TOC), benthic foraminifera specimens/gram dry sediment (BFN), relative abundance of the R mode clusters. C, Negev area (Saraf, Almogi-Labin et al. Reference Almogi-Labin, Bein and Sass1993; PAMA, Ashckenazi-Polivoda et al. Reference Ashckenazi-Polivoda, Abramovich, Almogi-Labin, Schneider-Mor, Feinstein, Puttmann and Berner2011) depth scale is linearly accommodated according to the regional ages. D, faunal shift from biserial/triserial to trochospiral and uniserial dominated foraminiferal assemblages in the TOC rich zone following the Campanian/Maastrichtian boundary. Phytoplankton dominance is evaluated based on published biomarker records in Jordan (Sinninghe Damsté et al. Reference Sinninghe Damsté, Kohnen and de Leeuw1990). Elhasaella alanwoodi (E. A), alkylthiophene (alk.).
Relative abundances of the 25 groups used for statistical R mode cluster analysis. Faunal clusters A (A1, A2), B (B1, B2) and C (C1, C2) are indicated. Lithology column legend appears in Figure 7. Data shown is from the Aderet core, which provides the most comprehensive cover of the cumulative depositional time interval.
Representative and dominant (>5%) species in the three clustered assemblages. Number in brackets refers to the specie’s picture in Fig. 11.
The most striking faunal change is the shift from biserial and triserial (mainly buliminid) dominated to diverse trochospiral dominated assemblages, occurring regionally around the Campanian/Maastrichtian boundary. These changes are best illustrated by the clustering of three main benthic foraminiferal assemblages (Figs. 9–11) that are distinguished by their test morphology, lithological association and the time period in which they were dominant. These include biserial and triserial (buliminid) forms (A), trochospiral forms (B), and mainly uniserial forms (C). Each assemblage is also subdivided by a 2nd order clustering.
A–C, SEM micrographs of the R mode clusters demonstrating strong morphologic homogeneity (nomenclature of the dominant species; Table 1). A, biserial and triserial. B, trochospiral; B1, smooth tests; B2, perforated by macro pores. C, mainly uniserial. D, morphological adaptations for kleptoplastidy and bacterial symbiosis; Cretaceous. 19–20, loop shaped line of teeth surrounding the aperture and a toothplate (P. prolixa). 21, serrated toothplate (Praebulimina sp). 22, toothplate and double folded lip aperture (N. canadensis). 23, surface covered with tiny pustules and pores (P. prolixa). Recent (24–25 from Austin et al. Reference Austin, Austin and Paterson2005). 24, Haynesina germanica with a large diatom feeding bundle. 25, teeth like tubercles (H. germanica). 26–28, from Bernhard and Bowser Reference Bernhard and Bowser1999. 26, double lip aperture and tooth plate (Bulimina elegantissima). 27, teeth lining the entire aperture (Nonionella stella). 28, empty diatom frustule and apertural teeth (N. stella). 29–30, from Bernhard et al. Reference Bernhard, Goldstein and Bowser2010. 29, surface pores (Bolivina pacifica). 30, close up of two pores of B. pacifica showing bacterial ectobionts.
R mode cluster A
This assemblage is most dominant during the Santonian–Campanian, an interval also characterized by very high BFN (benthic foraminiferal numbers; Fig. 9), which then drastically decrease during the Maastrichtian (Fig. 9). Assemblage A (Fig. 11A) includes two sub groups, A1, which includes mainly Praebulimina (mostly P. prolixa), Neobulimina (mostly N. canadensis) and the species Elhasaella alanwoodi, while A2 includes mainly biserial species (e.g., Bolivinoides; Fig. 11A).
An ecological inference based on traditional morphotype approaches (living foraminifera: Corliss and Chen Reference Corliss and Chen1988 Corliss Reference Corliss1991; fossil record: Thomas Reference Thomas1990; Widmark and Malmgren Reference Widmark and Malmgren1992) and the common life habitats of the dominant species within this cluster (Thomas Reference Thomas1990; Widmark and Malmgren Reference Widmark and Malmgren1992; Almogi-Labin et al. Reference Almogi-Labin, Bein and Sass1993; Hart Reference Hart1996; Widmark Reference Widmark2000; Alegret et al. Reference Alegret, Molina and Thomas2001; Alegret and Thomas Reference Alegret and Thomas2009; Ashckenazi-Polivoda et al. Reference Ashckenazi-Polivoda, Edelman-Furstenberg, Almogi-Labin and Benjamini2010, Reference Ashckenazi-Polivoda, Abramovich, Almogi-Labin, Schneider-Mor, Feinstein, Puttmann and Berner2011; Almogi-Labin et al. Reference Almogi-Labin, Ashckenazi-Polivoda, Edelman-Furstenberg and Benjamini2012), suggests that species of assemblage A were generally endobenthic and possibly adapted to low oxygen environments and/or high food flux. According to the TRophic OXygen (TROX) model (Jorissen et al. Reference Jorissen, Fontanier and Thomas2007), these endobenthic species might migrate to the sediment surface in these extreme settings.
R mode cluster B
This assemblage mainly consists of trochospiral forms (Fig. 11B) with relatively low BFN values (Fig. 9). It is dominant from the Campanian/Maastrichtian boundary up through most of the Maastrichtian. The majority of species belonging to cluster B1 have a relatively smooth test (e.g., Gyroidinoides, Oridorsalis), while all species of cluster B2 are heavily perforated by macro pores located primarily on the umbilical side (e.g., gavelinellids, Anomalinoides, Cibicides).
The spiral morphotype species clustered into assemblage (B) are generally indicative of an epibenthic life mode, bottom water aeration and/or a lower flux of OM to the seafloor (Thomas Reference Thomas1990; Widmark and Malmgren Reference Widmark and Malmgren1992; Almogi-Labin et al. Reference Almogi-Labin, Bein and Sass1993; Hart Reference Hart1996; Widmark Reference Widmark2000; Alegret et al. Reference Alegret, Molina and Thomas2001; Alegret and Thomas Reference Alegret and Thomas2009; Ashckenazi-Polivoda et al. Reference Ashckenazi-Polivoda, Abramovich, Almogi-Labin, Schneider-Mor, Feinstein, Puttmann and Berner2011; Almogi-Labin et al. Reference Almogi-Labin, Ashckenazi-Polivoda, Edelman-Furstenberg and Benjamini2012). Yet the relative dominance of this fauna within the TOC rich zone and the strong line of evidence from geochemical proxies indicate that species belonging to this assemblage might have been adapted for life in the absence or near absence of oxygen.
R mode cluster C
The most common benthic foraminifera in assemblage (C) are Siphonodosaria (cylindrical erect morphology and highly ornamented with spines; Fig. 11C), Nodosaria longiscata (cylindrical erect with a smooth test) and, to a lesser extent, diverse forms of nodosariids. Cluster C1 is always the dominant sub group. Cluster C2 is the only cluster that does not comply with the morpho group division. It includes a few species with low occurrences characterized by planispiral morphologies (Fig. 11C). The relative abundance of assemblage C substantially increases from the Campanian/Maastrichtian boundary, coinciding with the biserial to triserial/trochospiral overturn (Fig. 9). Several Nonionella species remain unclustered. They appear only during the Campanian, at relatively low numbers in the Shefela basin but at considerably higher amounts in the Negev.
Discussion
Physiological Adaptations and Food Type Dependency of Benthic Foraminifera
The unique sedimentary sequence of the Late Cretaceous upwelling regime provides clear evidence for a widespread and long lived (~19 Myr) colonization of anoxic to dysoxic bottom water environments by diverse benthic foraminiferal communities. Our records also suggest that the prominent change from buliminid dominated to diverse trochospiral and uniserial dominated assemblages, near the Campanian/Maastrichtian boundary and coinciding with a distinct regional change in lithology, was triggered by a shift in the type of primary producers in the upper water column. This shift enforced a change in the life strategies used by the benthic foraminifera to survive these conditions. Following is a discussion on inferred adaptations and environmental factors which may have facilitated the survival of these diverse species under the Late Cretaceous anoxic to dysoxic conditions of the Levant.
Kleptoplastidy and Bacterial Symbionts
Kleptoplastidy is the ability of heterotrophic organisms, including foraminifera, to preserve chloroplasts of algal prey they eat (e.g., Pillet et al. Reference Pillet, de Vargas and Pawlowski2011). In this unusual “symbiotic” association, the photosynthetic organelle is retained by the hosting foraminifera (Bernhard and Bowser Reference Bernhard and Bowser1999). This chloroplast husbandry plays an important role in surviving deep water aphotic dysoxic environments (Bernhard and Bowser Reference Bernhard and Bowser1999; Bernhard Reference Bernhard2003).
Living foraminifera sequestering plastids include both coiled and biserial to triserial forms (e.g., Haynesina germanica, Bulimina elegantissima, Nonionella stella). All of these species share morphologic features that enable extraction of chloroplasts from their algal prey. These include: “teeth” rimming the apertures, toothed fossettes, a serrated toothplate, elaborate test ornamentation, double folded lip apertures and/or tubercules (Bernhard and Bowser Reference Bernhard and Bowser1999 and references therein). Contact against the sharp tubercules or teeth (Fig. 11D) rasps the moving prey, ultimately disarticulating the frustules and tearing the cell wall (Bernhard and Bowser Reference Bernhard and Bowser1999; Austin et al. Reference Austin, Austin and Paterson2005). Bernhard and Bowser (Reference Bernhard and Bowser1999) suggested that these ornamentations can be used to identify fossil species likely to have sequestered chloroplasts.
Several of these features are found among the species that bloomed during the Campanian, an interval also marked by a high abundance of diatoms (Fig. 11D): Praebulimina prolixa, the most dominant species in this part of the sequence, has a surface covered with tiny pustules, a loop shaped line of “teeth” surrounding the aperture and a toothplate; Praebulimina sp. 2 has a serrated toothplate; and, N. canadensis has an extensive toothplate and a double folded lip aperture. This raises the possibility that the buliminid blooms might have been a result of their advantageous adaptation to low oxygen settings by using diatom chloroplast sequestration. While these buliminids are generally considered endobenthic (Corliss and Chen Reference Corliss and Chen1988; Thomas Reference Thomas1990; Corliss Reference Corliss1991; Widmark and Malmgren Reference Widmark and Malmgren1992), according to the TROX model (Jorissen et al. Reference Jorissen, Fontanier and Thomas2007), in food rich oxygen poor environments these taxa would migrate to the uppermost part of the sediment and on top of it, acquiring an epibenthic mode. This might have facilitated them in obtaining fresh diatom chloroplasts.
Another supporting indication for kleptoplastidy during the diatom dominated Campanian is the distribution of several Nonionella species identified throughout the region, representing one of the very few spiral species found in high abundances in this interval. Species of Nonionella have been reported to perform kleptoplastidy in modern upwelling belts (Bernhard and Bowser Reference Bernhard and Bowser1999; Bernhard et al. Reference Bernhard, Visscher and Bowser2003).
Several foraminifera species were found to host bacteria that are known to aid aerobic inhabitants of sulfidic environments (Bernhard Reference Bernhard2003; Bernhard et al. Reference Bernhard, Habura and Bowser2006; Bernhard et al. Reference Bernhard, Goldstein and Bowser2010; Kuhnt et al. Reference Kuhnt, Friedrich, Schmiedl, Milker, Mackensen and Luckge2013), some of which have been also found to sequester chloroplasts. These studies show that ectobionts (Bernhard et al. Reference Bernhard, Goldstein and Bowser2010) are directly associated with the pores of the foraminifera test (Kuhnt et al. Reference Kuhnt, Friedrich, Schmiedl, Milker, Mackensen and Luckge2013), indicating that perforated tests may provide an adaptive advantage for associations with ectobionts. Consequently, the highly perforated test of P. prolixa (macro pores) and N. canadensis (micro pores) might also indicate an adaptation to a sulfidic bottom water environment.
Subsequently, we propose that the dominant species of assemblage A1 bloomed during the Campanian, specifically in association with the siliceous deposits, due to their adaptation of diatom related kleptoplastidy. In the relatively proximal deposits of the Negev, where siliceous lithologies are most apparent, the buliminid dominance reaches 98% of the assemblage and is uninterrupted. However, in the more distal area of the Shefela basin, where siliceous lithologies are much less apparent, the buliminid dominance is interrupted by several discrete intervals in which different trochospiral species become dominant (Fig. 9). The regional primary producer turnover from diatoms to calcareous nannoplankton which occurred around the Campanian/Maastrichtian boundary marks the practical disappearance from the entire region of these potentially kleptoplastidic species.
The Maastrichtian Benthic Predicament: Possible Denitrification in Benthic Foraminifera
While the near disappearance of assemblage A taxa around the Campanian/Maastrichtian boundary can be explained by the primary producer turnover, the following establishment of the seemingly normal marine assemblage B taxa in the anoxic TOC rich zone presents a predicament. One possibility is that this assemblage is allochthonous and was transported to the area from more oxygenated parts of the basin. However, this possibility is unlikely since the foraminiferal tests are well preserved, they do not appear in distinct laminae and there is no evidence of turbidites, tempestites, or mass flows in the sediment (Fig. 3). Another explanation is that these taxa have settled during brief intervals of ventilated seafloor conditions, as suggested in the past concerning the occurrence of inoceramids in the Demerara Rise black shales (Berrocoso et al. Reference Berrocoso, MacLeod, Calvert and Elorza2008). A similar rational was presented regarding the occurrence of benthic foraminifera along the Cretaceous OAE black shales (Friedrich Reference Friedrich2010). Yet almost all of the OAE were short term events, different in their chemistry, lithology and paleoceanographic environment from the ~19 Myr Southern Tethys upwelling system. While rapid colonization strategies might favor seasonality and short term events, a long term event of a stable high productivity/low oxygen environment might promote the development of adaptive life strategies. The fact that the transition into the epibenthic spiral dominated assemblages coincided with a long period of uninterrupted lowest oxygen levels (Figs. 7, 9), makes the scenario of periodic oxygenation less likely. The presence of inoceramids (whole specimens or well preserved prisms) at certain intervals along both sections (Fig. 9), might indicate short lived more aerated dysoxic events. However, changes in the benthic foraminiferal populations are not recorded along the intervals containing inoceramids. Additionally, inoceramids were particularly specialized at living in low oxygen settings and are reported as pioneer species in dysoxic Cretaceous basins (Sageman and Bina Reference Sageman and Bina1997; Henderson Reference Henderson2004). Therefore, their presence in the Levant sections does not contradict the geochemical evidences of continued anoxic to dysoxic conditions.
We postulate that the longevity of the high productivity system and the environmental changes which occurred along this sequence, facilitated the benthic foraminifera in developing an adaptation to living in anoxic conditions by using denitrification. Recently, foraminifera have been shown to be capable of denitrification, demonstrating that foraminifera may also participate in the direct removal of dissolved nitrate from the ocean (Risgaard-Petersen et al. Reference Risgaard-Petersen, Langezaal, Ingvardsen, Schmid, Jetten, Op den Camp, Derksen, Piña-Ochoa, Eriksson, Nielsen, Revsbech, Cedhagen and van der Zwaan2006). Both culturing and field studies suggest that the ability of foraminifera to denitrify is a widespread phenomenon (Høgslund et al. Reference Høgslund, Revsbech, Cedhagen, Nielsen and Gallardo2008; Leiter and Altenbach Reference Leiter and Altenbach2010; Piña-Ochoa et al. Reference Piña-Ochoa, Høgslund, Geslin, Cedhagen, Revsbech, Nielsen, Schweizer, Jorissen, Rysgaard and Risgaard-Petersen2010; Bernhard et al. Reference Bernhard, Casciotti, McIlvin, Beaudoin, Visscher and Edgcomb2012a,Reference Bernhard, Edgcomb, Casciotti, McIlvin and Beaudoinb), including dozens of foraminiferal species from a wide taxonomic range. The majority of field observations were conducted in areas of intense upwelling (Høgslund et al. Reference Høgslund, Revsbech, Cedhagen, Nielsen and Gallardo2008; Leiter and Altenbach Reference Leiter and Altenbach2010; Glock et al. Reference Glock, Schönfeld, Eisenhauer, Hensen, Mallon and Sommer2013). Foraminifera are reported as significant benthic denitrifiers in the oxygen minimum zone (OMZ) off Peru, representing 29–50% of the benthic denitrification occurring in the central part of this zone (Glock et al. Reference Glock, Schönfeld, Eisenhauer, Hensen, Mallon and Sommer2013).
Since benthic foraminiferal denitrification was found to be widespread in today’s oceans, it can be assumed that this was also an adaptation possibly used by some of the benthic species along the geologic record. However, while denitrification respiratory pathways in living foraminifera are increasingly reported, there are no known proxies or morphological evidence for identifying them in the fossil record. Nevertheless, the δ15Norg and δ13Corg data analyzed in the present study support the notion that denitrification processes intensified following the Campanian/Maastrichtian boundary. Consequently, the ability of these taxa to use denitrification pathways might account both for this assemblage’s first occurrence in the middle part of the core and for its co-occurrence with the anoxic indicative geochemical proxies during the Maastrichtian. However, we do not fully dismiss a model that would involve repopulation events during brief ventilation events, which are unidentifiable at the sampling resolution of the current study, and maintain this as a potential mechanism providing new stocks of taxa during semi permanent anoxia.
Food Type Availability
The change in algal source might have also affected the distribution of the dominant species within assemblage C1—the Siphonodosaria species and N. longiscata. These species belong to two families (Stilostomellidae and Nodosariidae, respectively), which, in the mid Pleistocene experienced one of the greatest extinction events in recorded benthic foraminiferal turnovers (Hayward et al. Reference Hayward, Kawagata, Sabaa, Grenfell, Van Kerckhoven, Johnson and Thomas2012). Previous studies have also shown a high positive correlation between their abundances and low oxygen/high food supply prior to their decline (Hayward et al. Reference Hayward, Kawagata, Sabaa, Grenfell, Van Kerckhoven, Johnson and Thomas2012 and references therein). Their extinction was shown to coincide with a decline in the diversity of dinoflagellates and calcareous nannoplankton, and a large increase in diversity of diatoms (Hayward et al. Reference Hayward, Kawagata, Sabaa, Grenfell, Van Kerckhoven, Johnson and Thomas2012). Consequently, the dominance of diatoms in the Campanian and the shift to calcareous nannoplankton at the Campanian/Maastrichtian boundary might have been the precursor for cylindrical proliferation during the Maastrichtian in the Levant.
Conclusion
1. Multi proxy analysis of the Upper Cretaceous high productivity sequence from proximal and distal basins in Israel provides clear evidence that different benthic foraminifera species could survive and sustain large populations under long term anoxic to dysoxic bottom water conditions.
2. Massive blooms of triserial (buliminids) benthic foraminifera with distinct apertural and test morphologies during the Campanian imply that their ability to survive anoxic conditions was perhaps achieved by their capability to sequester diatom chloroplasts and associate with bacteria, in a similar manner as their modern analogs.
3. Diverse trochospiral forms existed during the Maastrichtian possibly by using nitrate instead of oxygen for their respiratory pathways, or by symbiosis with denitrifying bacteria, in a denitrifying environment.
4. Species belonging to the Stilostomellidae and Nodosariidae families might have been affected by the change in food type arriving to the seafloor after the Campanian/Maastrichtian boundary, in a similar manner as their mid Pleistocene descendants prior to their decline.
5. This study promotes the need for a re-evaluation of the current models used for interpreting benthic foraminiferal assemblages. It demonstrates that identification of adaptations and mechanisms involved in promoting sustained life under dysoxic and even anoxic conditions should become a standard in faunal paleoceanographic studies.
Acknowledgments
We wish to express our gratitude to Israel Energy Initiatives Ltd. for the use of the Aderet core material and laboratory equipment. We thank N. Vandenberghe and R. Adriaens from KU Leuven for their contribution in the XRD analysis and the anonymous reviewers for their valuable comments and suggestions. The research was supported by The German-Israeli Foundation for Scientific Research and Development (GIF) grant no. 956-38.8/2007 and by the Israeli Ministry of Infrastructure grant no. 277-17-018.