Introduction
Indigenous chicken (IC) genetic resources are a heterogeneous population which exhibit vast phenotypic variability (FAO, 2012) without standard phenotypic characteristics. They vary in body sizes, comb types, colours (plumage, eye, skin, shank and earlobe colours), outline and feather contours (Teketel, Reference Teketel1986; Ndirangu et al., Reference Ndirangu, Kimani, Nyachoti, Mbugua and Janssen1991; Dana et al., Reference Dana, Dessie, van der Waaij and van Arendonk2010; Kingori, Wachira, A.M. & Tuitoek, Reference Kingori, Wachira and Tuitoek2010; Cabarles et al., Reference Cabarles, Lambio, Vega, Capitan and Mendioro2012). Distinct phenotypic variations among IC in different regions (ecotypes) have been documented in some countries. In Uganda, Ssewanyana et al. (Reference Ssewanyana, Ssali, Kasadha, Dhikusooka, Kasoma, Kalema, Kwatotyo and Aziku2003b) reported a wide phenotypic variability in plumage, shank, eye, earlobe, comb, skin, feathers, feather distribution, body size, comb type, wattle and earlobe sizes among IC population found in the Soroti, Mbale, Jinja, Masaka, Sembabule and Mbarara districts. Similarly, large variations in plumage colours, comb types, skin colours, shank colours, eye colours, earlobe colours and body positions among Ethiopian IC ecotypes (Tilili, Horro, Jarso, Tepi, Gelila, Debre-Elias, Melo-Hamusit, Gassay/Farta, Guangua and Mecha ecotypes) have been reported (Tadelle et al., Reference Tadelle, Million, Alemu and Peters2003a; Halima, Reference Halima2007; Bogale, Reference Bogale2008; Dana et al., Reference Dana, Dessie, van der Waaij and van Arendonk2010; Abera and Tegene, Reference Abera and Tegene2011). In Kenya, morphological variations of IC population have been reported by Ndirangu et al. (Reference Ndirangu, Kimani, Nyachoti, Mbugua and Janssen1991), Maina (Reference Maina2000), Njenga (Reference Njenga2005) and Nyaga (Reference Nyaga2007). However, IC morphological characterization studies in Kenya were not based on the ecosystems and information of IC distributed in the specific regions of the country is presently limited. Each agro-ecological zone is anticipated to host chicken exhibiting different morphological characteristics. Therefore, there is a need to distinctively characterize morphologically IC populations in each agro-ecological zone.
The objective of this study was to characterize IC ecotypes morphologically. Information generated is crucial inputs to IC genetic improvement activities, future development of chicken breeds utilizing IC genetic resources and provide foundation for decision-making on conservation interventions needed.
Materials and methods
Study sites
The study was carried out in five administrative counties in Kenya; Bomet, Narok, Kakamega, Siaya and West Pokot counties. Counties were selected based on their geographical distances, ecological characteristics, coverage of the past chicken improvement programmes (distribution of exotic birds) and the socio-economic roles of IC (Okeno, Reference Okeno2012). In these counties, most rural households keep IC in rural households (MOLD, 2010; Okeno, Reference Okeno2012) and have wide variation in temperatures, annual rainfall and altitude.
Study population
Kakamega (KK), Siaya (BN), West Pokot (WP), Narok (NR) and Bomet (BM) ecotypes were studied. Indigenous chicken ecotypes were named according to the county of origin.
Sampling and data collection
Three divisions and three locations within each division in each county were randomly sampled. The households in the villages with highest number of IC in each location were recorded. Simple random sampling procedure was used to select households for interviews by randomly picking names of the households from the list. A pretested structured questionnaire was used to gather information. The main features in the questionnaire related to chicken morphological characteristics and flock size per morphological characteristics. Data were collected from free ranging IC through direct observations. Data on morphological features (qualitative data) collected included feather morphology, feather distribution (body and head), body plumage colours, skin colours, earlobe colours, comb types, eye colours, shank colours. Zoometric measurements collected were body weight (BW) and shank length (SL). Measurements were taken in centimetres using a tape measure for SL and a digital weighing scale for BW. Only mature chicken (older than 8 months of age) were considered for morphological characterization.
Data were collected based on Cuesta (Reference Cuesta2008), Francesch et al. (Reference Francesch, Villalba and Cartañà2011), Cabarles et al. (Reference Cabarles, Lambio, Vega, Capitan and Mendioro2012) and FAO (2012). A total of 98, 122, 99, 96 and 87 IC farmers were interviewed in BN, KK, BM, NR and WP counties, respectively. Qualitative traits data were collected from a total of 1 580 IC from BN (285), KK (415), BM (287), NR (282) and WP (311). Zoometric measurements data were collected from 151 IC from BN (31), KK (32), BM (29), NR (28) and WP (31).
Statistical analysis
Descriptive statistics were generated using frequency procedures and cross-tabulation using SPSS (SPSS, 2011). A non-parametric Kruskal–Wallis test was used to evaluate whether the ecotype have effects on the qualitative morphological variables (Dana et al., Reference Dana, Dessie, van der Waaij and van Arendonk2010; Cabarles et al., Reference Cabarles, Lambio, Vega, Capitan and Mendioro2012). Variables with overall significant test based on Kruskal–Wallis test were followed-up with a Mann–Whitney U test to examine unique pairs. A Binomial test was used to analyse the significance of the differences in feather morphology (normal or frizzle), head feather distribution (crested or normal) and skin colour (white or yellow). The PROC GLM of SAS (SAS, 2008) was used for analysis of variance for BW and SL. A model that accounted for the fixed-effects of ecotype, sex and interaction between ecotype and sex was fitted. The age of the bird was not included in the model because only adults, 8 months or older were sampled. Least-squares means were separated using least significant difference (LSD) option. The linear model fitted was:
 $$Y_{ijk} = \mu + a_i + b_j + \lpar ab\rpar _{ij} + \varepsilon _{ijk}\comma \;$$
where Y ijk is the response expected in the dependent variable, μ is the mean of the population, a i is the effect of ecotype (i = KK, BN, BM, NR and WP), b j is the effect of sex (j = male or female), (ab) ij is the effect of interaction between ecotype and sex and ε ijk is the random error.
Results and discussion
Body plumage colours
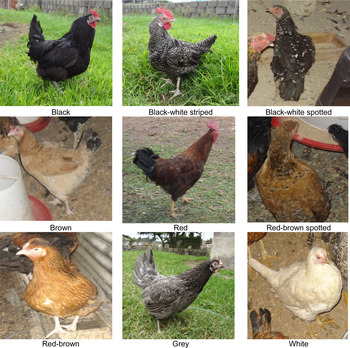
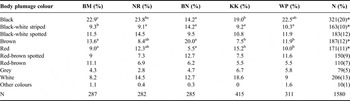
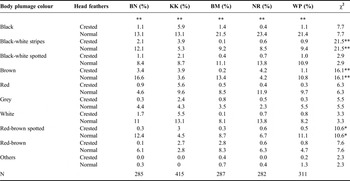
Body plumage colours are presented in Table 1 and Figure 1. Among the body plumage colours, percentages of black, black-white striped, brown and red were significantly different (P < 0.05) between the ecotypes. BM, NR and WP ecotypes was dominated by black body plumaged chicken. BN ecotype had predominantly brown body plumage, whereas KK were dominated by black and white. Body plumage colouration play a role in survival success of IC raised under scavenging system characterized by frequent attack from predators. Indigenous chicken susceptibility levels to predators depend on the camouflaging ability to their numerous local habitats. Differences in camouflaging ability and reaction response to predator attack might have led to diverse frequencies in body plumage colouration. Farmers have colour preferences which influence body plumage colour frequencies among the ecotypes. In Ethiopia, plumage colours frequencies have been affected by farmer's preferences (Dana et al., Reference Dana, Dessie, van der Waaij and van Arendonk2010). Conversely, IC challenges under scavenging environment such as interaction with feather degradation bacteria, which degrade feather pigments might have contributed to the observed varied frequencies of the body plumage colours. According to Goldstein et al. (Reference Goldstein, Flory, Browne, Majid, Ichida and Burtt2004), adaption to microbial infections especially from bacteria which degrades feather pigments results in different feather colours. Additionally, different plumage colours may be due to the adaptive significance in the thermoregulation (Hill and McGraw, Reference Hill and McGraw2006; Protas and Patel, Reference Protas and Patel2008) under tropical conditions.
Body plumage colours of indigenous chicken ecotypes.

Body plumage of five ecotype populations (percentage of chickens within the population).

BM, Bomet ecotype; KK, Kakamega ecotype; BN, Siaya ecotype; NR, Narok ecotype.
N, figures within each column of body plumage; %, percent of total N within a population; N (%), figures and their percentage of each body plumage.
Note: Asterisks in last column indicate significant differences between ecotypes (columns) at the 5 percent (*) probability levels, based on the Kruskal–Wallis test.
abcMeans in a row with one or more letter superscripts in common are not significantly different (P ≥ 0.05) based on the Mann–Whitney U test.
Distribution of body and head feathers
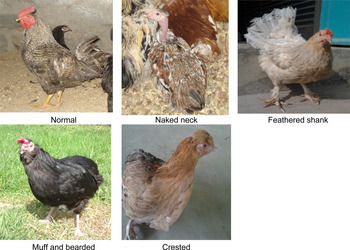
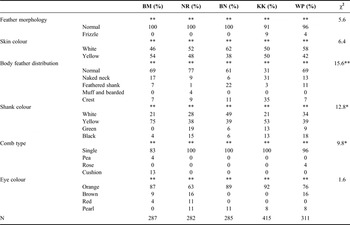
Body feather distributions in the different body plumaged chickens within each ecotype are presented in Table 2 and Figure 2. Body feathers were distributed normally across the ecotypes (61–69 percent) except in KK population. KK population was composed of normal (31 percent), naked-neck (31 percent) and crested (35 percent) chicken.
Body feather distribution of indigenous chicken ecotypes.

Morphology and distribution of feathers, comb types and colours (skin, shank and eye) of five IC ecotypes.

BM, Bomet ecotype; KK, Kakamega ecotype; BN, Siaya ecotype; NR, Narok ecotype.
N, figures within each column; %, percent of total N within a population. Note: Asterisks indicate significant differences between rows at the 5 percent (*) and 1 percent (**) probability levels, based on the Binomial test for feather morphology and skin colour and the Cochran test for distribution of body feathers, comb types, shank and ear lobe colours.
χ2, the χ2 values in last column with “*” (5 percent) or “**” (1 percent) denote significant differences between columns (ecotypes) based on the Kruskal–Wallis test.
Distribution (%) of head feathers (crested or normal) for the different body plumage colours within the populations are presented in Table 3. Distribution of head feathers were significantly different (P < 0.05) between the different body plumage colours within each population. Normal head-feathered-type chickens were dominant over crested in all the body plumage colours in BN, BM and WP populations.
Distribution of head feathers (crested or normal) within ecotype populations (percentage of chickens within each population).

BM, Bomet ecotype; KK, Kakamega ecotype; BN, Siaya ecotype; NR, Narok ecotype.
N, figures within each column; %, percent of total N within a population.
Note: Asterisks indicate significant differences between rows at the 5 percent (*) and 1 percent (**) probability levels, based on the Binomial test for head feathers (crested or normal); χ2, the χ2 values in last column with “*” (5 percent) and 1 percent (**) denote significant differences between columns (ecotypes) based on the Kruskal–Wallis test.
Feather distribution is of vital importance in IC because of their physiological roles especially on thermoregulation. Different ecotypes might have evolved in feather arrangement to allow them to adapt and radiate in their respective habitats. In hot environments such as KK where IC are reared under the scavenging system, naked-neck chicken may have been suitable because it allows better heat dissipation than other genotypes. Low percentages of the naked (Na) neck genotype in other counties except KK may be due to farmers' selection preferences and cultural issues.
Feather morphology
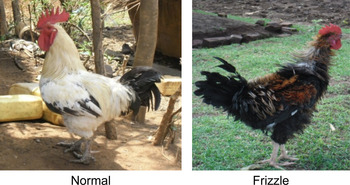
Feather morphologies (normal or frizzle feathers) are presented in Table 2 and Figure 3. Two types of feather morphology were observed with normal feathered chickens being the majority. Statistical analysis revealed that feather morphology between the ecotypes was not significantly different (P > 0.05). Frizzle feathered chickens with the genes known to affect the structure of the feathers and enable heat dissipation constituted less than 10 percent. Frizzled chickens are crucial for cultural and traditional activities through their roles in rituals and sacrifices (Ojo, Reference Ojo2002) and may have contributed higher demand hence low frequency observed in the study. For instance in KK county, frizzled IC are used for cultural purposes such as protection from witchcraft and payment of dowry. Conversely, frizzle feathering gene (F) is lethal when homozygous (Fayeye and Oketoyin, Reference Fayeye and Oketoyin2006) which may explain the low frequency in adult frizzle chicken in this study. Since homozygous F gene is lethal, farmers who may be aware of the condition may have done crossbreeding with other genotypes to conserve the allele.
Feather morphology of indigenous chicken ecotypes.

Variations in shank and skin colours
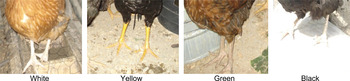
Shank colours (white, yellow, green and black) with their respective percentages within each ecotype are presented in Table 2 and Figure 4. Results showed that majority of BM, NR, KK and WP population had yellow shank. White shanks contributed almost half (49 percent) of the BN population followed by yellow (39 percent). Skin colours (white or yellow) for the different ecotypes are presented in Table 2. Occurrences of white and yellow skin were significantly different (P < 0.001) within an ecotype but similar (P > 0.05) between the ecotypes. White skin was common in NR (52 percent), BN (62 percent) and WP (58 percent) population compared with yellow. KK population recorded equal (50 percent) in both white and yellow skin colours.
Shank colours of indigenous chicken ecotypes.

Skin and shank colours are used as indicators of chicken health (nutritional and immune status), foraging efficiency and sexual attractiveness (Blount et al., Reference Blount, Metcalfe, Birkhead and Surai2003; Blas et al., Reference Blas, Perez-Rodriguez, Bortolotti, Vinuela and Marchant2006; Eriksson et al., Reference Eriksson, Greger, Ulrika, Bertrand, Tixier-Boichard, Strömstedt, Wright, Jungerius, Vereijken, Randi, Jensen and Andersson2008). Different skin colours observed in this study were in the range reported for Ethiopian IC where 52 and 48 percent had yellow and white skin, respectively (Dana et al., Reference Dana, Dessie, van der Waaij and van Arendonk2010). Colour diversity originates from the diet depending on the presence or absence of Oxycarotenoids (Seemann, Reference Seemann2000). Significant differences in shank and skin colours within the populations could be as a result of diet found in their local habitat, variation of genes from the ancestral lineages and the effect of consumer preference. Genetically, shank colour is controlled by three genes; dermal melanin (id+), inhibition of dermal melanin (Id), black extension factor (E) and autosomal white (W+) genes located in the Z sex chromosome (Smyth, Reference Smyth1990). White skin alleles are presumed to originate from red jungle fowl (Gallus gallus), whereas yellow skin is from hybridization of grey jungle fowl (Gallus sonneratii), Ceylon jungle fowl (Gallus lafayettii) and red jungle fowl (Eriksson et al., Reference Eriksson, Greger, Ulrika, Bertrand, Tixier-Boichard, Strömstedt, Wright, Jungerius, Vereijken, Randi, Jensen and Andersson2008; Cabarles et al., Reference Cabarles, Lambio, Vega, Capitan and Mendioro2012) and might be the reasons for the different colours in IC population studied.
Comb types
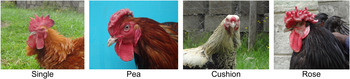
Comb types (single, pea, rose and cushion) within and between the ecotypes with their respective percentages are presented in Table 2 and Figure 5. Comb types varied significantly (P < 0.001) within and between the ecotypes and could be associated with the variation in prevailing climatic conditions in their rearing environments and the effect of comb genes (Somes, Reference Somes and Crawford1990b; Duguma, Reference Duguma2006). All the ecotypes were dominated by single comb (above 83 percent) and in agreement with the reports by Egahi et al. (Reference Egahi, Dim, Momoh and Gwasa2010) and Apuno, Mbap and Ibrahim (Reference Apuno, Mbap and Ibrahim2011) on Nigerian IC and contrary to those reported in Ethiopia by Dana et al. (Reference Dana, Dessie, van der Waaij and van Arendonk2010). Comb is important in scavenging IC as it acts a cooling mechanism under hot tropical conditions because chickens cannot sweat. Single comb in IC helps in losing body heat up to 40 percent under prevailing environmental temperature of 80°F and below (Nesheim Austic and Card Reference Nesheim, Austic and Card1979).
Comb types of indigenous chicken ecotypes.

Eye colours
Eye colours (orange, brown, red and pearl) for the different ecotypes are presented in Table 2. The widely distributed eye colour among the population was orange (>62 percent), whereas brown, red and pearl were below 17 percent. Eye colours within an ecotype varied significantly (P < 0.001) but not between ecotypes (P > 0.05). Within ecotypes diversities in eye colour could be attributed to genes of an individual, which affects blood supply and melanin levels, environmental effect in terms of availability of carotenoids and interaction of blood supply, melanin and carotenoids (Smyth, Reference Smyth1990; Stoddard and Prum, Reference Stoddard and Prum2011; McCartney et al., Reference McCartney, Ligon, Butler, DeNardo and McGraw2014). Variation in colour is as a result of pigmentation of a number of structures within the eye (iris, retina, uveal tract and ciliary) due to sex-linked dermal melanin genes (id+ and idM) and its correlation with other genes expressing colours to other parts (Smyth, Reference Smyth1990; Cabarles et al., Reference Cabarles, Lambio, Vega, Capitan and Mendioro2012) of the chicken body.
Earlobe colours
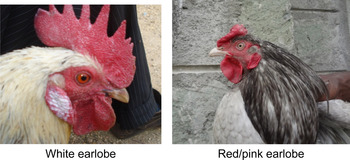
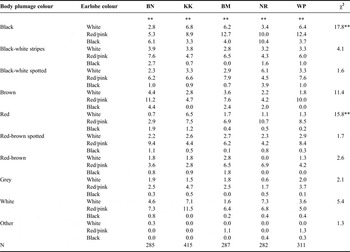
Table 4 and Figure 6 present the earlobe colours (white, red/pink and black). Generally, earlobe colours were significantly different (P < 0.05) within the populations. Red/pink earlobe was common in the populations. White earlobes were common in black-white spotted and white chicken. Earlobe pigmentation has a role in thermoregulation by absorbing or radiating solar radiation from chicken body (Stettenheim, Reference Stettenheim2000; Egahi et al., Reference Egahi, Dim, Momoh and Gwasa2010). Differences in earlobe colours observed in this studied may be due to adaptability of IC ecotypes to their local habitats and differences in ancestral lineages. Ancestral lineages of white ear lobe are bankiva, murghi and gallus, and of red ear lobe are jabouillei and spadecius and their hybridization (Nishida et al., Reference Nishida, Rerkamnuaychoke, Tung, Saignaleus, Okamoto, Kawamoto, Kimura, Kawabe, Tsunekawa, Otaka and Hayashi2000; Ohta et al., Reference Ohta, Kajita, Kusuhara and Kakiwaza2000).
Earlobe colours of indigenous chicken ecotypes.

Earlobe colours within different body plumage colours for each IC ecotype.

BM, Bomet ecotype; KK, Kakamega ecotype; BN, Siaya ecotype; NR, Narok ecotype.
N, figures within each column; %, percent of total N within a population. Note: Asterisks indicate significant differences between rows at the 5 percent (*) and 1 percent (**) probability levels, based on the Cochran test.
χ2, the χ2 values in last column with “*” (5 percent) or “**” (1 percent) denote significant differences between columns (ecotypes) based on the Kruskal–Wallis test.
SL and BW
Variations in SL and BW for the different ecotypes are shown in Table 5. SL between ecotypes were significantly different (P < 0.05). Ecotypes with SL not significantly different (P > 0.05) were BM, KK, NR and WP as well as BN, KK and WP in another group. The longest shank was recorded in NR ecotype followed by BM, WP, KK and BN. SL can be used as a predictive live BW in IC particularly where weighing scales are not readily available, as is the case in most smallholder African rural farmers and meat markets (Mani, Abdullah and Von Kaufmann, Reference Mani, Abdullah and Von Kaufmann1991; Nesamvumi et al., Reference Nesamvumi, Malaudzi, Ramanyimi and Taylor2000; Kabir et al., Reference Kabir, Oni, Akpa and Adeyinka2006). SLs in chicken in this study were generally longer than Ethiopian (Dana et al., Reference Dana, Dessie, van der Waaij and van Arendonk2010) and Nigerian IC (Apuno, Mbap and Ibrahim, Reference Apuno, Mbap and Ibrahim2011) but in the range with some Tanzanian ecotypes (Msoffe et al., Reference Msoffe, Minga, Olsen, Yongolo, Juul-Madsen, Gwakisa and Mtambo2001). NR ecotypes with longer shanks are found in a relatively dry region with flat terrain and chicken may need to cover long distance in search of food.
Least-squares means ± standard error of zoometric measurements of mature chicken under on-farm condition. Measurements were taken after 1 day of starving.

BM, Bomet ecotype; KK, Kakamega ecotype; BN, Siaya ecotype; NR, Narok ecotype; N, number of chicken per ecotype; BW, Body weight; SL, shank length.
abcMeans in a row with one or more letter superscripts in common are not significantly different (P ≥ 0.05) based on LSD.
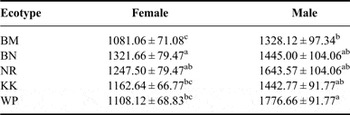
BW were significantly different between the ecotypes (P < 0.05). On average, adults weighed 1 367, 1 259, 1 167, 1 393 and 1 348 g for BN, KK, BM, NR and WP, respectively (Table 5). BW for NR was not significantly different (P > 0.05) from BN, KK and WP. Significant difference (P < 0.05) between sexes with cocks being heavier than hens was recorded (Table 6). WP (heaviest) and BM (lightest) males were significantly different (P < 0.05). Females from BM and BN were the lightest and heaviest, respectively. Narok, KK and WP females were not significantly different (P > 0.05), whereas BM hens were similar to KK and WP hens. The significant differences in average BW could be attributed to genetic make-up, feed availability and age of the birds (the precise age of birds were unknown due to lack records under on-farm).
Least-squares means ± standard error of BW of mature female and male chicken under on-farm condition. Measurements were taken after 1 day of starving.

BM, Bomet ecotype; KK, Kakamega ecotype; BN, Siaya ecotype; NR, Narok ecotype.
abcMeans in a column with one or more letter superscripts in common are not significantly different (P ≥ 0.05) based on LSD.
Conclusion
Indigenous chicken ecotypes studied are heterogeneous population with large variability in morphological features. Black body plumage, normal feathers, single comb, white skin, orange eye colour and red/pink earlobes were the predominant morphological features.
Acknowledgments
The authors are grateful to the Wageningen University, The Netherlands, Koepon foundation and Indigenous Chicken Improvement Programme (InCIP) for funding. We sincerely thank the farmers who participated in the project.
Conflict of interest
None.