Department stores constituted both the most important class of large-scale American retailers until the late 1920s and the most advertising-intensive sector of interwar retailing.Footnote 1 In 1935 the 4,201 U.S. department stores accounted for some 10 percent of national retail sales.Footnote 2 Yet their contribution to retail advertising was much larger, owing to a substantially higher ratio of promotional expenditure to annual net sales than was the case for most chain stores.Footnote 3 Department stores devoted an average of 4 percent of sales revenue to advertising during 1932, compared with median figures for the same year of0.42 percent for variety stores, 1.37 percent for drug store chains, 1.02 percent for grocery chains, and a mean of 2.98 percent for shoe chains. Footnote 4 This was partly due to their substantial sales of durable goods such as furniture and appliances, which are advertised heavily due to the infrequent and discretionary nature of purchases. Yet advertising ratios were higher even for comparable merchandise—a 1925 analysis of 45 department stores with annual sales of $1 to $2 million found publicity expenditures equivalent to 3.5 percent of sales for toilet articles and drugs, 4.0 percent for women's and children's shoes, and 4.2 percent for men's shoes.Footnote 5 High advertising ratios reflected the department store business model, which was based on drawing in customers from extensive catchment areas to large, centrally located, stores, rather than serving them via branch networks. Department stores had been at the forefront of new innovations in advertising since the late nineteenth century and during the interwar period, they adopted increasingly sophisticated methods of both designing advertisements and monitoring their effectiveness.
Yet by the 1930s both industry insiders and well-informed business academics were pointing to excessive expenditure on advertising and customer services as key factors that undermined department store performance because they raised gross margins and thus eroded their competitive position vis-à-vis expanding chain stores operating on a lower-cost model. This article examines both the objectives and nature of department store advertising and its cost-effectiveness. Qualitative archival evidence, mainly concerning Macys of New York, the Higbee Co. of Cleveland, Ohio, and Filenes of Boston, is used to chart the development of department store advertising policy, media, and techniques. Contemporaries argued that advertising levels were excessive and produced illusory gains because they led to retaliatory advertising by rival department stores. Using establishment-level data from the Harvard Bureau of Business Research (HBBR) archives, we show that the relationship between advertising expenditure and net sales deteriorated over the interwar period, though this appears to have been largely due to a decline in the elasticity of own-store sales to own-store advertising, with rivalry effects playing a relatively minor role. Meanwhile, smaller stores obtained lower advertising returns than their larger counterparts.
THE GOLDEN AGE OF DEPARTMENT STORE ADVERTISING
Department stores originated as a larger, departmentalized, version of the dry goods store. They first became a significant force in American retailing during the third quarter of the nineteenth century. Their business model was based on a single large, central, store, acting as a “universal emporium” for the nonfood purchases of their customers. The first department stores had used decentralized management systems, with much authority vested in departmentally based “buyers.” Between 1890 and 1920, however, there was a “managerial revolution” in department store operations that led to the rapid diffusion of more efficient store lay-outs, new information-processing machinery, a range of managerial and accounting systems, and the introduction of new tiers of managers with functional responsibilities covering the whole store. Footnote 6 Some estimates suggest that the department store's share of total retail sales increased more than threefold between 1899 and 1929.Footnote 7
The rise of the first great American department stores such as Marshall Field's in the second half of the nineteenth century was closely associated with their development of strong, consistent, and meaningful brand images to distinguish themselves from competitors, command customer loyalty, and identify the store's principal consumer market segment. Advertising facilitated the projection and adaption of brand images to target markets.Footnote 8 Department store advertising innovations transformed U.S. newspaper advertising, including the pioneering of the full-page advert by John Wanamaker in 1879, the introduction of drawings and illustrations in ads, innovations in typography and layout, and the development of “institutional advertising” aimed at advertising the store as a brand rather than focusing on brands for individual products sold there.Footnote 9
Competition initially came from other department stores, although the extent of competition was limited because each store occupied its own market niche, reinforced by aggressive branding and advertising. For example, the Higbee Co. of Cleveland, Ohio faced potential competition from five main stores during the 1930s, although most of its competition came from three stores. The May Co. aimed at a wider market than Higbee and competed on price, while two upmarket stores, Linder and Halle, competed on quality of merchandise, particularly with regard to fashion items. Even this level of competition was partly due to Higbee's attempt to serve a relatively broad market segment. As a 1932 comparison shoppers' report noted, by doing so it both failed to offer the variety of merchandise and appropriate goods for the “popular” market served by the May Co. and overlooked the fashion-based competitive threat from Linder and Halle.Footnote 10
Distinct branding was particularly important, given that department stores sold a high proportion of fashion-related, durable, and “luxury” goods, characterized by segmented markets. As another Higbee policy document noted, customers could choose from “high grade”; “medium grade”; or “low grade” stores. While high grade and medium grade stores shared many customers, as did medium grade and low grade stores, few customers' purchasing habits spanned the high and low grades.Footnote 11 Strong market segmentation also increased the importance of repeat business and customer loyalty. Thus department stores were early advocates of “relationship marketing.” Wanamaker had pioneered relationship marketing in the late nineteenth century, based on the philosophy of “reciprocity” and “mutuality of interest” between the store and its customers. This encompassed a leisure-based retail format, underpinned by generous provision of service facilities and return privileges, and an advertising philosophy based around marketing the store as an institution.Footnote 12
The following decades witnessed widespread diffusion of the institutional approach to department store advertising.Footnote 13 Like Filene's of Boston, department stores sought “to sell to the public our store as a whole rather than individual departments and individual merchandise…” Footnote 14 Strength in fashion goods was described as Filene's “greatest single ‘institutionalizing' factor,” while their range of services provided an important subsidiary attraction. Filene's advertising policy emphasized a fashion orientation that would never be subordinated to price or other appeals.Footnote 15 When selecting merchandise to feature in newspaper advertising and window displays, Filene's accorded the highest priority to style and the lowest to profit margins on the specific items displayed.
America's largest department store, Macy's of New York, was similarly keen to project a strong institutional image in its advertising. As one of its executives informed management trainees in 1929, “Macy's is anxious to be known as an institution, and must therefore offer services and policies which are distinctive.”Footnote 16 These included the firm's cash-only policy, its underselling strategy, and its extremely wide merchandise range. Advertising reflected these strengths, using tag lines such as: “It's smart to be thrifty,” and “No one is in debt to Macy's.”Footnote 17 Similar policies were evident at Higbee. F. M. Cochran of Higbee's advertising department explained at an executive training lecture that they used advertising to:
…Sell the store as well as the merchandise… at one and the same time… It's done with short, subtle, confident statements such as:
“This blanket comes up to the Higbee standard of quality.”
“Another Higbee fashion scoop.”
“We're first again—with the newest bag of the season.”
“This is another Higbee service for your convenience—there is no charge.”Footnote 18
Newspaper advertising accounted for about 86 percent of all department store advertising expenditure over 1932–1939.Footnote 19 In addition to its direct advantages, heavy newspaper spending might also purchase the services of the local paper as a “booster” for the store—for example, by promoting its merchandise in fashion feature columns.Footnote 20 Stores also used direct mailings and posters and eventually began advertising on radio. Higbee broadcast a 15 minute radio program six days a week during the 1930s with advertising that emphasized selling “the store itself, its friendliness, its interest in civic affairs, and its position as a center of community activities.”Footnote 21
Macy's and Detroit's J. L. Hudson store launched Thanksgiving Day Parades in 1924 to promote sales during the Christmas shopping season. In 1927 Macy's first incorporated the giant helium-inflated rubber figures designed by Tony Sarg.Footnote 22 Meanwhile, the Detroit parades incorporated giant papier-mâché heads carried by the marchers and Santa's arrival by sleigh at Hudson's “Toyland.”Footnote 23
Department stores took on board the new scientific and psychological approaches to advertising that had become popular by the 1920s.Footnote 24 Cochran argued that successful advertising executives “must be psychologists, interested in people of all types and social levels. They must be curious about what makes people ‘tick.'” Reflecting the consensus that department stores' principle customers were women, he added that they must be able to put themselves in the customer's place; “feel her wants, her doubts…encourage her to have courage to dress better or create a lovelier home for herself.”Footnote 25 Meanwhile, Macy's extolled the scientific basis of their advertising. Their head of publicity once told the Dry Goods Economist:
…we interview customers in the department and in their homes; we clock traffic inside and outside the store, and we key the responses to different types of advertisement in different media—newspaper, magazine, direct mail, car cards, billboards, and even window display…. By clocking the number of people who pass by and the percentage of them that stop to look (it averages about one in twenty)… .Footnote 26
Such monitoring of customer flow was widespread; one Buffalo department store even installed microphones by its front windows, to record spectators' conversations. Footnote 27
Stores also sought to apply scientific principles to the allocation of their advertising budgets. For example, Frederick Loeser & Co. of Brooklyn, New York divided advertising spending between departments based on their contribution to store sales and profits and their advertising to sales ratios, in comparison to available data on these indicators for the same departments in other stores.Footnote 28 Similarly, by 1930 J. L. Hudson used the advertising elasticity of their different departments, estimated from previous movements in advertising spending and sales volumes, to plan current allocations.Footnote 29
THE NEW COMPETITION
The interwar years witnessed major changes in U.S. retailing, by far the most important of which was the rapid expansion of the chain stores. The Federal Trade Commission estimated that the number of chain stores rose by some 172 percent between 1919 and 1928. Footnote 30 Estimates suggest that in 1919 they accounted for around 4 percent of retail sales, and this proportion rose to around 9 percent in 1926 and 15 percent in 1928. The Census of Distribution found that chains of four or more units accounted for 20 percent of retail sales in 1929 and 25.4 percent in 1933.Footnote 31
The product mix of chains increasingly overlapped the mix at department stores. During the 1920s many variety stores raised their price limits from the five and dime level to as much as $1 or even $5, while a few dispensed with any price limit. Footnote 32 The 1920s also witnessed the expansion of specialty chains in menswear, women's apparel, millinery, footwear, hosiery, and other lines which collectively comprised a considerable proportion of department store trade.Footnote 33 Sears Roebuck and Montgomery Ward opened extensive chains of stores, while drug chains also widened their range of merchandise into lines directly competing with department stores.Footnote 34
Chain store competition affected the independent “Mom and Pop” stores most heavily, leading to a political clamor for protection for small retailers. Various states and municipalities introduced taxes on chain store organizations, together with federal and state level restrictions on their selling and pricing policies. Footnote 35 The extent to which the chains took business from the department stores is more difficult to gauge, as both were gaining market share from the independents. However, chains appear to have been particularly successful in making inroads into department stores' staple and semi-staple lines, leaving them increasingly reliant on fashion-orientated merchandise and other goods where style or quality assumed greater importance than price. Footnote 36 Chains offered fewer services and undertook much less advertising, enabling them to undercut department store prices.Footnote 37 For example, in 1935 operating costs averaged 35.9 percent of sales for department stores, compared to average values for chains with annual net sales per store of over $100,000 of 31.74 percent for variety stores, 32 percent for men's clothing or furnishings; 30.8 percent for family clothing; and 31.3 percent for women's ready-to-wear clothing.Footnote 38 Furthermore, by stressing their lower prices, chain stores were said to have promoted greater consumer price-comparison activity and price-consciousness.Footnote 39
This new competition put downward pressure on department store margins, as the stores had to lower prices and/or raise advertising costs to emphasize low prices, special events, and promotions (or to further assert the quality advantages of their merchandise). Footnote 40 This entailed a partial shift from institutional to product-specific advertising, which was viewed as having a stronger short-term impact on sales.Footnote 41 Widespread use of “loss-leaders” also enabled stores to project an image of low prices while only having to reduce prices on the specific lines advertised. Product-specific advertising was also encouraged by manufacturers that paid part of the cost of ads featuring their products.Footnote 42 In as much as such initiatives stimulated increased advertising, they would have raised both recorded gross margins and advertising spending. The HBBR studies' definition of advertising was net of any allowances received from manufacturers, which were credited to the merchandise account.Footnote 43 However, they do not appear to have significantly distorted these ratios, which remained stable after the passing of the 1936 Robinson-Patman Act discouraged such allowances.Footnote 44 Susan Benson notes that most department stores shied away from nationally advertised brands during this period—as these often yielded lower profits than non-branded goods, were more vulnerable to price comparisons, and weakened stores' claims to provide a distinctive selection of merchandise. Footnote 45
Rising competition contributed to a crisis in department store profitability; in 1926, 33 percent of all department stores (and 42 percent of those with sales under $1 million) made no net profit; by 1928 these percentages had increased to 40 and 51 percent respectively.Footnote 46 Falling profits led to widespread debate regarding whether current expenditure on both advertising and customer services was justified. Services such as free home delivery, credit, packaging, and returns privileges were an integral part of the department store sales formula and necessarily implied that department stores would command higher gross margins to pay for these services. However, by the late 1920s there was a growing consensus among industry analysts that services provision had exceeded customer demand and that the majority of customers who made little use of them were effectively cross-subsidizing a minority who used them excessively. The role of services as an instrument of interstore competition was said to exacerbate this problem.Footnote 47
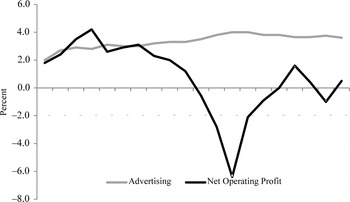
Data on services expenditure supports these claims; for example, returns and allowance rose from 1.8 percent of gross sales in 1922 to 2.4 percent in 1928 for stores with under $1 million sales. For stores with over $1 million in sales, the percentage rose from 5.9 to 8.5 percent.Footnote 48 Department store advertising displayed a similar trend of rising expenditure in Figures 1 and 2. Rising costs were, in turn, seen as a major factor depressing profits. In 1929 Malcolm McNair, who supervised the HBBR surveys, drew on their findings to illustrate that profitable stores had lower expense ratios than stores with annual losses and that the main difference between loss-making and profitable stores lay in their lower expenses rather than their higher price markups.Footnote 49
ADVERTISING AND NET OPERATING PROFITS FOR U.S. DEPARTMENT STORES, AS A PERCENTAGE OF NET SALES, 1920–1939

Frank Hyppes characterized the interwar years as a period in which merchandising and advertising skill dominated competition between department stores. Their high fixed costs made profits very sensitive to sales volumes and, in turn, made initiatives to increase sales via aggressive advertising campaigns highly tempting.Footnote 50 “High pressure” promotional techniques, aimed at boosting short-term sales, had the desired effect in temporarily raising turnover, but high costs and increased competition (including the growing threat from speciality and chain stores) wiped out much of the expected growth in long-term profits.Footnote 51 Hrant Pasdermadjian similarly argued that efforts to expand sales via costly advertising and services, or sales promotion events involving temporarily slashing margins, generally failed to produce a sufficient increase in revenue to justify the costs involved.Footnote 52 Stores had become locked into a “high promotion regime” where heavy advertising by their competitors compelled them to undertake similarly heavy expenditure, despite the fact that most of the gains would be negated by retaliatory action.
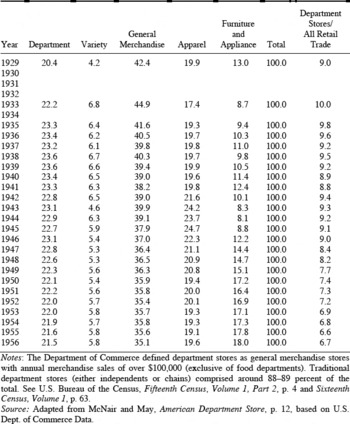
During the Depression, the department stores saw declines in competition from some of the specialty stores. The share of comparable merchandise sold in department stores in Table 1 rose from 20.4 to more than 23 percent in the early 1930s at the expense of apparel and furniture and appliances stores. In terms of their proportion of retail trade, department stores fared relatively well—compared to both stores carrying similar goods and all retailers, as shown in Table 1. Meanwhile prices for the main classes of department store goods fell by 23.7 percent over 1929–1933, slightly better than the 24.3 percent fall in general consumer prices, but exceeding the 22.1 percent decline in wholesale prices (for commodities other than farm and food products) and thus contributing to declining profits.Footnote 53 As Figure 1 shows, department stores experienced a crisis in profitability, registering a positive net operating profit for only three years over 1930–1939. Conversely, data for the major variety, shoe, and drug chains indicate that they maintained high net profit ratios throughout the Depression; for example average net earnings per dollar of net worth only dipped below 10 percent for limited-price variety stores during a single year (1932) over the period 1929–1936. Footnote 54 Department store operating expenses rose from 32.3 percent of sales in 1929 to a peak of 39.5 percent in 1932, while—given the severity of competition, gross margins actually declined marginally, from 33.5 to 33.1 percent. With the onset of recovery in 1933 gross margins were raised substantially, to 36.0 percent, remaining at between 35.6 and 36.9 percent for the rest of the decade.
DEPARTMENT STORES' SHARE OF TRADE FOR COMPARABLE MERCHANDISE AND SHARE OF ALL RETAIL TRADE, 1929–1956

Notes:
The Department of Commerce defined department stores as general merchandise stores with annual merchandise sales of over $100,000 (exclusive of food departments). Traditional department stores (either independents or chains) comprised around 88–89 percent of the total. See U.S. Bureau of the Census, Fifteenth Census, Volume 1, Part 2, p. 4 and Sixteenth Census, Volume 1, p. 63.
Sources:
Adapted from McNair and May, American Department Store, p. 12, based on U.S. Dept. of Commerce Data.
The remarkable resilience of department store sales, despite these losses, can be attributed to high barriers to exit from the sector. Department stores had high sunk costs, both in terms of luxurious premises and fittings and their accumulated investment in customer goodwill. They thus had strong incentives to remain in operation and adopt a strategy of high throughput to offset heavy fixed costs, if necessary accepting margins that were insufficient to cover all costs. Meanwhile, they typically had much stronger financial resources than independent traders and were thus well placed to hold on in the hope of a return to better times.
Advertising campaigns were said to be, “mainly weapons of department stores in the competition within their own ranks,” rather than measures to address low-cost competition from the chains.Footnote 55 Stores were aware of their competitors' advertising spends—it was relatively easy to compare the column inches purchased by rival stores in local newspapers to their own, while broader data were available via the HBBR studies, which enjoyed widespread participation, and wider circulation among department stores.Footnote 56 Meanwhile, by focusing on product-specific and price-oriented advertising to boost short-term sales, stores became increasingly dependent on such advertising to maintain sales. For example, a Filene's manager confided to a British visitor in 1930 that 50 percent of their sales were traced directly to advertising and they felt it should not be so. The visitor (S. Schofield of the Leeds store, Schofield's) noted that many other stores he had visited were also developing their turnover on these lines.Footnote 57
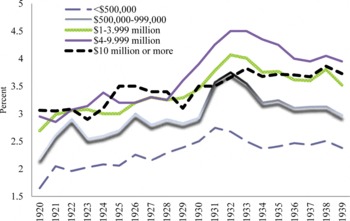
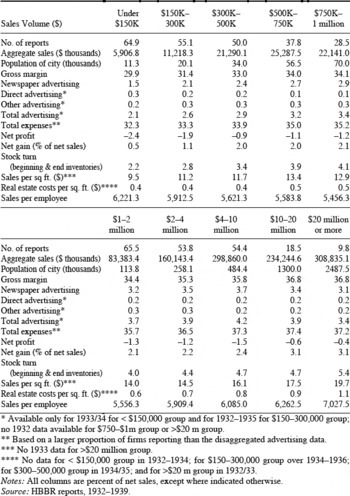
The interrelationships between advertising, sales volumes, and profitability are examined, for stores of different sizes, in Figure 2 and Table 2. Figure 2 shows that for all size classes advertising ratios rose during the 1920s and experienced a steeper rise during the Depression, while remaining above 1929 levels over the recovery years of the mid- and late 1930s. Table 2 shows key performance data for the full HBBR sample over the period 1932–1939 (detailed data were not available for all size groups prior to this date). Advertising ratios rise with store size up to the $4–10 million sales range, declining thereafter. Meanwhile, total operating expenses ratios rise with store size, until stabilizing for stores with sales over $4 million. Yet larger stores were able to generate higher gross margins (aggregate price markups over net purchase costs). This enabled them to earn better (though still negative) net operating profits and higher net gains than their smaller counterparts.Footnote 58
ADVERTISING EXPENDITURE AS A PROPORTION OF NET SALES, BY SIZE OF DEPARTMENT STORE, 1920–1939

DEPARTMENT STORE ADVERTISING AND OPERATING STATISTICS, AVERAGE VALUES FOR 1932–1939

* Available only for 1933/34 for < $150,000 group and for 1932–1935 for $150–300,000 group; no 1932 data available for $750–$1m group or >$20 m group.
** Based on a larger proportion of firms reporting than the disaggregated advertising data.
*** No 1933 data for >$20 million group.
**** No data for < $150,000 group in 1932–1934; for $150–300,000 group over 1934–1936; for $300–500,000 group in 1934/35; and for >$20 m group in 1932/33.
Notes:
All columns are percent of net sales, except where indicated otherwise.
Source:
HBBR reports, 1932–1939.
Larger stores' superior financial performance appears to be strongly linked to their ability to maintain higher stock turn rates. The largest stores turned their stock over 5.4 times per year, roughly double the rate for stores with sales below $300,000. This also enabled them to achieve double their smallest counterparts' sales per square foot, thus compensating for their much higher real estate costs. Maximizing stock turn (and aggregate sales, which was very closely linked) was seen as key to prosperity. For example, a 1930 Macy's document noted that it's undercutting policy (prices being set at least 6 percent below those of competing stores) was not sustained by its cash only policy (the administrative savings from which were not great), or bulk purchasing (much of which was in fact hand-to-mouth), but by high sales and rapid stock turn.Footnote 59 Given the strong relationship between turnover and profitability, advertising aimed at boosting short-term sales via loss-leaders, special promotions, and similar price-orientated appeals proved even more attractive at the trough of the Depression. Indeed, as Figure 1 shows, advertising to sales ratios rose to their peak interwar level, of 4 percent, during 1932 and 1933.Footnote 60
ANALYZING THE RETURNS TO DEPARTMENT STORE ADVERTISING
The following analysis focuses on two main elements—the returns to stores' own advertising spending, and whether advertising rivalry reduced own store sales and thus served as a strategic substitute. There is a substantial empirical literature on estimating the impact of advertising on sales or market share and on advertising rivalry. Footnote 61 Some authors have used the estimated response function to determine optimal spending levels, although results concerning advertising rivalry have been mixed.Footnote 62 For example, John E. Kwoka found that rivalry increased own firm sales using a sample of U.S. automobile firms. In effect, Kwoka's results indicate that advertising has the effect of stimulating aggregate sales and rivals' advertising is therefore a strategic complement.Footnote 63 Not surprisingly, this is exactly what advertisers themselves were arguing.Footnote 64 Indeed, it was often presumed that, by expanding demand, advertising would increase stores' turnover—thereby enabling them to lower prices without reducing profits. It was not only advertising executives who espoused what was effectively the common view.Footnote 65 Yet later empirical work is less positive. Evidence from a number of industries has found that advertising by one firm takes market share from rivals and that advertising is therefore a strategic substitute.Footnote 66
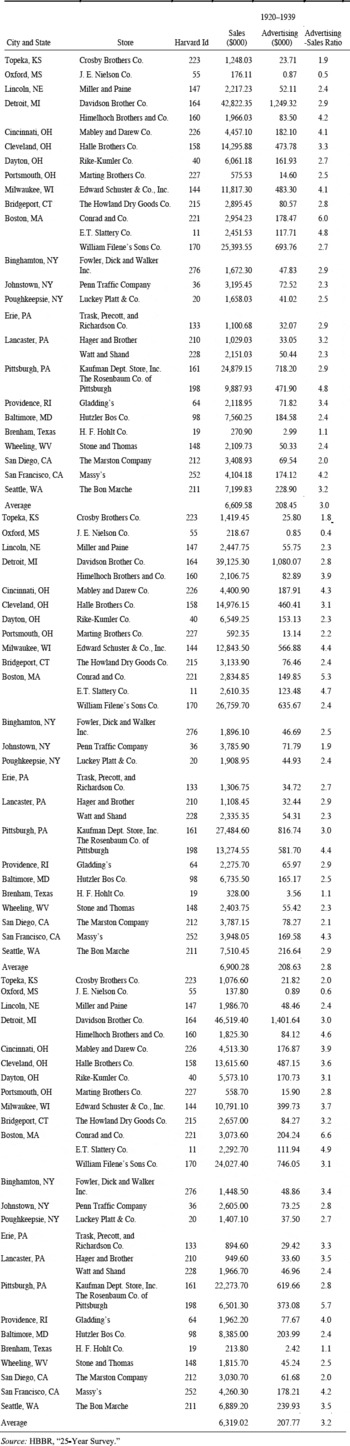
Table 3 shows data for the stores from a “25-Year Study” performed by the HBBR, broken down by city and state, the name of the store, the identifier allocated by the HBBR, and data on sales and advertising. For every store, we have complete information over the full twenty years that constitutes our period of analysis. Annual average sales and advertising data are illustrated for stores over the whole 1920–1939 period, but are also broken into two subperiods. The choice of break reflects the sharp fall in sales associated with the Great Depression and also provides a means to analyze the relationship between advertising and sales over the interwar period and determine the extent to which there was a shift in returns to advertising spends. Footnote 67 Comparing the two subperiods, there were clearly falls in the levels of both sales revenue and advertising spending, suggesting that the periods differed. Equally clear is that advertising relative to sales, summarized by the advertising-sales ratio, increased nearly uniformly across the sample. Only two of the twenty-nine stores recorded moderate falls.
DEPARTMENT STORE SALES AND ADVERTISING, 1920–1939

Sources:
HBBR, “25-Year Survey.”
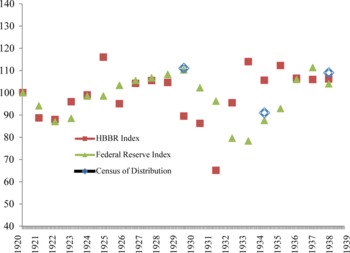
To check the representativeness of the HBBR “25-Year Study,” we compare time trends to the Federal Reserve's department store sales index and distributions. The trends in HBBR annual aggregates mirror the turning points in the Federal Reserve's annual series reasonably well in Figure 3. The contemporaneous correlation between the two series is 0.47 and is statistically significant at the 5 percent level. Figure 3 also summarizes trend data from the U.S. Census of Distribution that closely follows the Federal Reserve data trend.Footnote 68
DEPARTMENT STORE SALES INDICES (1920–1939): COMPARISON OF FEDERAL RESERVE AND HARVARD BUREAU OF BUSINESS RESEARCH DATA

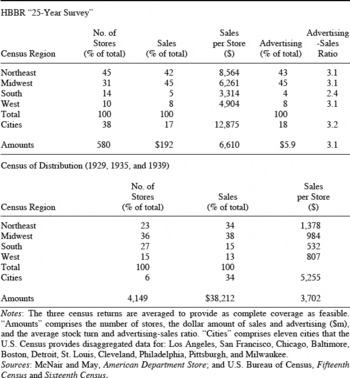
To examine the regional representativeness of the HBBR 25-year data, we compared its regional distributions with regional distributions from the U.S. Censuses of Distribution in Table 4.Footnote 69 Comparisons are also made with a grouping of the eleven largest cities aside from New York City for which the U.S. Census provided disaggregated data. Stores in these eleven cities likely had higher sales and advertising rates than in most cities throughout the country.Footnote 70 Table 4 shows information by region on the average across 1929, 1933, and 1935 for the number of stores, sales, and advertising. Data for specific years is not shown because the distribution across regions was stable for all three years. The HBBR stores in the top half of Table 4 are more likely to be located in the eleven key cities and in the Northeast than the Census of Distribution stores in the bottom half of the table and are therefore also typically larger.
REGIONAL COMPARISONS OF AVERAGE SALES, STOCK TURN, AND ADVERTISING EXPENDITURE FROM THE HBBR “25-YEAR STUDY” AND THE AVERAGE FOR 1929, 1933, AND 1935 FROM THE U.S. CENSUS OF DISTRIBUTION

Notes:
The three census returns are averaged to provide as complete coverage as feasible. “Amounts” comprises the number of stores, the dollar amount of sales and advertising ($m), and the average stock turn and advertising-sales ratio. “Cities” comprises eleven cities that the U.S. Census provides disaggregated data for: Los Angeles, San Francisco, Chicago, Baltimore, Boston, Detroit, St. Louis, Cleveland, Philadelphia, Pittsburgh, and Milwaukee.
Sources:
McNair and May, American Department Store; and U.S. Bureau of Census, Fifteenth Census and Sixteenth Census.
In measuring rivalry advertising, we develop measures at the state level, in part because the sample size for the HBBR “25-Year Study” is small enough that the city-level measures might suffer from measurement error. To some extent the focus on the state-level captures actual rivalry between stores in different cities. Sarah Elvins noted a trend towards greater competition between cities in the 1920s due to the increased emphasis on fashion and transport improvements. In New York State, Rochester's stores were competing “not merely with Buffalo and Syracuse, but also, in a very real way, with New York and Chicago.”Footnote 71 Yet shopping excursions to New York would necessarily have been very infrequent and competition for more regular retail trade remained at a more local level.Footnote 72
The focus on state rivalry rather than city rivalry does not appear to have a significant impact on the analysis. We examine the correlation between rival advertising at the state level and rival advertising at the city level using the 1920–1924 HBBR “Secrist Study,” which had 1,933 observations for 655 stores. Correlations between city measures of advertising rivalry, calculated at the store level, and annual state measures for each of the five years ranged from 0.82 through 0.88.
To understand the relationship between own and rival advertising, we examined both static and dynamic panel models, using instrumental variables to account for endogeneity issues. Since advertising affects sales, and in turn, sales revenues fund advertising, endogeneity is an important issue for the analysis. Footnote 73 We therefore employ an estimation procedure that uses first differences to control for unmeasured features of stores that do not change over time, such as long-run quality of merchandise, pricing, and differentiation niches, and instrumental variables to control for endogeneity not eliminated by the differencing.
Manual Arellano and Stephen R. Bond developed a dynamic individual effects autoregressive methodology to derive a consistent generalized method-of-moments (GMM) estimator for the parameters using first differences to control for time-invariant differences in stores and time effects to control for national shocks to the department store market. There are several advantages of the methodology in the setting we examine. First, Arellano and Bond show that, in the absence of serial correlation, the most efficient set of instruments are found using the t–2 lagged values of qit and Ait and hence these are the instruments we adopt.Footnote 74 Second, the narrative evidence emphasizes that department stores focused their advertising efforts on developing strong brands. Footnote 75 If they were successful, we should expect there to be feedback mechanisms over time. Third, the HBBR “25-Year Study” index tracks the Fed series well, mirroring its turning points consistently. It is more highly correlated in first differences than in levels, which may suggest a lagged feedback effect. Specifically we estimate,

where qit the sales in store i in period t, is determined by current advertising, ai,t and the advertising of rivals in a given state, riv -ai,t. The vector vi comprises the store-level fixed effects,  is a vector of year fixed effects, the errors εit are identically and independently distributed over the whole sample with a variance
 and
 is sum of lagged dependent variables out to the pth lag. Footnote 76
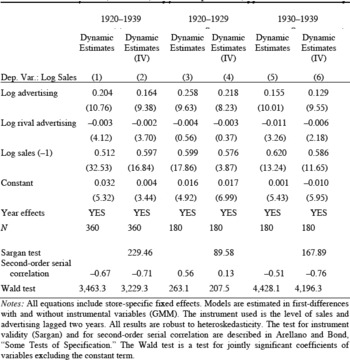
The full set of results is contained in Table 5.Footnote 77 The dynamic estimates of equation 1 in column 1 of the table show that stores' sales over the full 1920–1930 period were influenced by the variation in the current values of advertising expenditures. Since both the dependent and independent variables are expressed in logs, the coefficients can be interpreted as elasticities. Comparing the instrumented vs. Non-instrumented estimations, we observe that in the absence of instrumentation the elasticity of own advertising is roughly 20 percent greater at .204 than the IV estimate of 0.164. That finding is consistent with the positive bias originally identified by Richard Schmalensee in earlier studies of advertising.Footnote 78
ESTIMATES FROM THE “25-YEAR STUDY” (1920–1939, t-statistics in parenthesis)

Notes:
All equations include store-specific fixed effects. Models are estimated in first-differences with and without instrumental variables (GMM). The instrument used is the level of sales and advertising lagged two years. All results are robust to heteroskedasticity. The test for instrument validity (Sargan) and for second-order serial correlation are described in Arellano and Bond, “Some Tests of Specification.” The Wald test is a test for jointly significant coefficients of variables excluding the constant term.
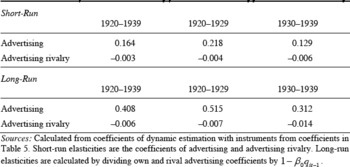
Arellano and Bond's methodology provides consistent estimates only in the absence of serial correlation. Reassuringly, however, the Sargan test rejects the hypothesis of no validity of the instruments and does not reject the null hypothesis of no serial autocorrelation of the residuals.Footnote 79 Table 5 provides short-run elasticities that do not incorporate the lag structure inherent in the dynamic estimation approach. Given the lag structure in the dynamic analysis, we are able to obtain long-run and short-run elasticities from the dynamic model. The short-run elasticities are the coefficients of advertising in the same period, while the long-run coefficients are calculated by dividing own and rival advertising coefficients by  from equation 1. The short- and long-run elasticities for the IV dynamic models are summarized in Table 6.
ESTIMATED SHORT-RUN AND LONG-RUN ESTIMATES OF THE ELASTICITY OF SALES WITH RESPECT TO OWN ADVERTISING AND RIVAL'S ADVERTISING (1920–1939)

Sources:
Calculated from coefficients of dynamic estimation with instruments from coefficients in Table 5. Short-run elasticities are the coefficients of advertising and advertising rivalry. Long-run elasticities are calculated by dividing own and rival advertising coefficients by 1 —  .
We turn to testing the key hypothesis that by the 1930s, department stores had become locked into a competitive spiral of high advertising and promotional expenditure in order to meet the challenge of rival department stores. To do so, we break the sample into two subsamples, allowing us to test whether the impact of own-advertising on stores fell in the 1930s, and whether advertising by rivals reduced own stores' sales in the 1930s more than in the 1920s.Footnote 80
Comparing coefficients, there is a notable difference between the two subperiods. There are two key findings. First, the long-run elasticity of sales with respect to store's own advertising fell by 40 percent, from 0.515 in the 1920s to 0.312 in the 1930s. Second, advertising by rivals only had a statistically significant influence on sales in the 1930s, potentially compelling stores to retaliate against rivals by expanding their advertising spending. However, the elasticity of sales with respect to rival advertising in Table 5 was quite small at −0.007 in the 1920s and −0.014 in the 1930s. Thus, the negative impact was only about one- twentieth of the impact on sales of stores' own-advertising in absolute terms.
CONCLUSION
Department stores are shown to have made heavy and innovative use of advertising. This was originally employed primarily to imprint a strong storewide brand image on their target market segment and build consumer loyalty via “goodwill” or “relationship” marketing. By the 1930s, however, stores were caught up in an increasingly competitive struggle to maintain market share and combat the industry-wide trend of low profits and growth. The qualitative evidence reviewed in this study indicates widespread contemporary perceptions that firms had become locked into a competitive spiral of rising advertising expenditure, expanded services provision, and cut-price sales in an effort to boost sales volumes and meet the competitive threat from rival department stores. While raising advertising expenditure assisted these goals, it was commonly perceived that such gains were eroded by retaliatory increases in advertising by rivals who were also struggling to maintain their own market positions.
The quantitative analysis confirms that the elasticity of own-store sales with response to own-store advertising was much stronger in the 1920s than in the 1930s. However, while the impact of rivals' advertising on own-store sales increased during the 1930s, the elasticity implies that a one percent increase in rivals' advertising reduced own-store sales by less than 0.01 percent. The magnitude of the effect is much lower than would be expected given the qualitative evidence. This might possibly reflect the fact that the most intense competition from other department stores came from those which were close to the store in question both in terms of physical location and in the class of trade they served. Meanwhile, by focusing on competition within the department store sector, stores left themselves vulnerable to competition from the expanding chain stores and speciality retailers, who operated on a lower-cost model, which included much lower ratios of advertising to sales. Thus the department store advertising battle of the 1930s, while perfectly rational from each individual store's perspective, did not provide a long-term solution to the problems of the interwar department store. Department stores had become locked in to a high-cost regime and increasing advertising budgets ultimately only served to further raise costs and erode their competitiveness.