


In the last decade, computer-administered questionnaires have received increased attention for large-scale population research on nutrition(Reference Moore, Ells and McLure1–Reference Vereecken, Covents and Haynie10). Self-administered computer tools have many advantages: standardisation of the questions and questioning sequence, fast and easy processing of data, immediate results, increased flexibility, increased privacy and confidentiality, and enhanced communication using pictures(Reference Brener, Billy and Grady11–Reference Probst, Faraji and Batterham13).
In Belgium, a computerised 24 h recall tool was developed to assess with minimal professional assistance the dietary intake of young adolescents – Young Adolescents' Nutrition Assessment on Computer (YANA-C)(Reference Vereecken, Covents and Matthys8). YANA-C(Reference Vereecken, Covents and Matthys8) consists of a single 24 h recall module, guiding users through six meal occasions. For each meal occasion, adolescents are invited to select all food items eaten at that occasion from a hierarchical menu structure. For each selected item, one or more extra screens are provided to quantitatively gather detailed information regarding portions and portion sizes. Almost 200 sets of standardised photographs are available to assist in the portion-size estimation of items that are difficult to quantify.
Other computerised dietary assessment tools developed and tested in children and adolescents are: in the USA, the Food Intake Recording Software System (FIRSSt)(Reference Baranowski, Islam and Baranowski6) and The Healthy Eating Self-Monitoring Tool (HEST)(Reference Di Noia, Contento and Schinke2, Reference Di Noia and Contento7); in the UK, the Interactive Portion-Size Assessment System (IPSAS)(Reference Foster, Matthews and Lloyd14–Reference Foster, Matthews and Nelson16) and the Synchronised Nutrition and Activity Program™ (SNAP™)(Reference Moore, Ells and McLure1). Similar to the YANA-C, the HEST and the IPSAS use photographs to assist in portion-size estimation whereas FIRSSt used mounds to estimate cooked food on a plate, and SNAP™ analysed all foods and drinks by counts of standard portions, represented by labelled images.
The use of photographs relies on three cognitive skills: perception (the ability to relate an amount of food present in reality to an amount depicted in a photograph); conceptualisation (the ability to mentally construct an amount that is not present in reality and to relate that quantity to a photograph); memory (which affects the precision of the conceptualisation process)(Reference Nelson, Atkinson and Darbyshire17). Several studies have investigated one or more of these aspects in children and adolescents(Reference Foster, Matthews and Lloyd14–Reference Foster, Matthews and Nelson16, Reference Lillegaard, Overby and Andersen18, Reference Frobisher and Maxwell19); two of these using an interactive tool(Reference Moore, Ells and McLure1, Reference Foster, Matthews and Lloyd14). Foster et al. compared the actual known weight and nutrient content of a complete menu with the estimated weights using the Interactive Portion-Size Assessment System (IPSAS)(Reference Foster, Matthews and Lloyd14, Reference Foster, O'Keeffe and Matthews15). Three procedures were tested: real-time testing, with food in front of them (perception); immediately after eating (conceptualisation); and on the following day (memory). Their results indicated no difference between the three procedures and a good agreement on a group level; however, large differences were found on an individual level. Di Noia & Contento(Reference Di Noia and Contento7) compared the intake of fruit, vegetables and juices assessed with the HEST over a 3 d interval with observed intake. Correlations between observed and HEST-recorded intake were significant for eighteen (67 %) of the twenty-seven items studied, and Wilcoxon signed-ranks tests revealed non-significant intake differences for 78 % of the items (significant differences were mainly underestimates of juices). The authors concluded that the HEST was a cost-effective alternative to the conventional paper-and-pencil food record approaches.
The purpose of the present study was to investigate how accurate adolescents are in estimating food portion sizes using YANA-C. More specifically, two procedures were tested: comparison with previously self-served food (short-term recall: conceptualisation and perception); and comparison with pre-weighed food in front of them (real-time: perception). Additionally, two different presentation approaches were explored: in the first approach, different portion sizes were presented sequentially on the screen (one by one); in the second approach, different portion sizes were shown simultaneously.
Materials and methods
Subjects
A convenience sample of 128 adolescents (58 % boys, aged between 11 and 17 years) were recruited from two primary schools (n 38 and n 14, respectively), one secondary school (n 28) and two scout camps (n 19 and n 29, respectively). Parents were sent a letter that included a short explanation of the study. The study was conducted according to the guidelines laid down in the Declaration of Helsinki and all procedures involving human subjects were approved by the Ethical Board of the Ghent University Hospital. A procedure of passive informed consent was followed. Data collection took place in 2006–7.
Materials
Commonly consumed amorphous-shaped foods with different physical characteristics (breakfast cereals, apple sauce, carrots and peas, spaghetti, rice and French fries, crisps, peas, red cabbage, and velouté of chicken (a creamy sauce with pieces of chicken, meatballs and mushrooms)) were selected for the study. Amorphous foods do not have a specified shape; rather they are mounded or assume the shape of the container in which they are served(Reference Chambers, Godwin and Vecchio20).
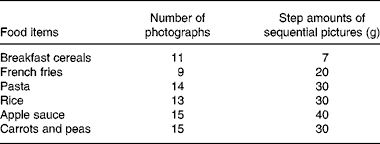
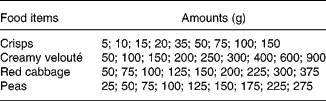
For estimation of the portion sizes, a short version of the YANA-C tool was created, including only the relevant food items. For each food item, nine or more photographs were available, depicting increasing portion sizes of the selected foods (Tables 1 and 2).
Food items, number of photographs available in the tool and step amounts in follow-up screens of the sequential mode
Amounts of the food items for which the photographs are presented simultaneously
All food items were presented on a standard plate of 24 cm in a standard setting (Fig. 1(a) and (b)). Breakfast cereals were presented in a bowl on the plate. Photographs were taken from an angle of 42° to provide the best compromise between depth and height(Reference Nelson, Atkinson and Darbyshire17, Reference Robson and Livingstone21).
Screenshots of food items in different presentation approaches. (a) Screenshot of food item, with increasing amounts in follow-up screens. (b) Screenshot of food item, in which all amounts are presented simultaneously.

The YANA-C tool can present the different portion sizes of the food items in two different presentation approaches. The first approach presents increasing portion sizes sequentially. Starting from an empty plate, one unit of the food (usually, a spoon of the food) is added by clicking on a ‘more’ button; by clicking on a ‘less’ button, the amount is decreased by one unit. For larger units this can also be fractions of a unit (for example, 0·5 for a soup ladle). This approach was tested for breakfast cereals, apple sauce, carrots and peas, spaghetti, rice and French fries. The equivalent amount of a spoon was based on the Belgian manual on food portions and household measures(22).
The second approach presents different portion sizes simultaneously (crisps, peas, red cabbage, and creamy velouté). This approach is limited to the presentation of nine photographs. To be able to present a wide range, larger increases were made between the food items at the upper end (for example, an increase of two spoons between two succeeding portions), because with increasing magnitude, the noticeable difference between two stimuli becomes bigger(Reference Foster, Matthews and Lloyd14). While moving over the portions, the quantity of the portion appears on the screen (expressed in grams). By clicking on the pictures the selected amount appears in the text box. For both approaches, in-between amounts (apart from the standardised ones) can be typed into a text box.
Procedure
Two procedures were followed. First, the adolescents were asked to serve themselves with their usual portion of the selected food items. Adolescents were told that they would not be eating the food, to prevent any influence on their behaviour. The researcher weighed and registered the amounts for each food item. In the few cases that a particular food item was never consumed, respondents were asked to think about an item with comparable consistency. Once this was achieved for all adolescents, they were asked to select for the same food items the portion they had previously served themselves (equal to their usual portion size), making use of the adapted YANA-C tool. This first procedure was designed to estimate the accuracy of the adolescents' perception and conceptualisation of food portion sizes (short-term recall).
A second procedure (real-time perception of pre-weighed foods) was designed to estimate the accuracy of adolescents' perception. For this procedure, two sets of plates with the same food items as procedure 1 were prepared. Pre-weighed amounts are presented in Table 4. Each set contained half of the small and half of the large amounts. Adolescents were asked to look at the food items and select the portion size that best resembled the amounts of food in front of them using the adapted YANA-C tool.
Ninety adolescents participated in procedure 1 (due to time constraints, one primary school participated only in procedure 2); moreover, the data from seventeen adolescents for procedure 1 were lost due to a human error during registration, resulting in a final sample of seventy-three adolescents (67 % boys) for the first part of the study. All adolescents participated in the second procedure (58 % boys), although the number of participants might differ by the food items, as not all food items were available on each testing occasion. In addition, some items were not analysed for the secondary school, as different reference amounts were used.
Analysis
Wilcoxon signed-rank tests were computed to investigate the systematic differences between actual weights (self-served or presented) and estimated weights. Percentage difference was computed by subtracting the mean actual weight from the mean estimated weight, divided by the actual weight and multiplied by 100. Thus, a positive value indicates an overestimation, whereas a negative value denotes an underestimation. Percentages of participants choosing portion sizes within 10, 25, 50 and 75 % of the self-served and pre-weighed portions were calculated, in addition to the percentages of students choosing the correct photograph, the adjacent photographs, and so on. Spearman's correlation coefficients were computed between the self-served portions and assessed portions. Weighted κ statistics were computed to compare tertiles of the self-served and assessed portions. Values for κ < 0 were considered as poor; 0–0·20 as slight; 0·21–0·40 as fair; 0·41–0·60 as moderate; 0·61–0·80 as substantial; and 0·81–1·00 as almost perfect(Reference Kramer and Feinstein23).
Mann–Whitney U tests were computed to evaluate any differences in the percentage difference between the two sets of portion sizes presented in procedure 2 (i.e. to investigate if there was a significant difference in the estimation of the small v. large portions).
All analyses were carried out for boys and girls together because, for most items, no significant difference in the percentage difference was found. All the analyses were carried out using SPSS 15.0.1.1 (2007; SPSS, Inc., Chicago, IL, USA). Values were considered significant at P < 0·05.
Results
Comparison of self-served food portions and estimated portions resulted in significant underestimates for four of the ten food items: breakfast cereals, French fries, carrots and peas, and peas (Table 3). The percentage differences varied between − 30 % for French fries and +9 % for crisps. On average, 21 % of estimates were within 10 % of the self-served weight. On average, 51 % of the estimates were within 25 % of the self-served weights and on average 84 % within 50 %. The correct photograph was selected by 31 %, on average, whereas the correct or an adjacent photograph was chosen by 71 %, on average (Fig. 2). Spearman's correlations between the actual and estimated weights varied between 0·51 and 0·84, with an average of 0·72. The κ statistic was fair (0·36) for apple sauce and moderate (>0·4) for all other food items.
Comparison of self-served and estimated weight (g) for a food item that is no longer present (short-term recall method)

* Wilcoxon signed-rank test comparing actual and estimated weight.
† % Difference = mean difference/actual weight × 100.
‡ Percentage respondents with (absolute value of (estimated weight − self-served weight)/self-served weight) ≤ 0.x, with x being 10, 25, 50 and 75 for 10 %, 25 %, 50 % and 75 %, respectively.
§ Item not available in one of the scout camps, so n differs substantially.
∥ Item not available in the secondary school and the primary school.
Percentage respondents underestimating, correctly estimating and overestimating self-served food by food item expressed in number of pictures underestimated or overestimated.

Table 4 shows significant underestimates for fourteen of the twenty comparisons with food in front of the adolescents, whereas an overestimation was found for the smaller portion of breakfast cereals. The percentage differences were, on average, − 12 % for the small amounts and − 18 % for the large amounts. On average, 29 % of estimates (small portions, 38 %; large portions, 20 %) were within 10 % of the presented weights. On average, 57 % of the estimates (small portions, 54 %; large portions, 61 %) were within 25 % of the presented weights and on average 97 % within 50 % (small portions, 96 %; large portions, 98 %). The correct photograph was selected by, on average, 28 % (small portions, 38 %; large portions, 17 %), whereas the correct or an adjacent photograph was chosen by 74 %, on average (small portions, 92 %; large portions, 55 %). For half of the items, larger portions were more underestimated than the smaller portions (breakfast cereals, pasta, rice, carrots and peas, and red cabbage; P < 0·005); the small portion was more underestimated only for velouté (P = 0·007) (data not shown).
Comparison of small and large pre-weighed portions with estimated portions (g) (real-time method)

* Wilcoxon signed-rank test comparing actual and estimated weight.
† % Difference = mean difference/actual weight × 100.
‡ Item not available in one scouts camp, so n differs substantially.
§ Deviating reference amount in secondary school, so n differs substantially.
∥ Deviating reference amount in one primary school, so n differs substantially.
¶ Items not available in the secondary school and in one primary school, so n differs substantially.
Discussion
In several studies, photographs of various portion sizes of food have been developed to improve the accuracy of food quantification. This was also the case for the estimation of amorphous or mounded foods using the YANA-C tool. It is, however, inevitable that inaccuracies in portion size will remain(Reference Nelson, Atkinson and Darbyshire17), and, therefore, documentation of these errors is necessary. In the present study, we investigated how accurately adolescents could assess portion sizes with a short version of YANA-C for ten commonly consumed amorphous foods with different textures.
The major finding of the present study is that, in general, adolescents tend to underestimate the portions. In the first procedure, estimates of four of ten previously self-served portions were significantly underestimated; in the second procedure, fourteen estimates of twenty pre-weighed portions were underestimated. Probably, the two-dimensional pictures insufficiently reflect the height and depth, in spite of the angle at which the pictures were taken.
This underestimation is in contrast with the findings of Frobisher & Maxwell(Reference Frobisher and Maxwell19): they asked children to assess self-served portions using a food atlas and found an overestimate for six of the nine items immediately after removing the items; and for seven items, an overestimate was found 3–4 d later. Foster et al., on the contrary, found both over- and underestimation(Reference Foster, O'Keeffe and Matthews15). Furthermore, in studies among adults, both underestimation(Reference Ovaskainen, Paturi and Reinivuo24) and overestimation(Reference Hernandez, Wilder and Kuehn25, Reference Turconi, Guarcello and Berzolari26) of food servings have been reported.
The underestimation in the present study was, on average, 8 % for the first procedure (self-served) and 15 % for the second procedure (pre-weighed), ranging between − 30 % and +9 % for the first procedure and between − 33 % and +12 % for the second procedure. In other studies(Reference Foster, O'Keeffe and Matthews15, Reference Lillegaard, Overby and Andersen18), even larger variations in the accuracy of estimates between different types of food have been found. Nevertheless, comparison with other studies is difficult because of the lack of a uniform measure or level of accuracy across studies(Reference Ovaskainen, Reinivuo and Tapanainen27), differences in food items, and differences in methodology(Reference Foster, Matthews and Nelson16, Reference Robson and Livingstone21). For example, in a study of Frobisher & Maxwell(Reference Frobisher and Maxwell19), the median differences varied between − 33 % for sausage rolls and+79 % for chips (with only three of the nine items within a range of ± 20 % of the actual weight); however, the population surveyed in their study was between 6 and 16 years of age. Another example is a study conducted by Lillegaard et al. (Reference Lillegaard, Overby and Andersen18), in which the percentage differences for a procedure with food in front of the children ranged from − 46 % to+142 %. On the contrary, the percentage of correct and adjacent classifications was much higher in their study: on average, 60 % correct classifications, with 95 % of the comparisons within ± one photograph, whereas in the present study, these percentages were, respectively, 28 % and 74 % for pre-weighed foods. They, however, used a food atlas with only four portion sizes per food item; the inherent differences between the pictures were larger, which almost inevitably led to the selection of more correct pictures.
A second finding in the present study was a larger underestimation in larger portion sizes: on average, the small portions were 12 % underestimated, whereas the larger portions were 18 % underestimated (pre-weighed procedure). Similarly, in a study of Ovaskainen et al. (Reference Ovaskainen, Paturi and Reinivuo24), larger portion sizes were less accurately reported than were small and medium portion sizes. This can be explained by the increase in the just noticeable difference between two stimuli with increasing amounts, making it more difficult to select the correct photograph(Reference Foster, Matthews and Lloyd14).
In spite of both the underestimations and the fact that only about half of the estimates were within 25 % of the actual weight of the self-served portions, correlations and κ statistics indicated acceptable values for ranking and categorising adolescents' relative intakes for most of the items.
Comparing both administration procedures (self-served portions, for which the food is no longer present v. pre-weighed food in front of the respondent), these results indicate larger underestimates with food in front, whereas the reverse could be expected intuitively. Foster et al., on the contrary, did not find a difference between administration procedures(Reference Foster, O'Keeffe and Matthews15). Several explanations are possible for the differences between both the procedures. First, it is difficult to compare both these procedures because, as indicated by the comparison of the small v. large pre-weighed portion size estimations, food portion size appears to play an important role in the accuracy of estimation; hence, larger portions, which seemed to be more underestimated, are disadvantaged. Second, motivation might have decreased for the second procedure. Third, adolescents might remember the number of self-served spoons better than the perceived amount on the plate or it might be a combination of both (the number of spoons+the perceived portion) that leads to a better estimation of food in the self-served procedure. Fourth, some adolescents were only included for the analyses of one of both procedures.
Finally, we also investigated two presentation approaches: sequential presentation of increasing amounts of food items in follow-up screens (the standard in YANA-C), and simultaneous presentation of nine portion sizes. Both have advantages and disadvantages. In the first approach, adolescents might stop clicking on the ‘more’ button once the photograph roughly resembles the actual or visualised portion size, although the next photograph might have been an even more accurate estimate. The latter could help explain the underestimations found in the present study but does not explain the underestimation recorded in the simultaneous presentation. A disadvantage of the simultaneous presentation is that only nine pictures are possible; therefore, a selection of appropriate portions needed to be made. In addition, the pictures of the individual portion sizes were much smaller (1/9th; Fig. 1(a) v. Fig. 1(b)). It might be worthwhile to consider a zoom function in future updates of the program so that pictures have a minimum size of, for example, 75 × 100 mm, as suggested by Nelson et al. (Reference Nelson, Atkinson and Darbyshire17). Future studies should compare the validity of both presentation approaches for the same food items.
Some limitations should be noted. The application was tested in an artificial setting, where the adolescents were not asked to eat the served or self-served portions. Additionally, most adolescents participated during a scout camp or on a free afternoon; the latter occurrence might have resulted in the fact that some adolescents completed the tests less seriously than they would do during actual school hours. Furthermore, adolescents interacted with a short version of YANA-C that included only the items tested. In a study on adolescents' food habits, they would first have to identify the food items in a larger repertoire of items, which may result in less accurate reports if not the most appropriate items are selected.
An identical plate of the ones used in YANA-C was available during the testing procedures; however, locally available plates were used by youths to self-serve the foods studied and to present the different portion sizes. Although all these plates were white and round, some were 1 cm diameter smaller and/or had a broader board.
The item most underestimated in both procedures was French fries. We suspect, however, that part of the difference can be explained by a real difference. Food items were weighed as served. However, potatoes consist of about 79 % water(28); therefore, they can lose a considerable amount of their weight during preparation depending on preparation time and temperature. We, however, did not register the preparation time or temperature and therefore the same volume could have resulted in a different weight. Moreover, comparison of pictures taken during the fieldwork of French fries with the YANA-C pictures of French fries, indeed, suggests a real difference. This is what happens in real-life situations also: people have different cooking and preparation styles and use different plates, leading to real or apparent differences.
The present findings indicate that the food photographs used in our tool can serve as a good aid in ranking subjects; however, to assess the actual intake at a group level, underestimation must be considered. Further validation of more food items in larger samples of different ages and in real-life situations is advocated as well as further validation of both presentation approaches for the same food items.
Acknowledgements
C. V. is a postdoctoral researcher funded by the Research Foundation-Flanders (FWO-Vlaanderen).
All authors contributed to the conception of the study. C. M. developed the software. S. D. organised the data collection and did the preliminary analyses in the frame of her Masters Thesis at the University College Ghent, member of Ghent University Association, Faculty of Health Care Vesalius. C. V. did the final analyses and wrote the manuscript. All authors read and approved the manuscript.
There are no conflicts of interest.



