Implications
Current feed evaluation systems are not suitable to predict animal responses to dietary changes. This paper quantifies average dry matter intake, milk yield and milk composition responses to change in net energy and metabolizable protein. The equations were derived from a meta-analysis of literature studies, which assembles a large number of dairy cow rations with a large range in dietary net energy and metabolizable protein contents.
Introduction
Adapting dairy cow rations to cope with feed and milk price volatility whilst taking into account environmental, animal health and welfare concerns represents a major challenge for dairy producers. There is a need to predict not only the nutritional requirements but also the response of animals to diet changes (Oldham and Emmans, Reference Oldham and Emmans1989; Sauvant, Reference Sauvant1992; Dijkstra et al., Reference Dijkstra, Kebreab, Mills, Pellikaan, López, Bannink and France2007). In order to be able to predict responses, three key processes need to be quantified. First, the prediction of dry matter intake (DMI) response to dietary changes, second, rumen digestion and fermentation processes to obtain accurate estimates of nutrients available for absorption (Van Duinkerken et al., Reference van Duinkerken, Blok, Bannink, Cone, Dijkstra, van Vuuren and Tamminga2011; Volden, Reference Volden2011; Sauvant and Nozière, Reference Sauvant, Cantalapiedra-Hijar, Delaby, Daniel, Faverdin and Nozière2016), and third, the partition of those absorbed nutrients between different life functions (Bauman, Reference Bauman2000; Friggens et al., Reference Friggens, Brun-Lafleur, Faverdin, Sauvant and Martin2013). One aspect of nutrient partitioning, the relation between changes in nutrient supply and milk production and composition, has received a lot of attention. In particular, the effects of changes in either metabolizable protein (MP) (Vérité et al., Reference Vérité, Michalet-Doreau, Chapoutot, Peyraud and Poncet1987; Metcalf et al., Reference Metcalf, Mansbridge, Blake, Oldham and Newbold2008) or net energy (Coulon and Rémond, Reference Coulon and Rémond1991) on milk outputs have been largely characterized. However, it is still unclear how to quantitatively combine the effects of changes in net energy and MP, including possible interactions between them, for predicting milk yield and milk composition responses. The divergent conclusions regarding the existence of net energy×MP interaction on milk yield and milk protein yield found in recent studies (Broderick, Reference Broderick2003; Brun-Lafleur et al. Reference Brun-Lafleur, Delaby, Husson and Faverdin2010; Rius et al., Reference Rius, McGilliard, Umberger and Hanigan2010) highlight the need to quantitatively summarize the available studies. Given the large diversity of studies focussed on the effect of dietary energy and protein content, meta-analysis represents a useful approach for quantifying milk production and milk composition responses to combined changes of net energy and MP.
The objectives of this study were therefore to establish (1) average DMI response to dietary changes, (2) average milk yield and composition responses to net energy and MP, both on a concentration and a supply basis and to (3) quantify any interactions between net energy and MP contents and supplies on responses of milk yield and milk composition.
Material and methods
Database creation
A literature search was conducted using Scopus and ScienceDirect with the following keywords: dairy cows, milk production, protein, energy, concentrate, forage, degradability. References included in the resulting papers were also checked. As a result, 261 publications (1316 treatments means) were considered for possible inclusion in the data set. The minimum prerequisite for a published study to be included in the data set was that feed description in term of ingredients (%dry matter (DM) of the total diet), dietary CP content (g/kg DM), DMI (kg/day), milk yield (kg/day), milk fat and protein yields (g/day) and BW (kg) were reported or could be easily calculated, and that the animals were fed ad libitum. After selection, 237 publications, consisting of 1174 treatment means that satisfied the above criteria, were kept. The final list of publications used in the meta-analysis can be found in Supplementary Material S1.
Calculations
The digestibility of the organic matter (OMD), CP flows at duodenum, net energy for lactation (NEL) and MP values were calculated for all diets in the data set using the recently updated INRA Systali feed units system (Sauvant and Nozière, Reference Sauvant, Cantalapiedra-Hijar, Delaby, Daniel, Faverdin and Nozière2016). Briefly, this update consisted of quantifying the effect of digestive interactions on nutrient supplies, and subsequently on NEL and MP values (see Supplementary Material S2 for further details). The required inputs to calculate these values are BW of the animals, DMI, the proportion of concentrate in the ration, the percentages of every ingredient included in the diet (DM basis) and their corresponding tabulated feed number code from the INRA feed library (Baumont et al., Reference Baumont, Dulphy, Sauvant, Meschy, Aufrère and Peyraud2007). Forages and concentrate ingredients listed in the publications were matched with tabulated feeds on the basis of their CP and NDF contents. For each treatment, the CP and NDF concentrations of the total diet were calculated and compared with measured chemical characteristics in the publications. If several codes were available for one ingredient (e.g. forages, soya bean meal) and that no analysis was reported for that ingredient, the code was chosen to minimize the differences between the estimated and measured CP and NDF of the total diet. For the set of studies where measured values were available, the slope of the within-study relationship between estimated and observed values of OMD (number of treatment (Nt)=474) and CP flow to the duodenum (Nt=115) was tested against one (bisector) with an F test. Root mean square error (RMSE) was used to assess the quality of the estimates.
Data coding
The full set of selected studies was coded. Unless several studies were reported within a publication, a study was equivalent to a publication. Data were coded at the level of experiments (Nexp), where an experiment is defined as a group of treatments (with a minimum of two treatments) relating to a particular objective within any given study. These experiment codes were subsequently used to split the within- and between-experiment variation, as recommended in the meta-analysis review of St-Pierre (Reference St-Pierre2001). These codes also enabled the selection of subsets of experiments with the same objective as a means to avoid confounding factors (Sauvant et al., Reference Sauvant, Schmidely, Daudin and St-Pierre2008). The two experiment types coded for were MP level and NEL level experiments. The latter pooled experiments with various inclusion levels of concentrate or various starch : fibre ratios. The two columns of codes for ‘energy’ and ‘protein’ experiments were concatenated in a ‘energy×protein’ column. For studies with a factorial arrangement of energy and protein levels, the code for study was used to concatenate. This increases the statistical power of the model to detect any significant interaction between MP and NEL. Experiments lacking within-experiment differences, for both variables dietary MP and NEL contents, were discarded (Nt=22). Experiments with lipids levels/sources as treatment were not selected as it was not our present objective (Nt=89). Other treatments in our database, which were not related with dietary energy or protein (Nt=238, particle size, silage hybrids, enzyme, feeding frequency, bovine somatotropin, etc.) were also discarded. Consequently, from the 1174 treatments means that satisfied the original prerequisites for selection, a total of 825 treatments (publication=168, Nexp=282) were kept (see Supplementary Material S1).
Statistical analysis
Statistical analyses were carried out using PROC MIXED of SAS (SAS Institute Inc., Cary, NC, USA). The first objective was to quantify, within-experiment, milk yield, milk component yields and milk composition responses to change in dietary NEL and MP contents. The model used for that purpose was
 $$\eqalignno{ Y_{{ij}} {\rm \,{\equals}\,} \mu {\rm {\plus} }S_{i} {\rm {\plus} }e_{\rm 1} {\rm .}dE{\rm {\plus}} p_{\rm 1} {\rm .}dP{\rm {\plus} }e_{\rm 2} {\rm .}dE^{\rm 2} {\rm {\plus}}p_{\rm 2} {\rm .}dP^{\rm 2} \cr{\rm {\plus}}a{\rm .}dP{\times}{\rm }dE{\rm {\plus}} {\varepsilon}_{ij} $$
where Y ij is the milk yield, milk component yields or milk composition for experiment i and treatment j , dE and dP the mean-centred concentrations of NEL (MJ/kg DM) and MP (g/kg DM). The values used to centre NEL and MP were 6.7 MJ/kg DM and 100 g/kg DM, respectively. These variables were centred to reduce the correlations between intercept and slope. μ is the centred intercept that gives directly the mean value of the Y variable; S i the fixed effect of experiment i , e 1 and e 2 the linear and quadratic coefficients of dE; p 1 and p 2 are the coefficients for the linear and quadratic effects of dP; a the coefficient adjusting the response slope for the interaction between dP and dE; and ε ij the residual for experiment i and treatment j . As discussed by St-Pierre (Reference St-Pierre2001), the underlying assumption for using an adjustment based on a random effect is that the observations in question are in fact a random sample from the wider population. In the present meta-analysis, the experiments selected were not picked at random. Only experiments that used dietary treatments related to amount or quality of protein and/or energy were selected. Among those experiments, we chose to discard those with dietary lipid levels/sources as treatment. Moreover, experiments lacking variation in dietary NEL and MP contents between treatments were not retained. For these reasons, we chose to include the experiment effect as a fixed effect. Further, when the experiment effect is assumed random the statistical distribution of the adjustments for experiment should generally follow a normal Gaussian law. This was not the case for the majority of dependent variables studied in our data set. For completeness, a comparison of fixed and random model outputs is given in Supplementary Tables S1 and S2. Treatment observations were not weighted according to their standard errors because there was no benefit of doing so (see Supplementary Table S3). The same model (1) was used to quantify the DMI response with the exception that dietary NEL was replaced by dietary forage NDF content (FNDF, g/kg). FNDF was mean centred, on 250 g/kg DM. The quadratic effect of FNDF and interactions of FNDF with MP were also tested but were not found to be significant.
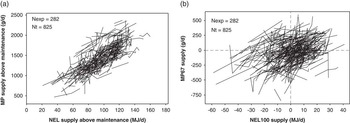
The second objective was to quantify, within-experiment, milk yield, milk component yields and milk composition responses to changes in NEL and MP supplies above maintenance. These co-variables were preferred over total NEL and MP supplies to correct for different energy and protein maintenance requirements, that is to avoid biases due to different BW and DMI. The equations and method used for calculating MP and NEL maintenances are given in full detail in Supplementary Material S2. As there was a strong inter-experiment co-linearity between NEL supply and MP supply (by construction both contain DMI), it was necessary to centre these predictors on reference values that reduced this co-linearity (see Figure 1). Centring on the global means does not achieve this. We chose to adjust MP supply by expressing it relative to the MP supply needed for an efficiency of 0.67. This efficiency was chosen because it is equivalent to an average dietary MP content of 100 g/kg DM (Sauvant et al., Reference Sauvant and Nozière2015), the reference value chosen in the concentration analysis. Moreover, the NRC (2001) also uses 0.67 as a constant MP efficiency. To centre the data, the slope (α) of the linear relation between MP above maintenance supply (S ij ) and MP efficiency (F ij ) was first determined (with experiments fitted as a fixed effect). The centred MP supply (MP67) was then calculated as S ij −S i +α (F i −0.67), where S i is the experiment mean MP above maintenance supply and F i the experiment mean MP efficiency. Similarly, the centred NEL supply (NEL100) was calculated as S ij −S i +α (F i −1.00), where S i is the experiment mean NEL above maintenance supply, F i the experiment mean milk NEL efficiency (NEL in milk/NEL above maintenance) and α the slope of the linear relation between NEL above maintenance supply (S ij ) and milk NEL efficiency (F ij ). The milk NEL efficiency of 1 was chosen because it is equivalent to a zero energy balance. Finally, responses were estimated with model (1) where dE and dP are NEL100 and MP67.
Meta-designs showing the relations between (a) metabolizable protein (MP) above maintenance supply (g/day) and net energy for lactation (NEL) above maintenance supply (MJ/day) and (b) between MP67 supply (g/day) and NEL100 supply (MJ/day). Each line represents one experiment group (Nexp=282) including 825 treatments (Nt). MP67=MP above maintenance supply centred on supply for which MP efficiency is 0.67; NEL100=NEL above maintenance supply centred on supply for which the ratio NEL in milk/NEL above maintenance is 1.00.

Akaike’s information criterion (AIC) was used to select the best model, with non-significant terms being progressively dropped. Differences in AIC >3 between two models indicate that there is good evidence that the model with the smaller AIC is significantly better than the model with the larger AIC (Burnham and Anderson, Reference Burnham and Anderson2002). Co-linearity between independent variables was assessed using their mutual correlations and the variance inflation factor (VIF) generated with PROC REG of SAS (SAS Institute Inc.). In general, estimability is assumed acceptable when all VIF are below 10 (St-Pierre and Glamocic, Reference St-Pierre and Glamocic2000). Observations from model (1) were considered as outliers when their studentized residuals were higher than three (Sauvant et al., Reference Sauvant, Schmidely, Daudin and St-Pierre2008). In this case, they were removed stepwise until there were no such outliers left. For each analysis, the percentages of outliers removed are reported in the Results section together with the RMSE.
Results
Reliability of calculated nutritional values
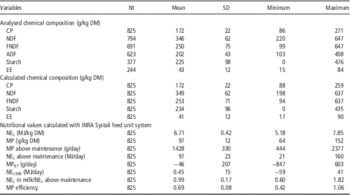
The average calculated diet contents of CP, NDF, FNDF and starch were 172 (SD 22), 349 (62), 253 (71) and 234 (96) g/kg DM, respectively. The reliability of these calculated diet content was evaluated by regression of the analysed diet contents (dependant variables) on the calculated diet contents (independent variables). The slope of the global relationship between analysed and calculated CP was 0.98 (SE 0.01, Nt=825, RMSE=7) and was not different from 1 (P=0.148). Between analysed and calculated NDF the global slope was 0.86 (SE 0.02, Nt=794, RMSE=30) and significantly differs from 1 (P<0.001). However, for FNDF the global slope, 0.99 (SE 0.01, Nt=691, RMSE=20), was not significantly different from 1 (P=0.361). For starch, the global slope of 0.98 (SE 0.02, Nt=373, RMSE=30) did not differ from 1 (P=0.214). The within-experiment slope between analysed and calculated OMD (mean±SD, 69.0±5.8%, Nt=474) was 0.97 (SE 0.05) and did not differ significantly from 1 (P=0.548), with RMSE of 1.6% units of OMD. For the 115 treatments that analysed CP flows at duodenum (mean±SD, 3404±756 g CP/day), the within-experiment slope between analysed and calculated value, 0.85 (SE 0.09) was not significantly different from 1 (P=0.119, RMSE=206).
General description of the data set
The average year of publication was 2001±8 (mean±SD) and studies mainly originated from North America (64%) and Europe (34%). The experimental designs used were, Latin square (63.2%), randomized block design (26.4%) and change-over design (10.4%). The average number of animal used per treatments was 10±7. In 74% of the treatments, animals were fed a total mixed ration, with the remaining 26% fed forage and concentrate separately. The principal diet ingredients are displayed in Supplementary Table S4. The most frequently used forages were maize silage and alfalfa silage, followed by grass silage. However, the average inclusion of the latter, when present, was higher than that of maize and alfalfa silages (54±20 v. 35±16 and 29±18% of DM, respectively). Ground maize was the ingredient most frequently used as an energy source in the concentrate. With respect to protein sources, soya bean meal (solvent extracted, expeller and extruded), followed by rapeseed meal were the most frequently used sources of rumen degradable protein. Sources of rumen undegradable protein (RUP) were mainly heat treated soya bean meal, maize gluten meal, fish meal and blood meal.
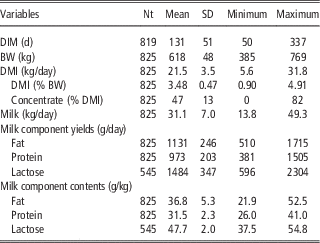
Table 1 shows the animal characteristics and the milk production data. The predominant breed was Holstein-Friesian (90% of all cows) and 86% of the cows were multiparous. From the 819 treatments where stage of lactation was reported, no treatments were conducted with cows averaging under 50 days in milk (DIM) and only 64 treatments used groups of cows in late lactation (with an average >200 DIM). Thus, 92% of treatments used cows in mid lactation (50<DIM<200). In most of the experiments (91%), cows were milked twice daily with the remaining 9% milked three times a day. The means of SEM reported in the publications for the dependent variables were as follows (SD in parentheses): DMI=0.62 kg/day (0.35, Nt=763), milk yield=1.07 kg/day (0.66, Nt=794), milk fat yield=56.9 g/day (34.5, Nt =687), milk protein yield=38.4 g/day (30.9, Nt=695), milk lactose yield=56.8 g/day (37.9, Nt=411), milk fat content=1.30 g/kg (0.63, Nt=788), milk protein content=0.55 g/kg (0.63, Nt=794) and milk lactose content=0.42 g/kg (0.29, Nt=522).
Animal performance characteristics

Nt=number of treatment means; DIM=days in milk, defined as the mean during the measurement period; DMI=dry matter intake.
Meta-designs in the database
Table 2 shows the measured and calculated chemical composition of the published treatments, and the calculated nutritional values with the INRA Systali model. The mean of MP67 was negative (−46 g/day). This is because the mean MP efficiency of this data set (0.69) was higher than the reference MP efficiency (0.67) used to centre MP above maintenance supply. In contrast the reference for energy, NEL in milk/NEL above maintenance supply of 1, was very close to the mean of the data set (0.99), which explains why the mean of NEL100 is close to 0.
Chemical compositions of the published treatments and calculated nutritional values with INRA Systali feed unit system

Nt=number of treatment; DM=dry matter; FNDF=forage NDF; EE=ether extract; NEL=net energy for lactation; MP=metabolizable protein, MP67=MP above maintenance supply centred on supply for which MP efficiency is 0.67; NEL100=NEL above maintenance supply centred on supply for which the ratio of NEL in milk/NEL above maintenance is 1.00; MP efficiency=efficiency to convert MP above maintenance into milk protein.
Among the 282 experiments (Nt=825) selected to study the effect of NEL and MP interaction on milk responses, 47% compared two treatments, 26% compared three treatments and the remaining more than three treatments (from 4 to 12). Experiments were characterized according to three main types of treatments: those with treatments that varied mainly in dietary MP content (458 Nt), those with treatments that varied mainly in dietary NEL content (208 Nt), and experiments with treatments that varied in both dietary NEL and MP contents (159 Nt). For the 142 experiments with variation in NEL, the within-experiment relationship between calculated starch content and calculated NDF content (g/kg DM) was negative and linear: starch=684 (SE 12)−1.31 (0.03) NDF (RMSE=21). For the 213 experiments with MP variation, a strong within-experiment relationship linked MP and RUP (g/kg DM) with MP=44.0 (0.6)+0.91 (0.01) RUP (RMSE=1.8). The slope of 0.91 highlighted clearly that variation in MP are mainly the result of variation in dietary bypass protein.
The meta-design shown in Figure 1a shows the relationship between NEL and MP above maintenance supplies before they are centred (NEL milk/NEL above maintenance=1.00, MP efficiency=0.67). Figure 1b shows the relationship between daily NEL100 supply and daily MP67 supply after centring. The within-experiment correlation between NEL100 and MP67 supply was naturally unaffected by these adjustments (adjusted R 2=0.42, RMSE=91 g/day) but the global correlation, that is including both inter- and intra-experiment variation, was largely reduced (adjusted R²=0.13 v. 0.59) as intended. Between MP and NEL contents, the global and within-experiment correlations were low with an adjusted R 2 of 0.09 and 0.10, respectively. For the prediction of DMI response, FNDF was used instead of NEL in the model. The within-experiment correlation between dietary FNDF content and MP had an adjusted R² of 0.11. For all analysis, there were no independent variables with a VIF>2 and therefore the estimability of coefficients was assumed acceptable.
Dry matter intake response to change in forage NDF and metabolizable protein contents
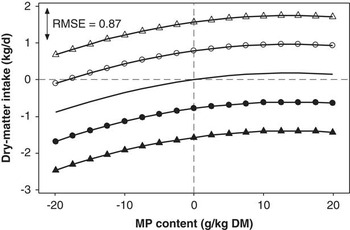
The average DMI (kg/day) decreased linearly with change in dietary FNDF (%/kg DM centred on – 25%/kg DM) and increased curvilinearly with change in dietary MP content (kg/kg DM centred on – 0.1 kg/kg DM). The regression is (standard errors of coefficients are reported in parentheses):
DMI=21.78 (0.05)+25.8 (5.8) MP−933.7 (217.6) MP2−0.1568 (0.0094) FNDF (Nexp=281; Nt=807; outlier=2.2%; RMSE=0.87).
There was no significant interaction between MP and FNDF in this analysis. The simulated DMI response, shown in Figure 2, illustrates the magnitude of the response to changes in MP and FNDF contents.
Prediction of the average dry matter (DM) intake response to change in metabolizable protein (MP) content (g/kg DM) and in forage NDF content (g/kg DM). Forage NDF effects are shown by the vertical displacement that are each for a forage NDF content: −100 g/kg DM (Δ), −50 g/kg DM (○), 0 g/kg DM (no symbol), +50 g/kg DM (●), +100 g/kg DM (▲). All variables are expressed relative to global mean values (MP=100 g/kg DM, Forage NDF=250 g/kg DM) with average DM intake of 21.8 kg/day. The root mean square error (RMSE) is indicated by the double-headed arrow.

Milk responses to change in net energy and metabolizable protein contents
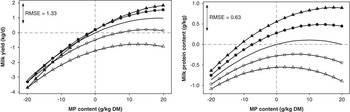
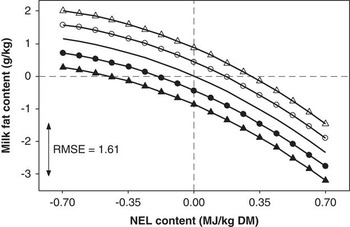
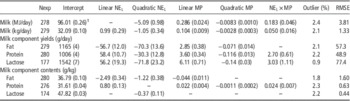
The model coefficients obtained for milk yield, milk component yields and milk composition responses to change in dietary NEL and MP contents are presented in Table 3. These coefficients can be used to predict milk responses within the ranges of 5.9 to 7.6 MJ/kg DM for NEL and 73 to 121 g/kg DM for MP (means±2 SD), which reflect the current data set. Milk yield and composition variables were all affected by NEL and MP contents, with the exception of milk lactose content which was not significantly influenced by dietary MP. Figure 3 shows the predicted responses of milk yield, and milk protein content, to change in dietary MP content. The effect of MP was positive and curvilinear for milk yield, milk component yields and milk protein content. The slope of the response to dietary MP was greatest for milk lactose yield and lowest for milk fat yield. As an example, for a level of energy of 6.7 MJ/kg DM, increasing MP content from 80 to 120 g/kg DM increases milk lactose yield, milk protein yield and milk fat yield by 244, 144 and 114 g/day, respectively. The milk lactose yield response was associated with the greatest RMSE, followed by milk fat yield and milk protein yield (Table 3). The influence of MP and NEL content changes on milk lactose and protein yield responses was reflected in milk yield response. With respect to milk composition, milk fat content was the most influenced by changes in dietary NEL and MP. It decreases with increasing dietary NEL, as illustrated in Figure 4. Not surprisingly, milk lactose content was the least influenced. The hierarchy of RMSE between milk component contents was consistent with the magnitude of the observed responses. The NEL×MP interaction was positive and significant (P<0.01) for milk yield (Figure 3), milk protein yield, milk lactose yield and milk protein content (Figure 3). Thus, the response to NEL content was more pronounced at higher MP contents and less pronounced at lower MP contents. In contrast, for milk fat yield and milk fat content (Figure 4) the effects of dietary NEL and MP contents were additive. Milk energy output was consistent with the responses found for milk component yields (Table 3). The negative influence of NEL on milk fat yield together with the positive relationship between NEL and yield of lactose and protein resulted in a quadratic milk energy response to dietary NEL.
Prediction of average milk yield milk protein content responses to change in metabolizable protein (MP) content (g/kg dry matter (DM)) and to change in net energy for lactation (NEL) content (MJ/kg DM). Energy effects are shown by the vertical displacement between the lines that are each for a NEL content: −0.70 MJ/kg DM (solid line with Δ), −0.35 MJ/kg DM (solid line with ○), 0 MJ/kg DM (blank solid line), +0.35 MJ/kg DM (solid line with ●), +0.70 MJ/kg DM (solid line with ▲). All variables are expressed relative to global mean values (NEL=6.7 MJ/kg DM, MP=100 g/kg DM) with average milk yield of 32.1 kg/day and milk protein content of 31.6 g/kg. The root mean square error (RMSE) is indicated by the double-headed arrow.

Prediction of average milk fat content response to change in net energy for lactation (NEL) content (MJ/kg dry matter (DM)) and to change in metabolizable protein (MP) content (g/kg DM). Protein effects are shown by the vertical displacement between the lines that are each for a MP content: −20 g/kg DM (solid line with Δ), −10 g/kg DM (solid line with ○), 0 g/kg DM (blank solid line), +10 g/kg DM (solid line with ●), +20 g/kg DM (solid line with ▲). All variables are expressed relative to global mean values (6.7 MJ/kg DM, 100 g/kg DM) with average milk fat content of 36.8 g/kg. The root mean square error (RMSE) is indicated by the double-headed arrow.

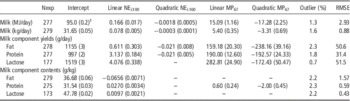
Responses of milk yield and milk composition to changes in dietary net energy for lactation (NEL) content (MJ/kg dry matter (DM)) and metabolizable protein (MP) content (g/kg DM)

Nexp=number of experimental groups; Outlier=observations with studentized residuals higher than 3 (or lower than −3); RMSE=root mean square error after adjusting for the effect of experiment.
The co-variables are mean centred on: NEL=6.7 MJ/kg DM, MP=100 g/kg DM
Models were chosen based on Akaike’s information criterion (see Material and methods section). All coefficients were significantly different from 0 at least at the level P<0.05.
These coefficients can be used to predict milk responses within the ranges of 5.9 to 7.6 MJ/kg DM for NEL and 73 to 121 g/kg DM for MP (means±2 SD), which reflect the current data set.
1 Standard errors of the coefficient are reported in parentheses.
Milk responses to change in net energy and metabolizable protein above maintenance supplies
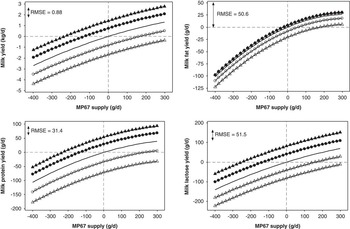
Table 4 shows the model coefficients obtained for milk yield, milk component yields and milk composition responses to change in NEL and MP above maintenance supplies. Predictions of average milk yield, milk fat yield, milk protein yield and milk lactose yield responses to change in NEL100 and MP67 supplies are illustrated in Figure 5. Yields of milk, milk protein and milk lactose were all increased curvilinearly with increasing MP67 supply. The relationships between milk yield and milk protein yield with NEL100 supply were also curvilinear, whereas it was linear for milk lactose yield. For milk fat yield, the response to changes in both MP67 and NEL100 supplies were curvilinear. There were no significant NEL100×MP67 interactions for any of the variables studied (Figure 5). The RMSE of responses in yield were smaller (27% in average) when using dietary supply above maintenance in the models compared with models based only on dietary content. In contrast, the responses obtained for milk fat, protein and lactose contents were not notably improved (RMSE 3% lower in average). The global MP efficiency is defined as the ratio between milk protein yield and MP above maintenance supply, whereas the marginal MP efficiency is the slope of the relationship between milk protein yield and MP above maintenance supply (i.e. per unit extra MP supply). Assuming reference energy level of NEL100=0, the global MP efficiency decreased from 82%, 67% to 58% for levels of MP67 of −400, 0 and 300 g/day. For the same levels of MP67, the marginal MP efficiency decreased linearly from 34%, 19% to 7%. In comparison the slope of the response was higher for milk lactose yield with marginal efficiency of 42%, 28% and 18% at MP67 of −400, 0 and 300 g/day. The slope coefficient for milk energy yield suggests that at NEL100=0, only 16.6% of extra NEL supply is partitioned into milk. This value is very consistent with the sum of the linear responses of fat, protein and lactose interpreted in term of energy. At NEL100=0 MJ/day, the marginal response (MJ/MJ, %) to NEL100 was largest for protein (7.5%), followed by lactose (6.9%) and fat (2.4%). The significant quadratic term for the effect of NEL100 supply on milk energy yield was mainly driven by the milk fat yield response. The marginal energy efficiency (MJ/MJ, %) decreases from 23.8% to 9.4% when NEL100 change from −20 to 20 MJ/day. Milk fat and lactose contents were not affected by MP67 supply and are therefore only predicted by NEL100 supply. In the case of milk protein content, it was significantly increased in a curvilinear manner by MP67 supply (Table 4).
Prediction of average milk yield and milk component yields responses to change in MP67 supply (g/day) and to change in NEL100 supply (MJ/day). MP67=MP above maintenance supply centred on supply for which MP efficiency is 0.67; NEL100=NEL above maintenance supply centred 006Fn supply for which the ratio of NEL in milk/NEL above maintenance is 1.00. Energy effects are shown by the vertical displacement between the lines that are each for a NEL100 supply: −20 MJ/day (solid line with Δ), −10 MJ/day (solid line with ○), 0 MJ/day (blank solid line), +10 MJ/day (solid line with ●), +20 MJ/day (solid line with ▲). Average milk yield, milk fat yield, milk protein yield and milk lactose yield were, respectively, 31.65 kg/day, 1155, 997 and 1519 g/day at MP67=0 g/day and NEL100=0 MJ/day. Root mean square error (RMSE) are indicated by double-headed arrows. MP=metabolizable protein; NEL=net energy for lactation.

Responses of milk yield and milk composition to changes in NEL100 supply (MJ/day) and MP67 supply (kg/day)

Nexp=number of experimental groups; Outlier=observations with studentized residuals >3 (or lower than −3); RMSE=root mean square error after adjusting for the effect of experiment; NEL100=NEL above maintenance supply centred on supply for which the ratio of NEL in milk/NEL above maintenance is 1.00; MP67=MP above maintenance supply centred on supply for which MP efficiency is 0.67.
The co-variables are mean centred on supplies for which NEL in milk/NEL above maintenance=1.00, Milk protein yield/MP above maintenance=0.67.
Interaction between NEL100 and MP67 was not significant for any of the variables studied.
Models were chosen based on Akaike’s information criterion (see Material and methods section). All coefficients were significantly different from 0 at least at the level P<0.05.
1 Standard errors of the coefficient are reported in parentheses.
Calculated energy balance
Calculated energy balance, hereafter referred as EB, is obtained by subtracting NEL requirements (maintenance and milk) from NEL supply (see Supplementary Material S2 for detail). So an inherent relationship between EB and NEL supply exists. However, quantifying the relationship between EB and both co-variables, NEL100 (MJ/day) and MP67 (kg/day), provides an insight on the change in energy status of the animal. The relationship was as follow: EB (MJ/day)=1.03 (0.02) NEL100+0.0021 (0.0006)
 $${\rm NE}_{{{\rm L}100}}^{2} $$
−18.13 (1.39) MP67+22.67 (2.70)
 $${\rm MP}_{{67}}^{2} $$
. The constant was not different from 0 (P=0.286) and was removed from the equation. At zero energy balance (or NEL in milk/NEL above maintenance=1), marginal EB response to change in NEL100 was 103%. This is six times greater than the marginal response of milk energy yield (17%). The sum of both marginal efficiency is different from 100% because of the different ME conversion used for NEL milk and NEL body reserves (see Supplementary Material S2 for further details). These coefficients indicate that extra energy is much more directed towards body reserves than it is exported into milk. Moreover, increasing NEL100 from −20 to 20 MJ/day increases the marginal EB efficiency from 94% to 111%. This is consistent with the decrease in marginal NEL efficiency for milk. With MP67, a negative curvilinear relationship is observed. Within the range of NEL100 (−20 to +20 MJ/day) and MP67 values (−400 to +300 g/day), the magnitude of the EB response with MP supply was much less than that with NEL supply (ca. 15 v. 41 MJ/day).
Discussion
The objectives of this meta-analysis have been met, with the derivation of empirical equations for response in DMI to change in diet content, and responses in milk yield and composition to change in dietary NEL and MP, both on concentration basis and supply basis. The large set of published experiments used, with treatments focussed on the changes in dietary energy and/or protein, enabled the development of equations with a satisfactory level of accuracy (Tables 3 and 4). As can be seen from the meta-designs (Figure 1), this study was successful in collecting data that covered a wide range of diet characteristics and therefore a large part of the plausible ranges of NEL and MP supplies that can be expected in practical situations. However, these equations predict average milk responses of multiparous (only 14% of the data were from primiparous cows) Holstein cows at mid lactation (50 to 200 DIM), milked twice a day. Accordingly, and in common with most of the published equations and models, the present equations should be used with caution outside of these conditions. The majority of the experiments (73.6%) were conducted using Latin square or change-over designs with an average period length of 26 (±12 SD) days. The rest of the experiments, using randomized block designs, had an average period length of 90±56 days. However, despite large differences in the duration of periods of the two main types of experimental design, no significant differences existed in SEM of independent variables. As an example, the average SEM for milk yield in Latin square and change-over designs was 1.08±0.68 kg/day compared with 1.05±0.59 kg/day in randomized block designs. Thus, no major differences in responses between the designs are expected. Further, Huhtanen and Hetta (Reference Huhtanen and Hetta2012) concluded that production responses to change in supply of nutrients were generally similar in studies conducted using continuous and change-over designs. Another potential disadvantage of meta-analysis of various feeding trials relates to between study differences in determination of feed values. In the present study, this effect was minimised by using a common digestive model to calculate standardized NEL and MP outputs from feed ingredients across all treatments. The within-experiment comparison between observed and predicted OMD, the major determinant of the energy value of feed and diets, showed no slope bias (for the subset reporting OMD). The same was true for CP flow to the duodenum. Thus, the common estimation method for NEL and MP did not bias the calculated milk responses.
Dry matter intake response
The calculated DMI response quantified the impact of both physical regulation, through FNDF content, and metabolic regulation through MP content. Similar to the finding of the present study, decreasing DMI with NDF or FNDF content has been widely reported in the literature (Mertens, Reference Mertens1985; Allen, Reference Allen2000). The DMI response to increase in MP was positive and curvilinear with a diminishing marginal response with higher MP content (Figure 2). A very similar response was found by Vérité and Delaby (Reference Vérité and Delaby2000) who summarized results from five studies including more than 30 treatments that explored different dietary MP contents. Although the DMI response developed in the current meta-analysis was based on the dietary MP content, it cannot be a priori concluded that this response is strictly the result of a metabolic regulation. As dietary CP and MP contents were positively related, this effect could also be partly explained through an improvement in rumen OMD (Allen, Reference Allen2000). In the 91 experiments (Nt=247; MP=96±11 g/day) from the MP sub-data set where measured OMD was relatively constant (<2% of absolute variation), the MP content relationship with DMI was still significantly positive (P<0.001, results not shown). This suggests that at least part of the positive DMI response to change in dietary MP occurs through metabolic effects. One hypothesis for this effect could be that the increase in milk yield generated by increasing MP content drives the increased DMI. In addition, a stimulating effect of dietary protein at metabolic level on intake has been previously observed in a duodenal infusion study using soya protein isolate as protein source (Faverdin et al., Reference Faverdin, M’Hamed and Vérité2003).
Milk responses
The curvilinear milk protein yield response found to change in either protein content or supply has also been found in other quantitative studies (Vérité and Delaby, Reference Vérité and Delaby2000; Brun-Lafleur et al., Reference Brun-Lafleur, Delaby, Husson and Faverdin2010; Huhtanen and Nousiainen, Reference Huhtanen and Nousiainen2012). At MP67=0 g/day, the marginal milk protein yield response to extra MP67 supply was 19%. As an estimation of body protein change is included in the calculation of MP above maintenance (see Supplementary Material S2 for full detail) the slope of 19% suggests that a large part of the extra nitrogen (N) coming from MP is excreted into urine. In a subset of 58 experiments (167 treatments) where urinary N excretion was measured, the slope of response of N excreted in urine to change in MP67 supply (obtained by within-experiment regression with MP67) was, in terms of CP, 81% (SE 12%). This number is very consistent with the marginal milk protein yield response, and confirms that a high amount of N provided through an increase in MP is lost in urine. Given this large proportion of deaminated MP, extra MP supply increases the amount of carbon chains available for the animal. However, this increase in supply of glucose precursors does not seem to be the driven force behind the observed increased milk lactose yield (Lapierre et al., Reference Lapierre, Galindo, Lemosquet, Ortigues-Marty, Doepel and Ouellet2010) and more research is needed to understand the relationship between protein supply and milk lactose. The partition of NEL shifted from milk to body reserves with increasing NEL above maintenance supply. In agreement with our study, curvilinear milk yield and energy-corrected milk responses to, respectively, ME and NEL were reported in the meta-analyses of Huhtanen and Nousiainen (Reference Huhtanen and Nousiainen2012) and Jensen et al. (Reference Jensen, Østergaard, Schei, Bertilsson and Weisbjerg2015). Increased MP supply may increase the partition of energy towards milk because it was associated with a small, but significant, decrease in EB, as previously reported (Ørskov et al., Reference Ørskov, Reid and Tait1987; Law et al., Reference Law, Young, Patterson, Kilpatrick, Wylie and Mayne2009; Brun-Lafleur et al., Reference Brun-Lafleur, Delaby, Husson and Faverdin2010).
A key question with respect to milk responses relates to the presence or not of interactions between NEL and MP supply. Contrasting results have been reported, finding either an interaction between energy and protein (Cowan et al., Reference Cowan, Reid, Greenhalgh and Tait1981; Brun-Lafleur et al., Reference Brun-Lafleur, Delaby, Husson and Faverdin2010) or additive effects of energy and protein (Macleod et al., Reference Macleod, Grieve, McMillan and Smith1984; Broderick, Reference Broderick2003; Rius et al., Reference Rius, McGilliard, Umberger and Hanigan2010; Huhtanen and Nousiainen, Reference Huhtanen and Nousiainen2012; Alstrup et al., Reference Alstrup, Weisbjerg, Hymøller, Larsen, Lund and Nielsen2014) on milk yield. The present meta-analysis did not confirm the interaction between NEL supply and MP supply found in the experiment of Brun-Lafleur et al. (Reference Brun-Lafleur, Delaby, Husson and Faverdin2010), which was specifically designed to reveal such interaction. This difference could potentially be due to the fact that, in our case, co-variables were expressed relative to reference efficiencies whereas Brun-Lafleur expressed MP and NEL supplies relative to a central treatment. In addition, in the study of Brun-Lafleur et al. (Reference Brun-Lafleur, Delaby, Husson and Faverdin2010), DMI was restricted whereas in the present meta-analysis, DMI was ad libitum. The role of DMI can be seen by comparing, in the present study, the results for NEL and MP supplies (that implicitly include DMI), where there was no interaction, with the results for dietary concentrations of NEL and MP, which showed significant interactions between NEL×MP for milk yield, milk lactose yield, milk protein yield and milk protein content. Although no interaction was found between NEL and MP content on DMI itself, a positive dietary NEL×MP content interaction (P=0.018) was found for NEL intake (results not shown). This interaction could explain these differences between the effects of content as compared with supply. However, due to correlated effects between NEL and MP supply (adjusted R 2=0.42), care is needed in the interpretation of the absence of interaction found. One possible way to reduce this correlation is to select the experiments which have a low variation in DMI. A sub-data set of 91 experiments comprising 242 treatments means (~29% of the total data set) had on average, a maximum difference between highest and lowest DMI of 0.47±0.24 kg/day. The average and standard deviation of independent variables on this sub-group were MP67=−62±189 g/day NEL100=1.76±12.97 MJ/day, which covers a large range of variation. In this sub-group the correlation between NEL supply and MP supply was low as assessed by an adjusted R 2 of 0.13. Despite the absence of correlation between independent variables, the interaction between NEL supply and MP supply was still not significant (results not shown). This strengthens our results found of additive effect between NEL and MP supply. Therefore, considering the majority of the results, it seems that in an ad libitum situation, the effect of energy and protein supplies on milk component productions can be considered as additive.
Milk component yield response equations calculated from NEL and MP supplies had RMSE values lower than the average SEM reported in the literature (see Results section and Table 4). Thus, the equations are sufficiently accurate in describing the multiple responses of dairy cows to change in NEL and MP supplies. Given that the higher energetic values in our study were achieved largely by an increase of starch : NDF ratio, the prediction equations developed may not be applicable to estimate milk fat content responses when the NEL increase is achieved by fat supplementation (Van Knegsel et al., Reference van Knegsel, van den Brand, Dijkstra, van Straalen, Heetkamp, Tamminga and Kemp2007). Further, milk fat content response is affected by a great number of others factors (Bauman and Griinari, Reference Bauman and Griinari2003) not accounted for in our model.
Conclusion
This meta-analysis has produced empirical equations for response in DMI to changes in FNDF and MP contents, and for responses in milk (yield, component yields and composition) to changes in dietary NEL and MP, both on concentration basis and on a supply basis. Those equations were obtained from standardized dietary NEL and MP contents across all treatments by using a common digestive model. Effects of NEL and MP supplies were additive for all milk component yield responses. Finally, the developed equations accurately describe milk responses over a wide range of dietary NEL (5.9 to 7.6 MJ/kg DM) and MP contents (73 to 121 g/kg DM).
Acknowledgements
The authors wish to thank Philippe Faverdin and Luc Delaby for valuable discussions on the different aspects covered in this text.
Supplementary Material
To view supplementary material for this article, please visit http://dx.doi.org/10.1017/S1751731116001245