1 Introduction
The determination of the drag force on a moving object is a central question in turbulence research and is the main goal of aerodynamics. A characteristic feature of turbulent flows is the ‘dissipation anomaly’: the drag force becomes independent of the fluid viscosity when the latter is low enough (Frisch Reference Frisch1995). A simple experiment to highlight this behaviour consists of spinning an impeller of radius
 $R$
and height
 $h$
at a constant angular velocity
 ${\it\omega}$
inside a tank filled with fluid of density
 ${\it\rho}$
and kinematic viscosity
 ${\it\nu}$
: when the Reynolds number
 $Re=R^{2}{\it\omega}/{\it\nu}$
is large enough, the torque
 ${\it\Gamma}$
required to drive the impeller follows the
 ${\it\nu}$
-independent scaling
 ${\it\Gamma}=K{\it\rho}R^{4}h{\it\omega}^{2}$
, where the dimensionless drag coefficient
 $K$
depends only on the shape of the impeller.
Here, we consider the effect of global rotation at constant rate
 ${\it\Omega}$
on this fundamental experiment: how does the drag coefficient depend on the Rossby number
 $Ro={\it\omega}/{\it\Omega}$
? Global rotation is encountered in many industrial, geophysical and astrophysical flows. Rotating turbulence has therefore been studied intensively using experimental, theoretical and numerical tools (Davidson Reference Davidson2013; Godeferd & Moisy Reference Godeferd and Moisy2015). For strong global rotation, the behaviour of rotating turbulent flows may be summarized as follows: the large-scale flow structures tend to become invariant along the global rotation axis, in qualitative agreement with the Taylor–Proudman theorem (Greenspan Reference Greenspan1968), while the remaining vertically dependent fluctuations can be described in terms of inertial waves that interact nonlinearly, together and with the 2D flow (Campagne et al.
Reference Campagne, Gallet, Moisy and Cortet2014, Reference Campagne, Gallet, Moisy and Cortet2015; Clark di Leoni et al.
Reference Clark di Leoni, Cobelli, Mininni, Dmitruk and Matthaeus2014; Yarom & Sharon Reference Yarom and Sharon2014; Alexakis Reference Alexakis2015). Rotating turbulence is therefore intermediate between 2D and 3D turbulence; one naturally wonders how its energy dissipation rate compares with the laminar dissipation of 2D turbulence, or with the dissipation anomaly of 3D turbulence (Baqui & Davidson Reference Baqui and Davidson2015).
The experiment considered here probes the influence of global rotation on turbulent dissipation directly. Indeed, torque measurements give access to the drag coefficient:
 $$\begin{eqnarray}K={\it\Gamma}/({\it\rho}R^{4}h{\it\omega}^{2}),\end{eqnarray}$$
i.e. to the normalized energy dissipation rate. We report on the behaviour of
 $K$
as a function of the Rossby number
 $Ro$
, in the fully turbulent regime where
 $K$
is independent of
 $Re$
, for a rotation axis of the impeller either parallel or perpendicular to the global rotation axis.
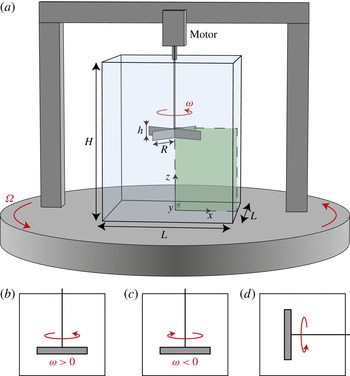
Experimental set-up. We measure the mean torque
 ${\it\Gamma}$
developed by the motor driving an impeller at a constant rotation rate
 ${\it\omega}$
in a water-filled tank mounted on a platform rotating at a rate
 ${\it\Omega}$
(
 $L=45~\text{cm}$
,
 $H=55~\text{cm}$
,
 $R=12~\text{cm}$
,
 $h=3.2~\text{cm}$
). In (a–c), the platform and the impeller rotate around the same axis (in the laboratory frame, the impeller spins at a rate
 ${\it\omega}+{\it\Omega}$
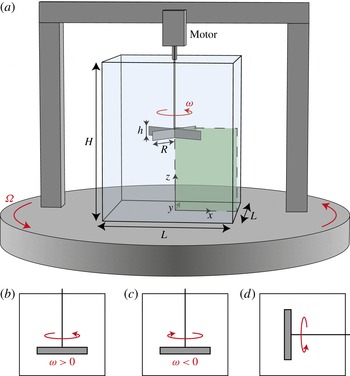
). Particle image velocimetry (PIV) measurements are performed in a vertical plane (green shaded region). In (d), the axis of the impeller is perpendicular to the global rotation axis of the platform. (b) Cyclonic, (c) anticyclonic, (d) horizontal axis.
2 Experimental set-up
The experimental set-up is sketched in figure 1(a). It consists of a parallelepipedic water-filled tank of height
 $H=55~\text{cm}$
and square base of side
 $L=45~\text{cm}$
. A brushless servo motor drives a four-rectangular-blade impeller of radius
 $R=12~\text{cm}$
and height
 $h=3.2~\text{cm}$
at a constant angular velocity
 ${\it\omega}$
of between 20 and 400 r.p.m. The tank and the motor are mounted on a 2 m-diameter platform rotating at a constant rate
 ${\it\Omega}>0$
of up to
 $30~\text{r.p.m.}$
around the vertical axis. For each set of parameters
 $({\it\omega},{\it\Omega})$
we measure the time-averaged torque
 ${\it\Gamma}$
developed by the motor driving the impeller. The maximum applied torque is
 ${\it\Gamma}_{m}=5~\text{N}~\text{m}$
. We subtract the non-hydrodynamic torque determined for each value of
 ${\it\omega}$
by repeating the measurement using air instead of water. This non-hydrodynamic torque includes losses in the motor and in the o-ring seal through which the shaft enters the tank. It is determined with a precision of
 ${\rm\Delta}{\it\Gamma}=50~\text{mN}~\text{m}$
, allowing us to span a range of two orders of magnitude in hydrodynamic torque.
Two configurations are considered. In the first configuration, the impeller rotates around the vertical axis, either cyclonically (
 ${\it\omega}>0$
, figure 1
b) or anticyclonically (
 ${\it\omega}<0$
, figure 1
c); in the second configuration, the impeller rotates around a horizontal axis in the rotating frame (figure 1
d). These configurations allow us to examine the two physically relevant situations of a driving velocity either normal or parallel to the global rotation axis. The vertical-axis configuration (figure 1
b,c) bears some similarities with the Taylor–Couette flow between rotating cylinders, the key difference being that the flow is driven inertially: the Taylor–Couette geometry is well suited to studying the effect of global rotation on viscous friction near a smooth wall, while our experiment considers the turbulent drag due to the inertially driven flow.
3 Drag measurements
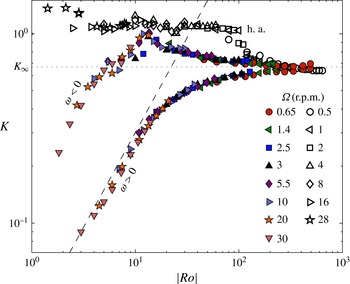
We first focus on the vertical-axis configuration. Figure 2 shows the drag coefficient (1.1) as a function of the Rossby number
 $|Ro|=|{\it\omega}|/{\it\Omega}$
. Denoting as
 $\boldsymbol{u}$
the velocity field, the drag coefficient
 $K$
is related to the spatial distribution of the energy dissipation rate per unit mass
 ${\it\epsilon}(\boldsymbol{x})={\it\nu}\langle |\boldsymbol{{\rm\nabla}}\boldsymbol{u}|^{2}\rangle _{t}$
through the balance between input and dissipated power:
 ${\it\Gamma}{\it\omega}={\it\rho}V\langle {\it\epsilon}\rangle _{\boldsymbol{x}}$
, where
 $\langle \,\rangle _{t}$
denotes a time average and
 $\langle \,\rangle _{\boldsymbol{x}}$
the space average over the volume
 $V=L^{2}H$
of the tank. In the absence of global rotation, because of the large Reynolds number of the flow (
 $Re=6.4\times 10^{4}$
–
 $6.7\times 10^{5}$
), the drag coefficient is independent of
 $Re$
,
 $K_{\infty }=0.67\pm 0.02$
, in agreement with the fully turbulent scaling law
 ${\it\epsilon}\sim R^{3}{\it\omega}^{3}/h$
. For non-zero global rotation
 ${\it\Omega}>0$
, the drag coefficient remains independent of
 $Re$
, but it is now a function of the Rossby number: the high-
 $Re$
data for
 ${\it\Gamma}({\it\omega},{\it\Omega})$
collapse onto two master branches when plotted as
 $K$
versus
 $|Ro|$
, a cyclonic branch for
 ${\it\omega}>0$
and an anticyclonic branch for
 ${\it\omega}<0$
.
The drag coefficient
 $K={\it\Gamma}/{\it\rho}R^{4}h{\it\omega}^{2}$
as a function of the Rossby number
 $|Ro|=|{\it\omega}|/{\it\Omega}$
. The coloured symbols are for the vertical-axis configuration, cyclonic and anticyclonic (figure 1
b,c), and the open symbols are for the horizontal-axis configuration (figure 1
d). The horizontal dotted line is the drag coefficient for fully developed turbulence without rotation,
 $K_{\infty }=0.67\pm 0.02$
. The tilted dashed line shows
 $K\propto Ro$
.

We first consider the high-
 $Ro$
part of figure 2. For weak global rotation (large
 $|Ro|$
), the two branches split symmetrically about
 $K_{\infty }$
, with drag reduction for cyclonic motion (
 $Ro>0$
) and drag enhancement for anticyclonic motion (
 $Ro<0$
). Such small departures from
 $K_{\infty }$
can be described through a regular expansion in
 $Ro^{-1}={\it\Omega}/{\it\omega}$
, assuming that the weak Coriolis force can be accounted for perturbatively: writing the velocity field as
 $\boldsymbol{u}=\boldsymbol{u}_{0}+Ro^{-1}\boldsymbol{u}_{1}+O(Ro^{-2})$
, where
 $\boldsymbol{u}_{0}$
is the flow without global rotation, leads to
 $\boldsymbol{u}_{1}|_{-{\it\Omega}}=\boldsymbol{u}_{1}|_{{\it\Omega}}$
. The mean energy dissipation rate per unit mass is
 $\langle {\it\epsilon}\rangle _{\boldsymbol{x}}={\it\nu}\langle |\boldsymbol{{\rm\nabla}}\boldsymbol{u}_{0}|^{2}\rangle _{\boldsymbol{x},t}+2{\it\nu}Ro^{-1}\langle \boldsymbol{{\rm\nabla}}\boldsymbol{u}_{0}\boldsymbol{\cdot }\boldsymbol{{\rm\nabla}}\boldsymbol{u}_{1}\rangle _{\boldsymbol{x},t}+O(Ro^{-2})$
, where
 $\langle \,\rangle _{\boldsymbol{x},t}$
denotes a space and time average, and
 ${\it\nu}\langle |\boldsymbol{{\rm\nabla}}\boldsymbol{u}_{0}|^{2}\rangle _{\boldsymbol{x},t}$
is the energy dissipation rate of the non-rotating flow. The drag coefficient becomes
 $$\begin{eqnarray}\frac{K}{K_{\infty }}=1+{\it\alpha}Ro^{-1}+O(Ro^{-2}),\quad \text{where }{\it\alpha}=2\frac{\langle \boldsymbol{{\rm\nabla}}\boldsymbol{u}_{0}\boldsymbol{\cdot }\boldsymbol{{\rm\nabla}}\boldsymbol{u}_{1}\rangle _{\boldsymbol{x},t}}{\langle |\boldsymbol{{\rm\nabla}}\boldsymbol{u}_{0}|^{2}\rangle _{\boldsymbol{x},t}}.\end{eqnarray}$$
The sign of
 ${\it\alpha}$
can be inferred from the fact that global rotation tends to reduce the velocity gradients along the rotation axis. In the laboratory frame, and for fixed
 ${\it\Omega}>0$
, the fluid spins faster for cyclonic rotation of the impeller (
 ${\it\omega}>0$
) than for anticyclonic rotation (
 ${\it\omega}<0$
). As a consequence, we expect lower vertical velocity gradients in the cyclonic case, i.e.
 ${\it\alpha}<0$
, implying consistently a negative correlation between the perturbed vertical derivative
 $\partial _{z}\boldsymbol{u}_{1}$
and
 $\partial _{z}\boldsymbol{u}_{0}$
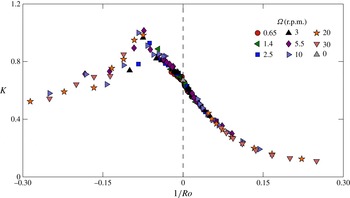
in (3.1). The data in figure 3 are in good agreement with this prediction: the departure of
 $K$
from
 $K_{\infty }$
is approximately linear in
 $Ro^{-1}$
for
 $Ro^{-1}\in [-0.07;0.07]$
, which corresponds to the range
 $|Ro|>15$
in figure 2.
The drag coefficient
 $K$
departs from
 $K_{\infty }$
approximately linearly in the inverse Rossby number
 $Ro^{-1}={\it\Omega}/{\it\omega}$
when the latter is small (same data as figure 2).

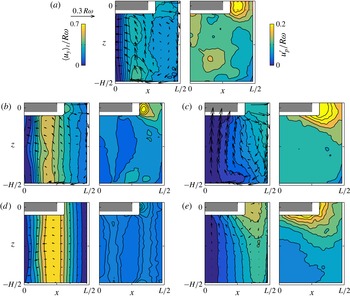
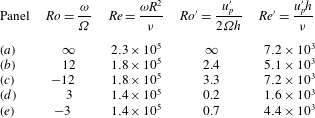
The time-averaged flow (left) and the r.m.s. fluctuations of the poloidal flow (right), measured by stereoscopic PIV in the frame of the rotating platform. In the left panels, the colour codes the toroidal (out-of-plane) velocity. (a) No background rotation (
 ${\it\omega}=150~\text{r.p.m.}$
,
 ${\it\Omega}=0,Ro=\infty$
). (b,d) Cyclonic background rotation (
 $Ro=12$
and 3). The two-dimensionalization results in a gradual weakening of the poloidal flow
 $\boldsymbol{u}_{\boldsymbol{p}}$
and a strengthening of the toroidal flow. At the largest global rotation (d), the fluid column below the impeller rotates rigidly at
 ${\it\omega}$
in the rotating frame, with weak turbulent fluctuations. (c,e) Anticyclonic background rotation (
 $Ro=-12$
and
 $-3$
). The peak dissipation at
 $Ro\simeq -12$
in figure 2 corresponds to the maximum poloidal recirculation and maximum turbulent fluctuations in the vicinity of the impeller (c).

We now discuss the regime
 $Ro\simeq 1$
, which is probably the most interesting one: the cyclonic branch of figure 2 displays a dramatic drop in the drag coefficient, with
 $K$
reaching values as low as 12 % of
 $K_{\infty }$
for the lowest Rossby numbers. This decrease in drag with increasing
 ${\it\Omega}$
follows the approximate scaling law
 $K\sim Ro$
. A similar, although less pronounced, decrease in the drag coefficient is observed for the anticyclonic branch. However, it is preceded by a dissipation peak at intermediate
 $Ro$
: a maximum dimensionless drag
 $K_{peak}\simeq 1.5K_{\infty }$
is achieved for
 $Ro_{peak}\simeq -12$
. Once again, this difference between the two branches can be related to the effective global rotation of the fluid: the dissipation peak corresponds to anticyclonic impeller motion
 ${\it\omega}<0$
partly compensating the rotation
 ${\it\Omega}>0$
of the platform, so that the fluid has minimum global rotation in the laboratory frame. A similar peak of dissipation has been reported for counter-rotating Taylor–Couette flow, and corresponds to optimal transport of angular momentum between the two cylinders (Dubrulle et al.
Reference Dubrulle, Dauchot, Daviaud, Longaretti, Richard and Zahn2005; Paoletti & Lathrop Reference Paoletti and Lathrop2011; Van Gils et al.
Reference Van Gils, Huisman, Bruggert, Sun and Lohse2011; Ostilla-Mónico et al.
Reference Ostilla-Mónico, Huisman, Jannink, Van Gils, Verzicco, Grossmann, Sun and Lohse2014). Such intermediate negative Rossby numbers also represent the most unstable configuration for vortices in rotating flows (Kloosterziel & Van Heijst Reference Kloosterziel and Van Heijst1991; Mutabazi, Normand & Wesfreid Reference Mutabazi, Normand and Wesfreid1992), which rapidly break down into highly dissipative 3D structures. The Taylor–Couette dissipation peak can then be traced back to strong instabilities driving dissipative 3D flow structures. In a similar fashion, the PIV measurements described in § 4 indicate that highly dissipative 3D flow structures are responsible for the dissipation peak of the present experiment (see figure 4
c).
How can we explain such a strong drag reduction for rapid global rotation? Two scenarios can be put forward. The first scenario relies on the modification of the energy transfers by the background rotation. In this approach, the velocity fluctuations are described in terms of propagating inertial waves, which disrupt the phase relation needed for efficient energy transfers (Cambon & Jacquin Reference Cambon and Jacquin1989). This scenario was first put forward in the context of magnetohydrodynamic turbulence (Iroshnikov Reference Iroshnikov1964; Kraichnan Reference Kraichnan1965), and later applied to rapidly rotating turbulence (Zhou Reference Zhou1995; Smith, Chasnov & Waleffe Reference Smith, Chasnov and Waleffe1996). It predicts reduced energy transfers
 ${\it\epsilon}\simeq {\it\epsilon}_{\infty }Ro^{\prime }$
in the limit
 $Ro^{\prime }\ll 1$
, where
 ${\it\epsilon}_{\infty }\simeq u^{\prime 3}/\ell$
is the usual (non-rotating) dissipation rate constructed on the turbulent velocity
 $u^{\prime }$
and the energy-containing size
 $\ell$
, and
 $Ro^{\prime }=u^{\prime }/2{\it\Omega}\ell$
is the turbulent Rossby number. This result, which relies on dimensional analysis, can be made more quantitative in the framework of wave-turbulence theory (Galtier Reference Galtier2003; Cambon, Rubinstein & Godeferd Reference Cambon, Rubinstein and Godeferd2004; Nazarenko Reference Nazarenko2011). Even though the latter theory is valid for
 $Ro^{\prime }\ll 1$
only (to be compared with the lowest value
 $Ro^{\prime }\simeq 0.2$
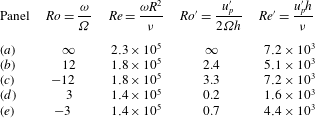
of the present study, see table 1), the scaling law
 $K\sim Ro$
reported in figure 2 turns out to be in agreement with this prediction, if one assumes that
 $u^{\prime }\sim R{\it\omega}$
holds regardless of
 $Ro$
.
Another explanation for the decrease in the drag coefficient is partial two-dimensionalization. Indeed, the forcing geometry in the vertical-axis configuration (figure 1
b,c) is compatible with the Taylor–Proudman theorem, which predicts for low
 $Ro$
a purely 2D vertically invariant solution corresponding to solid-body rotation in the cylinder tangent to the impeller, at angular velocity
 ${\it\omega}$
in the rotating frame of the platform. This solution is valid for a perfect fluid only, which slips on the top and bottom boundaries. For a realistic viscous fluid, additional boundary layers and poloidal recirculations develop and coexist with the solid-body motion (Hide & Titman Reference Hide and Titman1967; Greenspan Reference Greenspan1968). As a matter of fact, for periodic boundary conditions and idealized vertically invariant forcing, it was recently proven that the high-
 $Re$
flow settles in a purely 2D state for low enough Rossby number (Gallet Reference Gallet2015). For the experiment at stake here, the rapidly rotating flow can be thought of as a coexistence of this 2D asymptotic flow, together with weak 3D turbulent fluctuations, the intensity of which decreases as the global rotation increases. The 2D flow dissipates very little energy, at a laminar rate, typically proportional to the viscosity. Accordingly, the energy dissipation is due to the 3D flow structures, the intensity of which decreases for decreasing
 $Ro$
. We therefore expect a decrease in the energy dissipation, and therefore in the drag coefficient, for increasing global rotation rate.
4 Turbulent flow structure
To discriminate between the inertial-wave scenario and the partial two-dimensionalization one, we measure the velocity field using a stereoscopic PIV system mounted on the rotating platform. The field of view is vertical, illuminated by a laser sheet containing the axis of the impeller, and represents one quarter of the tank section, below the impeller (see figure 1 a). Stereoscopic PIV measurements are achieved by two high-resolution cameras aimed at the measurement plane at an incidence angle of 45°, at a frame rate of 5 Hz.
In figure 4, we show the mean velocity field and the standard deviation
 $u_{p}^{\prime }(x,z)$
of the poloidal velocity with and without global rotation. The non-rotating mean flow corresponds to a toroidal (out-of-plane) flow driven by the impeller, together with a strong poloidal (in-plane) recirculation. The flow displays 3D turbulence, the intensity of which is maximum at the edge of the impeller blades. In table 1, we provide values of the turbulent Reynolds and Rossby numbers based on the r.m.s. poloidal velocity in this flow region (red-dashed domain in figure 4
a).
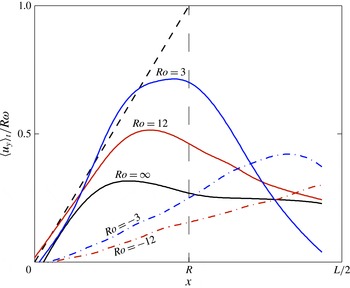
The mean azimuthal (out-of-plane) velocity profile
 $\langle u_{y}\rangle _{t}$
, measured 200 mm below the impeller (
 $z/H=-0.36$
), showing the strong two-dimensionalization of the flow for cyclonic background rotation (
 $Ro>0$
). The dashed line shows the Taylor–Proudman prediction
 $\langle u_{y}\rangle _{t}={\it\omega}x$
(solid-body rotation at angular velocity
 ${\it\omega}$
in the rotating frame).

The non-rotating flow contrasts strongly with the rapidly rotating one measured for cyclonic impeller motion: in line with the Taylor–Proudman theorem, the mean toroidal flow gradually tends to solid-body rotation at frequency
 ${\it\omega}$
inside the tangential cylinder, while the mean poloidal recirculation weakens as
 ${\it\Omega}$
increases. This two-dimensionalization is clearly visible in figure 5, which shows the mean azimuthal velocity profile well below the impeller (
 $z/H=-0.36$
). Another consequence of the Taylor–Proudman theorem is a strong decrease of the 3D turbulent fluctuations for decreasing Rossby number, as can be seen in the right-hand panels of figure 4(b,d): in the vicinity of the blades, i.e. inside the red-dashed domain sketched in figure 4(a), both the poloidal and the toroidal r.m.s. velocities strongly decrease for decreasing Rossby number (we show only the former), the ratio of the two being approximately 1.2 regardless of
 $Ro$
.
The anticyclonic case is different: for intermediate global rotation (
 $Ro=-12$
, figure 4
c), the mean flow displays minimum toroidal component and maximum poloidal recirculation, and the 3D turbulent structures in the vicinity of the impeller have maximum intensity. This situation corresponds to the dissipation peak in figure 2. However, as the global rotation is further increased (
 $Ro=-3$
, figure 4
e), the measured flows once again follow the Taylor–Proudman phenomenology, with stronger toroidal mean flow and reduced mean and fluctuating poloidal velocities (although the flow remains further from the 2D state than for cyclonic impeller motion).
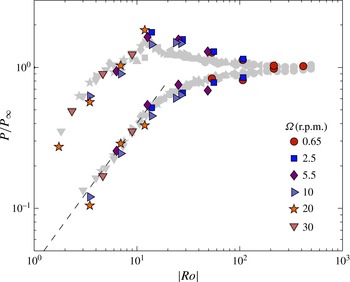
The dissipated power
 $P$
, estimated by the turbulent fluctuations
 $u_{p}^{\prime }$
of the poloidal flow measured through stereoscopic PIV, using the non-rotating estimate
 $u_{p}^{\prime 3}/h$
, and normalized by its non-rotating value
 $P_{\infty }$
. The good agreement between
 $P/P_{\infty }$
and the input power
 $K/K_{\infty }$
measured from torque data (data shown as faint symbols reproduced from figure 2) demonstrates that the non-rotating estimate
 $u_{p}^{\prime 3}/h$
correctly describes the energy dissipation rate, even in the rotating case.

On a qualitative level, these observations therefore support the partial two-dimensionalization scenario: most of the kinetic energy of the rapidly rotating flow corresponds to 2D
 $z$
-invariant motion, which is discarded at the outset of wave-turbulence theories. A quantitative criterion is, however, needed to distinguish more clearly between the two scenarios. To wit, we evaluate the energy dissipation rate of the turbulent poloidal flow directly from the PIV measurements: assuming that the energy-containing scale is given by the impeller height
 $h$
, the non-rotating estimate of this quantity is
 $u_{p}^{\prime 3}/h$
, whereas the wave-turbulence estimate is
 $u_{p}^{\prime 4}/{\it\Omega}h^{2}$
. We compute the spatial integral of the non-rotating estimate
 $u_{p}^{\prime 3}/h$
in the vicinity of the impeller, inside the dashed region shown in the right panel of figure 4(a). We denote as
 $P$
the resulting quantity, and report its behaviour with
 $Ro$
in figure 6. It matches remarkably the behaviour of
 $K$
, both curves being normalized by their asymptotic non-rotating value, with
 $K_{\infty }/P_{\infty }=0.6\pm 0.1$
. This good agreement confirms that the energy dissipation is mostly due to the 3D part of the flow, the laminar dissipation of the 2D flow being negligible. However, more importantly, for the moderate Rossby numbers studied here, it demonstrates that the energy dissipation can be estimated locally from the usual non-rotating scaling law
 $u_{p}^{\prime 3}/h$
, ruling out the modified energy dissipation
 $u_{p}^{\prime 4}/{\it\Omega}h^{2}$
predicted by weak-turbulence theory (such a non-rotating scaling law is also consistent with studies of grid-generated rotating turbulence (Hopfinger, Browand & Gagne Reference Hopfinger, Browand and Gagne1982; Staplehurst, Davidson & Dalziel Reference Staplehurst, Davidson and Dalziel2008; Moisy et al.
Reference Moisy, Morize, Rabaud and Sommeria2011), which have shown that the small-scale turbulent fluctuations start to develop some rotation-induced anisotropy for
 $Ro^{\prime }\lesssim 0.2$
only). The quantitative criterion illustrated in figure 6 allows us to clearly discriminate between the two scenarios, and we conclude that the drag reduction originates from a partial two-dimensionalization of the flow, with reduced 3D turbulent fluctuations.
5 Concluding remarks
The two-dimensionalization scenario for drag reduction is supported so far by the vertical-axis configuration (figure 1
b,c), which is compatible with the Taylor–Proudman theorem. What if the axis of the impeller is horizontal (see figure 1
d)? Such a configuration is incompatible with the Taylor–Proudman theorem: there is no vertically invariant flow solution compatible with the boundary conditions, even for a perfect fluid, because of the non-zero vertical velocity imposed by the impeller. This geometry therefore prohibits the partial two-dimensionalization scenario, while it still allows for the inertial-wave one. The vertical motion of the blades induces 3D turbulent velocity fluctuations of order
 $R{\it\omega}$
, regardless of
 $Ro$
. The usual non-rotating estimate for the energy dissipation rate then gives
 $R^{3}{\it\omega}^{3}/h$
, from which we predict no dependence of
 $K$
on
 $Ro$
, whereas the wave-turbulence prediction gives
 $R^{4}{\it\omega}^{4}/h^{2}{\it\Omega}$
, with a strong decrease in the drag coefficient
 $K\sim Ro$
for decreasing
 $Ro$
. Once again, the data in figure 2 clearly depart from the wave-turbulence prediction: for the moderate Rossby numbers considered here, there is no drop in the drag coefficient in this horizontal-axis configuration.
To conclude, we observe strong drag reduction whenever two-dimensionalization is allowed, i.e. when the forcing geometry is compatible with the Taylor–Proudman theorem: the drag coefficient is dramatically reduced for motion perpendicular to the global rotation axis, while it is very weakly affected for motion parallel to the global rotation axis. Importantly, for the moderate Rossby numbers considered here, the energy dissipation rate obeys the classical non-rotating scaling law, and not the wave-turbulence one. The decrease in drag is a consequence of a decrease in the 3D turbulence intensity, in line with the two-dimensionalization of the large-scale flow. It would be of great interest to achieve even faster global rotation, to determine how the flow approaches the asymptotic 2D state: is there a threshold
 $Ro$
under which the flow becomes exactly 2D (up to boundary layers), as in the stress-free case considered by Gallet (Reference Gallet2015), or is there a clear-cut scaling law governing the decrease in 3D energy as a function of
 $Ro$
?
Such experiments would also indicate how much further the drag can be reduced: for very fast global rotation, the decrease in bulk dissipation may be hidden by increasing Ekman friction in the boundary layers, which probably becomes the dominant cause of dissipation for large
 ${\it\Omega}$
. As a consequence, there would be an optimum rotation rate that leads to a minimum in drag.
Acknowledgements
We acknowledge S. Fauve for providing the fruitful seed idea, and A. Aubertin, L. Auffray, C. Borget and R. Pidoux for their experimental help. This work is supported by ‘Investissements d’Avenir’ LabEx PALM (ANR-10-LABX-0039-PALM). F.M. acknowledges the Institut Universitaire de France.