Introduction
Complex oxides exhibiting colossal dielectric behavior (ε’ > 103) are recognized as promising materials which can be used as miniaturized passive components for micro- and nanoelectronic capacitive elements with improved efficiency.[Reference Lunkenheimer, Krohns, Riegg, Ebbinghaus, Reller and Loidl1–Reference Krons, Lunkenheimer, Ebbinghause and Loidl5] Calcium copper titanate [CaCu3Ti4O12 (CCTO)], a non-ferroelectric material, whose unusual dielectric properties have been reported in 2000,[Reference Ramirez, Subramanian, Gardel, Blumberg, Li, Vogt and Shapiro2] attracts the attention due to its colossal dielectric constant (CDC) (ε’ > 105) observed both for ceramics and single crystals. Temperature stability of its dielectric properties is ensured by the absence of non-polar-to-polar transition (the latter complicates the explanation of CDC behavior). Theoretical and experimental data obtained during the last decade suggest that the extrinsic barrier mechanisms associated with the electric charge at the grain-to-grain boundaries,[Reference Sinclair and West3] depletion layers of Schottky contacts,[Reference Schmidt, Stennett, Hyatt, Pokorny, Prado-Gonjal, Li and Sinclair4, Reference Krons, Lunkenheimer, Ebbinghause and Loidl5] and/or plane defects[Reference Li, Shen, Nygren, Feteira, Sinclair and West6, Reference Whangbo and Subramanian7] play an important role in the appearance of the giant dielectric permittivity. The microscale barrier layer capacitance (MBLC) model proposed by Sinclair and West[Reference Sinclair and West3] suggests that insulating surfaces are formed on the CCTO semiconducting grains during sintering process. According to MBLC approach, CCTO microstructure can be compared with a brick layer structure, where two pathways for the electric current should be considered. Since grain boundaries are supposed to be much more resistive than grains, the MBLC model implies that the impedance response of CCTO polycrystalline samples can be represented by the following equation:
 $$Z = \displaystyle{{R_{\rm g}} \over {1 + j\omega R_{\rm g}C_{\rm g}}} + \displaystyle{{R_{{\rm gb}}} \over {1 + j\omega R_{{\rm gb}}C_{{\rm gb}}}},$$
where R g and R gb are the resistances of grains and grain boundaries, respectively, while C g and C gb are the capacitances of grains and grain boundaries. Meanwhile, the plane defect approach was significantly developed by Bueno et al.[Reference Bueno, Tararan, Parra, Joanni, Ramírez, Ribeiro, Longo and Varela8] The corresponding model takes into account the stacking faults appearing at the nanoscale level and acting as a series connection of internal barrier layer capacitors, thus underlying the existence of nanoscale barrier layer capacitance (NBLC) mechanism.[Reference Bueno, Tararan, Parra, Joanni, Ramírez, Ribeiro, Longo and Varela8] In this work, we use the contact and semicontact electrophysical modes of scanning probe microscopy (SPM) to present the experimental confirmation of the inhomogeneous conductivity in CCTO ceramics supporting the validity of the polaronic stacking fault defect approach.[Reference Bueno, Tararan, Parra, Joanni, Ramírez, Ribeiro, Longo and Varela8–Reference Fang and Liu10]
Experimental
The CCTO ceramics was fabricated by a solid-state reaction. The powders of CaCO3 [Fluka, 99% (Europe location in Bucharest, Romania)], TiO2 [Sigma-Aldrich, 99% (Sigma-Aldrich Quimica, S.L., Sintra, Portugal)] and CuO [Sigma-Aldrich, 99% (Sigma-Aldrich Quimica, S.L., Sintra, Portugal)] were mixed in a planetary mill (20 min, 200 rpm) to be calcinated at 900 °C for 12 h. The calcined powder was grinded and uniaxially pressed (1.2 tons, 5 min) to form a cylindrical pellet. The sintering was done at 1050 °C for 12 h. These conditions were chosen taking into consideration the previous study.[Reference Schmidt, Stennett, Hyatt, Pokorny, Prado-Gonjal, Li and Sinclair4, Reference Amaral, Rubinger, Valente, Costa and Moreira11] Sample polishing was carried out with abrasive papers and diamond pastes. At the last stage, the sample was thermally etched (1000 °C, 1 h).
X-ray diffraction (XRD) data were obtained using a Philips X'pert diffractometer with Cu Kα radiation to be treated by Le Bail et al.’s method[Reference Le Bail, Duroy and Fourquet12] (the FullProf software was used).[Reference Rodríguez-Carvajal13] Scanning electron microscopy (SEM) was performed using a Hitachi S4100-1 instrument equipped with an energy-dispersive x-ray spectroscopy (EDS) detector. Dielectric properties study was done over a wide (from 90 to 400 K) temperature range using an Agilent 4294A LCR meter. Surface morphology and local electrical properties were investigated using an NTEGRA Aura (NT-MDT SI) scanning probe microscope. Atomic force microscopy (AFM), electrostatic force microscopy (EFM), and spreading resistance (SR) AFM modes were used. A high setpoint level (1.5 times exceeding the value recommended for ceramic samples), a slow scanning rate (0.1 Hz), and stiff Pt/Ir-coated NSG30 (NT-MDT-SI) probes (320 kHz, 40 N/m) were chosen to provide a tight tip-surface contact during the SR-AFM measurements. Although the typical root-mean-square roughness for a 5 µm × 5 µm scan did not exceed 5 nm (Fig. S1), tip state was systematically checked by comparing the resonance frequency before and after scanning and by controlling the SR image decay (Fig. S2). The in-plane electrode configuration was used. The SPM scanner calibration was done at ambient conditions (T = 25 °C, humidity ~30%) using a calibration grid TGQ1 (NT-MDT SI).
Results and discussion
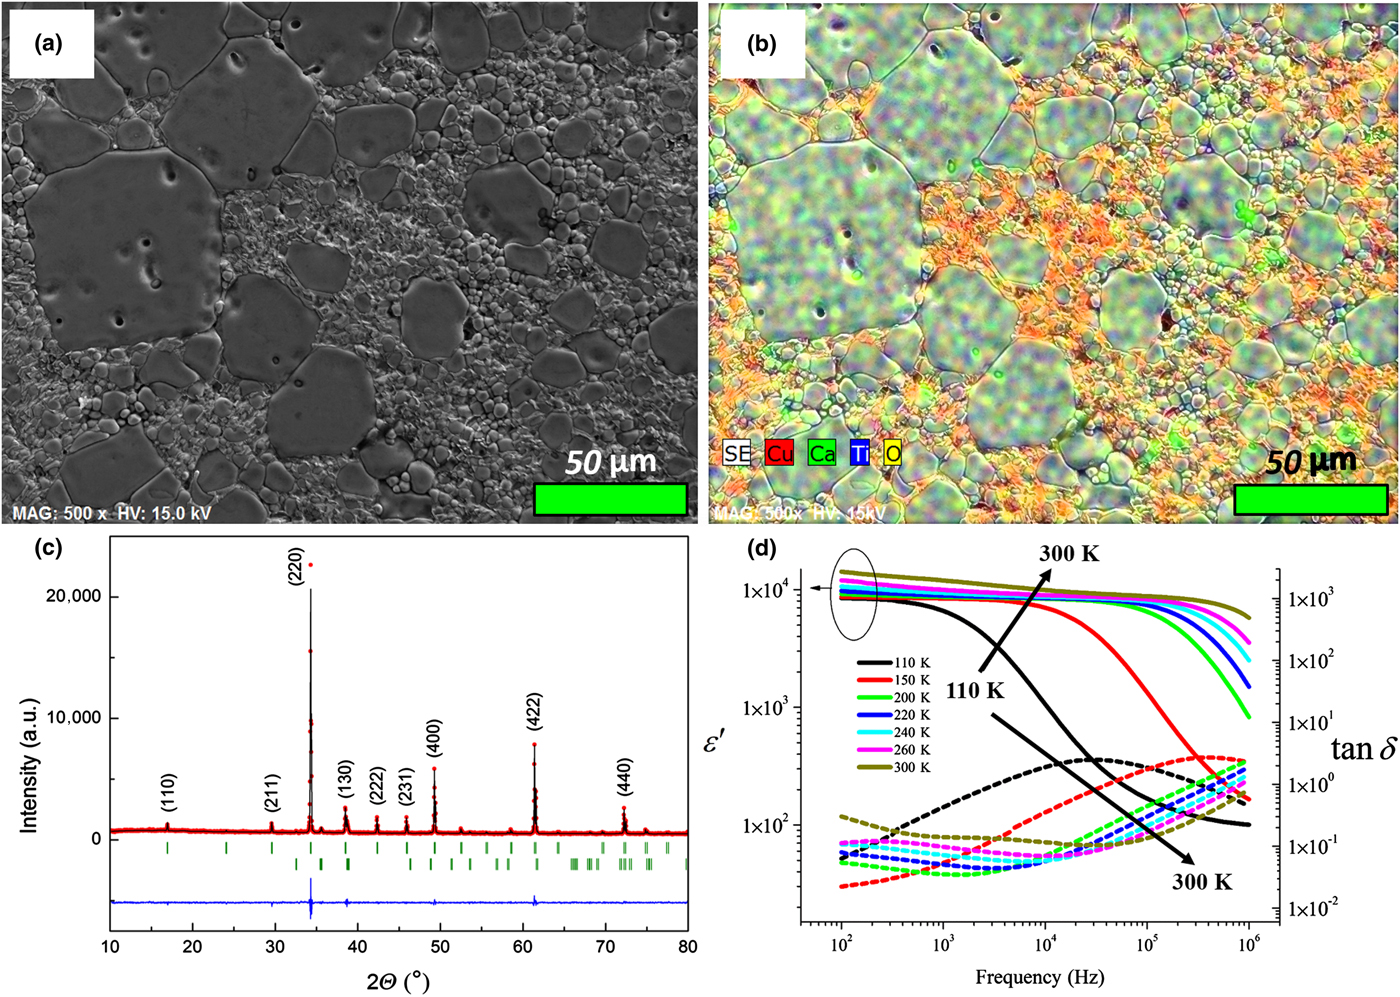
Figures 1(a) and 1(b) show a polished surface of the CCTO ceramics with a wide (ranging from 5 to 50 µm) grain size distribution. While EDS measurements reveal the coexistence of CCTO and CuO phases [Fig. 1(b)], XRD data confirm that CCTO is the major phase composing the sample [Fig. 1(c)]. Figure 1(d) shows the real part of dielectric permittivity and dielectric loss as a function of frequency illustrating the dielectric relaxation decay (ε′ decrease / ε′′ increase) with a shift of the tan δ maximum toward higher frequencies with increasing temperature. The Debye-like dielectric relaxation represents a static dielectric constant, ε s, reaching ~8000 at 90 K and increasing with temperature [Fig. 1(d)], while the high-frequency dielectric constant (ε ∞) is about 100, for all the temperature range. The values of ε s are high enough to consider the compound under study as a material possessing CDC behavior.[Reference Jonscher14] The relaxation process is thermally activated and the Arrhenius law can be used to calculate corresponding activation energy:
 $$f_{{\rm max}} = f_0e^{ - E_{\rm a}/(K_{\rm B}T)}.$$
Here, f max is the relaxation frequency, f 0 is the high-temperature relaxation frequency, and E a is the activation energy. The calculation yields the activation energy of about 100 ± 2 meV. The latter is close to the activation energies associated with the polaronic relaxation observed in perovskites.[Reference Bidault, Maglione, Actis, Kchikech and Salce15]
Secondary electron SEM (a) and corresponding EDS-SEM (b) mapping of CCTO sample. (c) Experimental (red circles), theoretical (black line), and difference (bottom blue line) XRD patterns for CCTO sample [a = 7.393(1) Å, S. G. Im  $\bar 3$]. Ticks correspond to the positions of allowed Bragg reflections for the main (upper row) and impurity (lower row) phases. (d) Frequency dependences of the real part of dielectric permittivity and dielectric loss (tan δ = ε’’/ε’) measured at different temperatures.

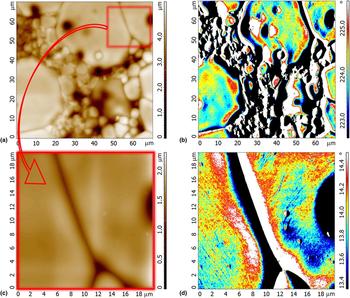
EFM scanning of the sample surface reveals a clear difference between CCTO grains/grain-to-grain boundaries and CCTO/CuO phases due to the difference in electrostatic response [Figs. 2(b) and 2(d)]. While EFM signal is affected by sample topography, the study unambiguously confirms the charge accumulation at the CCTO grain edges (where the bright contrast appears regardless the topography and direction of scanning) [Figs. 2(b) and 2(d)]. Within one grain, the EFM signal shows non-equipotential state of the grain surface indicating the presence of electrostatic scatters such as planar and point defects (oxygen vacancies and metal valence changes) which are supposed to be responsible for the electrical properties of CCTO[Reference Whangbo and Subramanian7–Reference Amaral, Rubinger, Valente, Costa and Moreira11] [Fig. 2(d)].
(a, c) Surface topography and (b, d) EFM scan images.

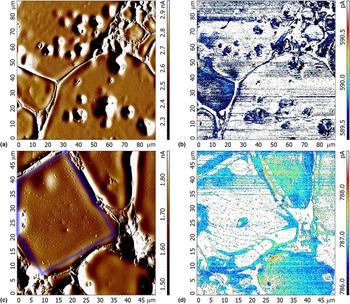
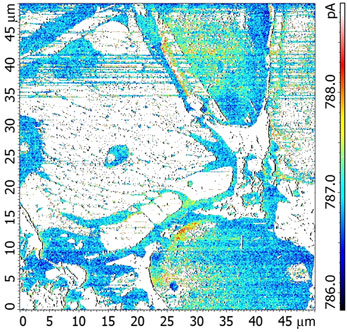
SR-mode imaging of the sample surface allowed the reasons of the anomalous dielectric behavior to be disclosed. The AFM scanning [Fig. 3(a)] reveals a wide distribution of grain size, thus supporting the results of the SEM measurements [Figs. 1(a) and 1(b)]. The topologic difference between grains and grain boundaries corresponds to that observed in the current distribution response [Figs. 3(b) and 3(d)]. The latter is consistent with the macroscale barrier layer capacitance mechanism of conductivity suggesting that the higher concentration of charge carriers can be found near insulating grain boundaries.[Reference Sinclair and West3, Reference Schmidt, Stennett, Hyatt, Pokorny, Prado-Gonjal, Li and Sinclair4] This mechanism (the creation of Schottky-type barriers acting as an association of micro-capacitors) is accepted to be the main reason of CDC observed in CCTO.[Reference Sinclair and West3–Reference Li, Shen, Nygren, Feteira, Sinclair and West6] In this work, we thus provide the evidence for the charge accumulation states near two CCTO grain boundaries and the insulating gap between them, as investigated experimentally at the microscale level [Figs. 3(b) and 3(d)]. The average width of the insulating gap between the grains and the mean current drop between the conductive and insulating states were found to be about 5 µm and 0.5 nA, respectively (the changes in resistivity were estimated by analyzing numerous grain-to-grain cross-sections at zero offset). Returning to Eq. (1) proposed by MBLC model, one can obtain a simple relation between the static dielectric constant (ε s) and dielectric constant for grain boundaries (ε gb)[Reference Sinclair and West3, Reference van Dijk and Burggraaf16]:
 $$\varepsilon _{\rm s} = \varepsilon _{{\rm gb}}\displaystyle{{d_{\rm g}} \over {d_{{\rm gb}}}}.$$
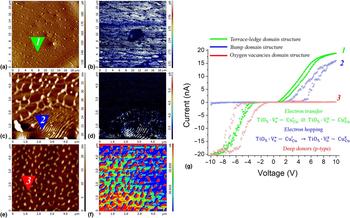
Here, d g and d gb represent the mean grain size and grain boundary thickness, respectively. Since the mean thickness of grain boundaries is close to 5 µm, the maximum d g/d gb ratio should not be higher than 10. Taking into account that, in a good approximation, ε gb is comparable with the high-frequency dielectric constant (ε ∞ ≈ 100), it becomes clear that MBLC model fails to explain the observed ε s values of ~104 [Fig. 1(d)]. Accordingly, we have to admit that MBLC is not a unique mechanism underlying CDC behavior in CCTO. The extra contribution should be originated from the existence of conductive/insulating areas inside CCTO grains [Fig. 3(d)]. A precise scanning of the grain highlighted by the blue square in Fig. 3(c) allowed the complex topography of CCTO grain and the corresponding SR response to become visible [Figs. 4(a) and 4(b)]. It is worth noting that two types of surface morphologies specific to CCTO ceramics have been previously revealed by electron microscopy.[Reference Fang and Shiau9, Reference Fang and Liu10] The formation of the terrace-ledge and bump-type domains has been shown to be associated with the spiral growth of crystals via a screw dislocation. Figures 4(a) and 4(c) represent the confirmation for the coexistence of these types of morphologies via the contact AFM study. As seen from Figs. 3(b) and 3(d), the distribution of current is consistent with the topography and presents a clear mapping of the conductivity for different types of surface morphology. As follows from the scan image analysis, the terrace-ledge [Figs. 4(a) and 4(b)] and bump [Figs. 4(c) and 4(d)] domains are seen as an alternation of the gaps and barriers in morphology image corresponding to the insulating and conductive stripes in SR response. Being consistent with the approach proposed in Ref. Reference Li, Shen, Nygren, Feteira, Sinclair and West6 and developed in Refs. Reference Whangbo and Subramanian7 and Reference Bueno, Tararan, Parra, Joanni, Ramírez, Ribeiro, Longo and Varela8, the results support the structural model for planar defects, which links the observed CDC behavior with the existence of insulating gaps and conductive barriers associated with the slip planes and twin boundaries. Indeed, the ideal structural arrangement within a CCTO grain, when the CuO4 square planes containing Cu2+ ions share corners with the TiO6 octahedra containing Ti4+ ions, can be disrupted due to crystallographic twinning.[Reference Li, Shen, Nygren, Feteira, Sinclair and West6–Reference Bueno, Tararan, Parra, Joanni, Ramírez, Ribeiro, Longo and Varela8] This may create the planar defects making the Cu and Ti environment conductive by accommodating Cu+ and Ti3+. According to Ref. Reference Bueno, Tararan, Parra, Joanni, Ramírez, Ribeiro, Longo and Varela8, the negatively charged TiO5 clusters of the stacking fault substructure form a polaronic defect with adjacent Cu2+ atoms that are able to receive electrons through reduction to Cu+, thus resulting in the formations of alternated conductive and insulating regions [Figs. 4(a)–4(d)]. Simultaneously, insulating barrier associated with the oxygen vacancies accumulated in the defect plane due to the charge balance requirement is organized.[Reference Whangbo and Subramanian7–Reference Fang and Liu10] This consideration is supported by the SPM data [Figs. 4(e) and 4(f)] indicating that the related morphologic features seen in the AFM images can become visible in the SR mode only when applying a high negative DC bias voltage (−10 V) (Fig. S3). The current–voltage dependences obtained for the terrace-ledge, bump, and oxygen vacancies-enriched domains demonstrate the expected behavior previously characterized as follows: the semiconductor I–V dependence [curve 1 in Fig. 4(g)] is an electron transfer between Ti clusters and Cu ions across the stacking fault interface ( $\hbox{Ti}\hbox{O}_5 \cdot V_o^ \bullet - \hbox{Cu}_{{\rm Cu}}^{\rm ^{\prime}} \; \rlarr {\rm Ti}\hbox{O}_5 \cdot V_o^x - \hbox{Cu}_{{\rm Cu}}^x $), the n-type semiconductor I–V dependence [curve 2 in Fig. 4(g)] is an electron hopping between Ti clusters and Cu ions across the stacking fault interface (
 $\hbox{Ti}\hbox{O}_5 \cdot V_o^ \bullet - \hbox{Cu}_{{\rm Cu}}^{\rm ^{\prime}} \; \to \; \hbox{Ti}\hbox{O}_5 \cdot V_o^x - \hbox{Cu}_{{\rm Cu}}^x $), the p-type semiconductor I−V dependence [curve 3 in Fig. 4(g)] is the deep donors-like response of oxygen vacancies accommodated in the TiO5 local cluster substructure.[Reference Whangbo and Subramanian7–Reference Fang and Liu10] The observed hysteresis should be linked with the diode-like rectifying behavior partly affected by the Schottky mechanisms due to the Pt/Ir-coated probe used. Thus, our local I (V) measurements fully affirm the predictions given for the different types of morphologic structures described in Refs. Reference Whangbo and Subramanian7–Reference Fang and Liu10.
(a, c) Surface morphology (presented via standard deflection signal) and (b, d) SR scan images illustrating MBLC (b) and NBLC (d) mechanisms. The measurements were performed at 0.1 Hz (512 × 512 pixels) and DC bias voltage of 1 V.

(a, c, e) Surface morphology [presented via standard deflection (a) or height (c, e) signals] and (b, d, f) SR scan images illustrating (a, b) terrace-ledge (marked as 1), (c, d) bump (marked as 2), and (e, f) oxygen vacancies-enriched (marked as 3) domains. The artificial change in the contrast forming the left-side “shadows” (f) is due to a sample slope. The measurements were performed at 0.1 Hz (512 × 512 pixels) and DC bias voltage of 1 V for (b, d) and −10 V for (f). (g) The characteristic current–voltage dependences obtained at the points 1, 2, and 3.

Similar to barrier-layer class capacitors, the CCTO structure, at a microscale level, can be considered as a combination of conductive grains and insulating grain boundaries that oxidize during annealing process (MBLC mechanism). Along with the MBLC mechanism, a nanoscale intercalation of conductive and insulating layers has been detected (NBLC mechanism). While the conductive pathways described in the current work are associated with NBLC mechanism, MBLC should ensure insulating behavior. Indeed, it is recognized that one of the main drawbacks of single-crystal CCTO, considering its future application as a CDC material, is its large dielectric loss (tan δ), which is an intrinsic consequence of the high conductivity (associated with NBLC mechanism), in particular at high temperatures.[Reference Amaral, Costa, Valente, Fernandes, Franco, Alves and Costa17] Meanwhile, several experimental studies report on the existence of CCTO-based compositions resulting from the substitution of Ca and Cu by co-doping, where tan δ lower than 0.05 was achieved.[Reference Du, Wei, Li and Chen18] The results presented in the current work disclose the possibility to control the dielectric losses in single-crystal CCTO taking into account the NBLC contribution.
To sum up, we showed the efficiency of SPM method in seeking for the main mechanisms responsible for CDC behavior observed in CCTO. The local conductivity measurements confirm the existence of two main contributions underlying the appearance of the colossal dielectric permittivity. There is a macroscale mechanism associated with the potential grain-to-grain barriers (MBLC) and a nanoscale mechanism attributed to the potential barriers created by structural defects (NBLC). The results pave the way to the general understanding of the anomalous dielectric properties of CCTO and related materials.
Supplementary material
The supplementary material for this article can be found at https://doi.org/10.1557/mrc.2018.151.
Acknowledgments
This work was partly supported by Fundação para a Ciência e a Tecnologia (FCT), through the projects UID/CTM/50025/2013 and UID/FIS/04564/2016, also co-funded by FEDER/COMPETE. M.S.I. and V.A.K. are grateful to the FCT for financial support through the projects CENTRO-01-0145-FEDER-000014 (MATIS) and IF/00819/2014/CP1223/CT0011. Access to TAIL-UC facility funded under QREN-Mais Centro project ICT_2009_02_012_1890 is acknowledged as well.