


Introduction
Deep ice cores contain a very detailed record of past climate, and of some of the environmental forcing factors for climate. This has been most vividly illustrated by the highly successful operations at Summit, Greenland (Reference Hammer, Mayewski, Peel and StiverHammer and others, 1997), which revealed 110 ka of Northern Hemisphere climate history. In the wake of the achievements at Summit, the European ice-core laboratories have initiated the European Project for Ice Coring in Antarctica (EPICA). This project, bringing together ice-core researchers from ten European countries, aims, in its first phase, to drill a bedrock ice core at Dome C, Antarctica, and to carry out reconnaissance leading to a second drilling site in the Dronning Maud Land region.
At Dome C, it is anticipated that one of the longest records the Antarctic ice sheet can offer will be available, with a useable time-span of at least 500 ka. The exact location of the proposed drill site, on top of the topographic dome, was established using geodetic, topographic and radar surveys (Reference Tabacco, Passerini, Corbelli and GormanTabacco and others, 1998). The location is 75°06’S, 123°24’E, and the elevation is 3233 m. The estimated ice thickness is 3250 ± 25 m (Reference Tabacco, Passerini, Corbelli and GormanTabacco and others, 1998). The drill site is about 65 km south of the site of a previous 950 m drilling (extending about 30 ka back in time) carried out in the late 1970s (Reference Lorius, Merlivat, Jouzel and PourchetLorius and others, 1979). The infrastructure for the new drilling was established in the 1996-97 field season, and the deep drilling began in earnest in 1997-98, reaching a depth of 363.5 m. Some analyses were carried out in the field on ice from 99 to 358.6 m.
Data from Dome C must be compared with less comprehensive data from previous major Antarctic deep drillings, particularly those at Vostok (Reference PetitPetit and others, 1997), Byrd (Reference Hammer, Clausen and LangwayHammer and others, 1994) and Dome Fuji (Dome-F Ice Core Research Group, 1998). In particular, it is important to establish a common time-scale between the different cores, so that contemporaneous events, on the one hand, and phase lags and leads, on the other, can be established. In this paper, we present the first data from the EPICA Dome C core: the electrical records measured in the field. The nature of these records is assessed, and we compare them with electrical records obtained previously from ice cores from Vostok. We can make a tentative match between the records, which enables us to calculate the relative accumulation rate between the two sites and suggest a preliminary date for the bottom of the core drilled so far. Finally, we suggest studies that could be carried out to confirm our initial matches.
Electrical Measurements at Dome C and Vostok
The EPICA drill retrieves cores that are 98 mm in diameter and up to about 4m long. These were cut to 2.2 m lengths before further processing. After equilibration to a temperature of-19±l°C, cores underwent two electrical analyses. Whole cores, without further sectioning, were analyzed by dielectric profiling (DEP) (Reference Moore, Mulvaney and ParenMoore and others, 1989; Reference Wolff, Moore, Clausen, Hammer, Kipfstuhl and FuhrerWolff and others, 1995). In the current version of the British Antarctic Survey DEP, cores were placed in a shielded box consisting of a continuous curved lower electrode and a curved top electrode that is segmented into 2 cm lengths. The lower electrode was connected to the high-voltage ("HI") side of an LCR meter (Hewlett-Packard HP4284A), and each top segment was connected in turn to the low-voltage ("LO") side. Each segment was switched in turn by a relay box, and both the relay box and LCR meter were controlled by a portable computer running Visual Basic. While each top electrode was connected, the other electrodes were earthed, and therefore acted as guards keeping the field parallel. Conductance and capacitance were measured at each electrode position (i.e. every 2 cm) at each of 21 frequencies between 20 Hz and 1 MHz. A number of dielectric parameters could be derived from these data, but we have used them to calculate σ∞ the high-frequency limit of the conductivity. In practice, the conductivity at 100 kHz is very close to (within 1-2% of) a^ and this is the value presented here. The data have been corrected to -15°C for direct comparison with previous data, using an activation energy of 4 8 kJ mol−1 (0.50 eV) for the pure-ice part of the conductivity, and 21 kj mol−1 for the part controlled by chemical content (Reference Wolff, Moore, Clausen, Hammer, Kipfstuhl and FuhrerWolff and others, 1995). Sections containing core breaks have in general not been removed from the DEP record presented, but are normally recognised easily as dips in the value of σ∞ below 9 MS m−1 (the expected value for pure ice).
Electrical conductivity measurement (EGM) is essentially a measure of d.c. conductivity that has traditionally been carried out by dragging a pair of electrodes with a high voltage between them along a core, and measuring the current between the electrodes (Reference HammerHammer, 1980; Reference Neftel, Andree, Schwander, Stauffer, Hammer, Langway, Oeschger and DansgaardNeftel and others, 1985). At Dome C, a new system, developed at the University of Bern, was used. The system will be described in detail elsewhere, but in brief, a flat surface was prepared along the 2.2 m length of a core using a horizontal band-saw and a milling device. The electrodes assembly consisted of seven electrodes at a spacing of 8 mm across the core. The electrodes were made of a carbon-doped silicon rubber. They were lowered onto the surface of the core, and 350 V was applied across each adjacent pair of electrodes in turn. The current between them was sampled at regular intervals after a settling time, and averaged. The electrodes were lifted and moved 1 mm along the core before the sequence was repeated. This procedure yielded six sets of data at 1 mm resolution. The data presented here are given as conductances averaged to 10 mm and corrected to -15°C. Documented major core breaks and ends have been removed from the EGM record.
On the Vostok cores (78°28’ S, 106°50’ E), ECM was carried out using a more traditional two-electrode system. The profile presented here is in fact a composite of data from three separate drillings: data from 200 m and deeper are available from core 5G; data were also obtained from two cores drilled 300 m distant from 5G in 1996, BH7 (100-236 m) and BH8 (9-130 m) (Reference BasileBasile, 1997). The Vostok data consist of currents measured every mm, but it should be emphasised that the magnitude of currents measured in ECM depends on the system used, and therefore no absolute comparison between Dome C and Vostok ECM data is possible.
Comparison of Dome C DEP and ECM Records
The many ECM profiles obtained over the years suggest that the ECM current responds only to the acidity of the ice (Reference HammerHammer, 1980; Reference Moore, Wolff, Clausen and HammerMoore and others, 1992; Reference Wolff, Miners, Moore and ParenWolff and others, 1997), although the identity of the associated anion may influence the strength of the response. A calibration would be required to derive the acidity in a quantitative way from the ECM data for the particular ECM system used at Dome G.
DEP σ∞, on the other hand, responds to acidity, ammonium and chloride (Reference Moore, Wolff, Clausen and HammerMoore and others, 1992, Reference Moore, Wolff, Clausen, Hammer, Legrand and Fuhrer1994; Reference Wolff, Miners, Moore and ParenWolff and others, 1997), and the electrode system used at Dome C has been calibrated, at least for Greenland ice. Previous measurements made on the Dome C core drilled in the late 1970s suggest that, for the Holocene period (the period covered by the core drilled so far in the EPICA drilling), ammonium averaged 0.04 μM (μmolL−1, ∼1 μg kg−1), while chloride was typically <1 μM (35 μg kg−1) (Reference Legrand and DelmasLegrand and Delmas, 1988). Acidity had background (outside volcanic peaks) values up to 2 MM. Based on these values and earlier calibrations, the contribution of ammonium and chloride to σv in the Holocene should be very small (generally <0.5 μS m−1), while background acidity could contribute as much as 8 μS m−1 (both these contributions would be superimposed on a pure-ice background expected to be about 9 μS m−1). In Holocene ice, DEP variability will therefore be dominated by acidity, and DEP and ECM should look very similar. In contrast, for the Last Glacial Maximum period, previous work (Reference Legrand and DelmasLegrand and Delmas, 1988) showed chloride levels up to 5 μM (which would give additional conductivities of 3 μS m−1), so chloride variability will likely cause significant differences between DEP and ECM for that period.
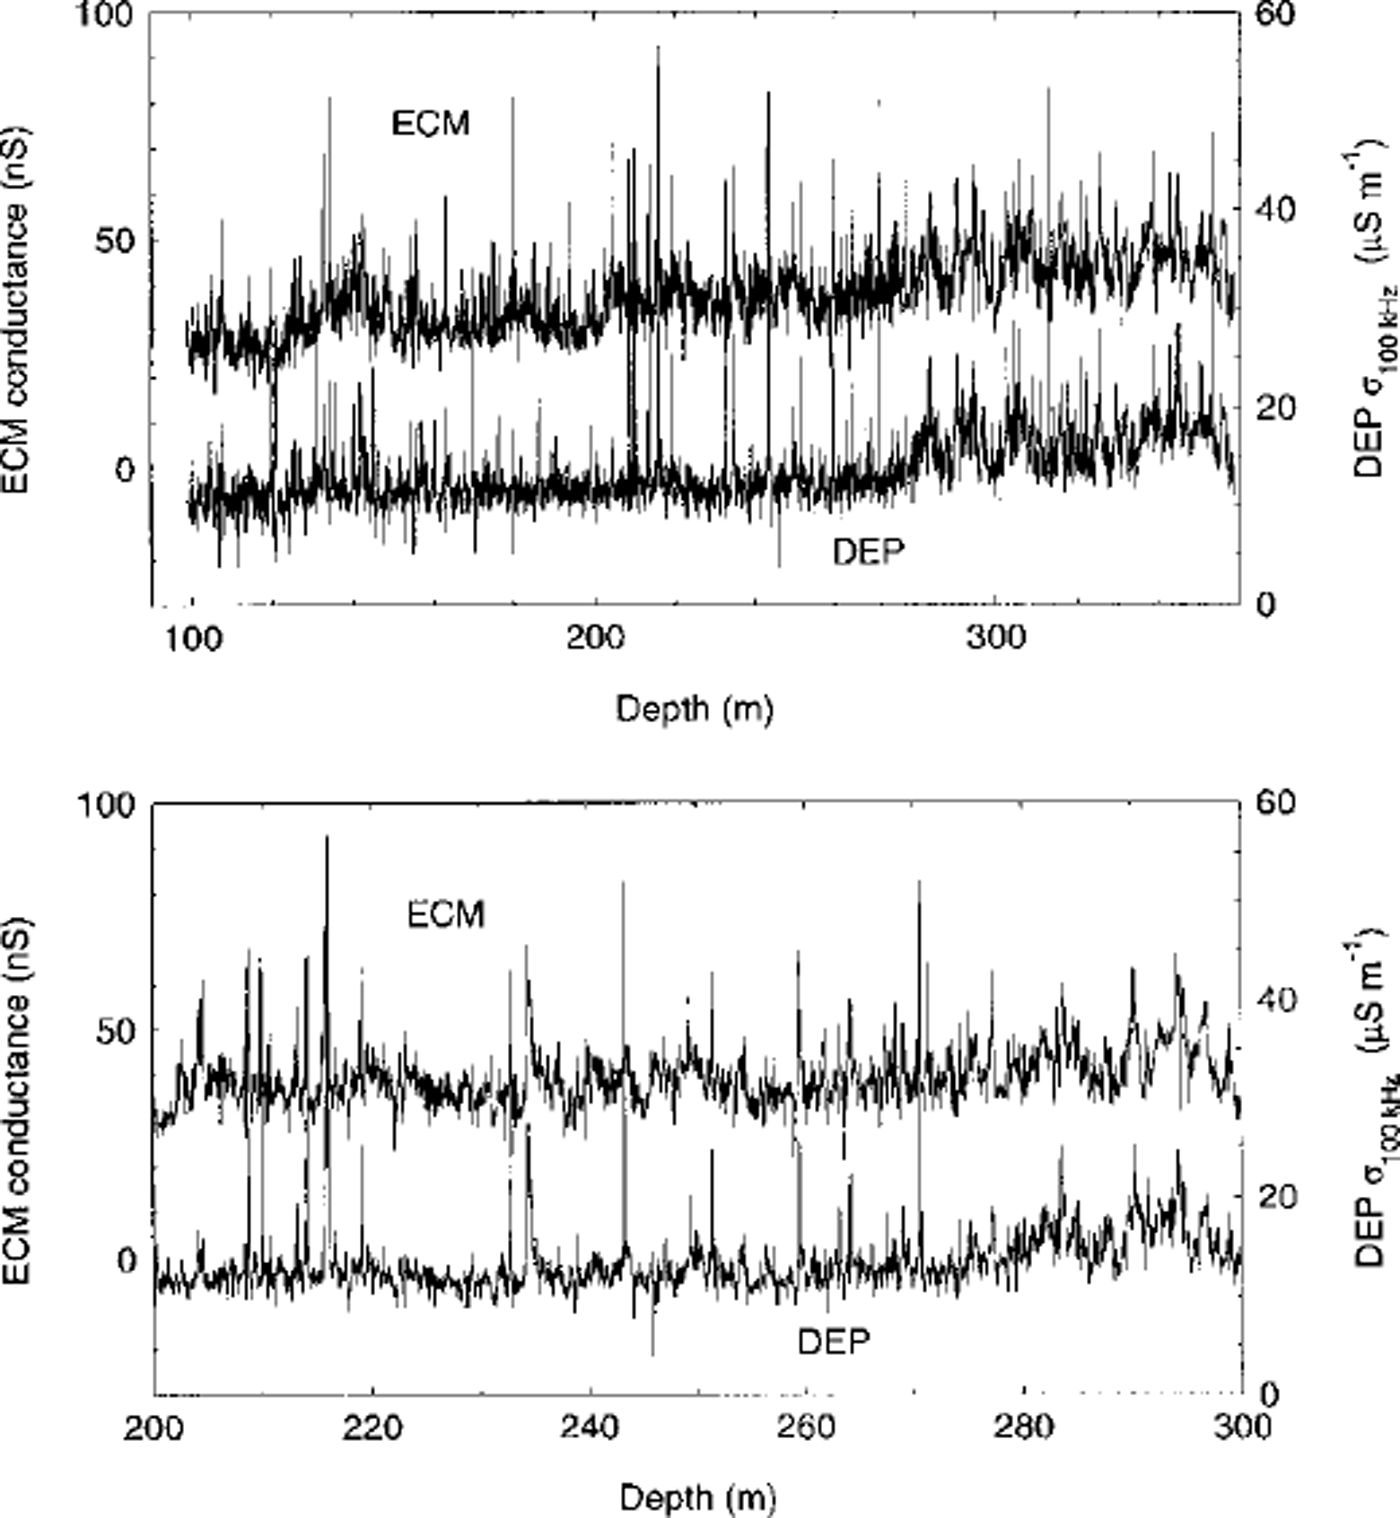
The DEP and ECM records for 99-358 m depth at Dome C do indeed show very similar characteristics (Fig. 1). In particular:
-
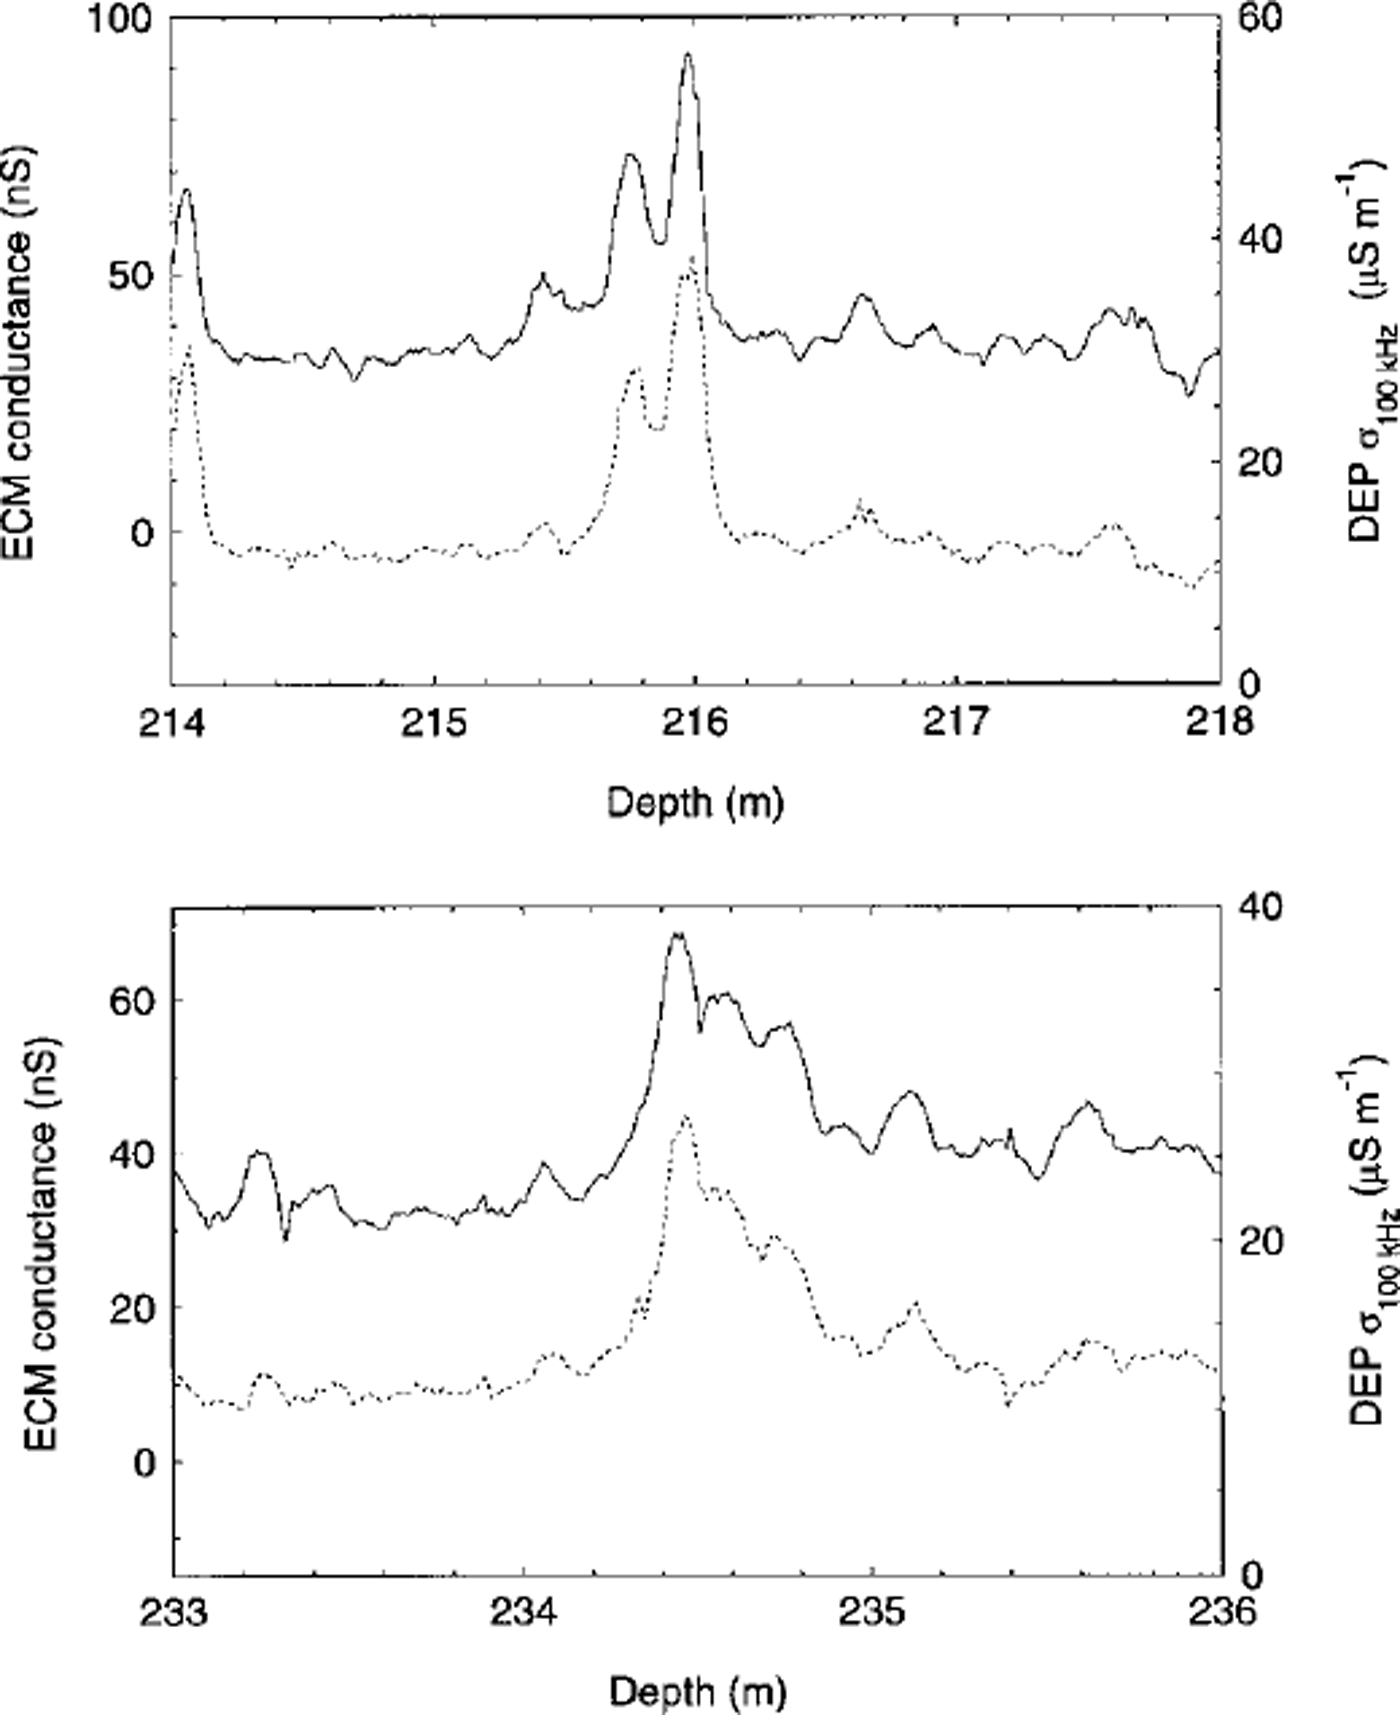
(a) Large (presumably volcanic) peaks are at the same depths, and generally of similar relative height. The peak shapes are also very similar, with some features having a multi-peak structure (Fig. 2) and considerable width (the 50 cm width of peak in Figure 2 would represent as much as 15 years of precipitation).
-
(b) The shape of the background is also very similar: in particular, the significant increase in background between about 270 and 300 m, the fall evident in the deepest part of the record and the increased background at 130-145 m depth.
Comparison of ECM and DEP records for the EPICA Dome C core. Top panel is all the analyzed core, lower panel is a close-up of the 200-300 m section.
ECM (solid line) and DEP (dashed line) over two peaks from the EPICA Dome C core.
There are no very local sources of material to the ice sheet, so we might expect robust features, such as these that appear clearly in both electrical records, to be widespread and apparent in other records from this region. On the other hand, a few features appear in one record but not the other:
-
(a) The significant increase in background ECM signal at 200 m is not seen in the DEP, and may be an artefact of the instrument. One partial cause of this could be that one electrode was making a short circuit to ground for the ECM between 123 and 202 m. The signal of this electrode was disregarded, but it also influenced the signal for the other electrodes. A correction was applied for this based on the change in signal at 123 and 202 m, but the effect may not have been constant.
-
(b) A few peaks appear in one record and not the other, or have a significantly different relative size between the two records (e.g. ECM peak at 205 m and DEP peak at 131 m), and we cannot be sure of their reliability
We note that the size of the DEP background suggests an acidity of 1-1.5 μM, slightly less than reported before for Dome C (Reference Legrand and DelmasLegrand and Delmas, 1988), with peaks that would be equivalent to an acidity of about 8 μM (based on Greenland calibrations of the DEP). The increased background below 270 m implies higher concentrations of acid; this might be due to a change in source strength, or to a change in snow-accumulation rate. Data from chemical analysis are needed to further elucidate this, but in either case the change should be expected in other cores in the region.
Comparison Between Vostok and Dome C Electrical Records
Based on the discussion above, we could expect to be able to match up major peaks, and background trends between Dome C and Vostok, at 550 km distance. In fact, we already have information that should allow us to narrow down the possible matches, based on profiles from the previous Dome C core. Using the sharp final change in δ18O at the end of the transition from glacial conditions into the Holocene, it is clear that 400 m depth in the old Dome C core corresponds approximately to 270 m at Vostok (Reference Ciais, Jouzel, Petit, Lipenkov and WhiteGiais and others, 1994). To first order, we anticipate that the current Dome C core, located 60 km distant, and about 20 m higher in altitude, should have a long-term average accumulation rate similar to that of the old core. Therefore, we looked for fits that would not be too inconsistent with this match.
We can also constrain our result if we note that, while the absolute accumulation rate might (and probably does) vary significantly, we have no reason to expect the relative rate between sites to vary within the Holocene. In particular, if the accumulation rate at these central sites is controlled mainly (through vapour pressure) by the temperature (Reference RobinRobin, 1977), then two sites with similar temperature histories should have a rather constant ratio of accumulation rates. In that case, we should expect a linear fit (passing through the origin) between matching depths at the two sites if we use water-equivalent or ice-equivalent depths throughout. Using true depths, we should still see a near-linear relationship below the close-off depth (about 100 m at these sites), but it will not extrapolate to the origin.
One possible match is shown (at two levels of detail) in Figure 3. Although we do have some reasonable matches, there are also many peaks that do not match up. In the section shown in the lower panel of Figure 3, nine of the ten largest peaks at Vostok have possible matches at Dome C that require no stretching of depth scales; the largest peak in this section at Vostok, at 129.85 m, corresponds to only a rather minor peak in the Dome C ECM, but to one of the largest peaks in the DEP record. There are significant Dome C peaks that find no satisfactory analogue at Vostok. We postulate that the lower accumulation rate at Vostok means that fewer peaks are well preserved (i.e. more annual layers are completely removed). However, it is also probable that some peaks have been lost from the Vostok record due to the need to remove the signal from core ends and broken sections of core; the new electrode system, improved core quality, and availability of DEP data at Dome C make it unlikely that any significant peaks were missed there.
Comparison and tentative matching of Dome C and Vostok ECM records. Top panel is all the analyzed core (at Dome C), lower panel is a close-up of a 110 m section. All depth scales are linear.
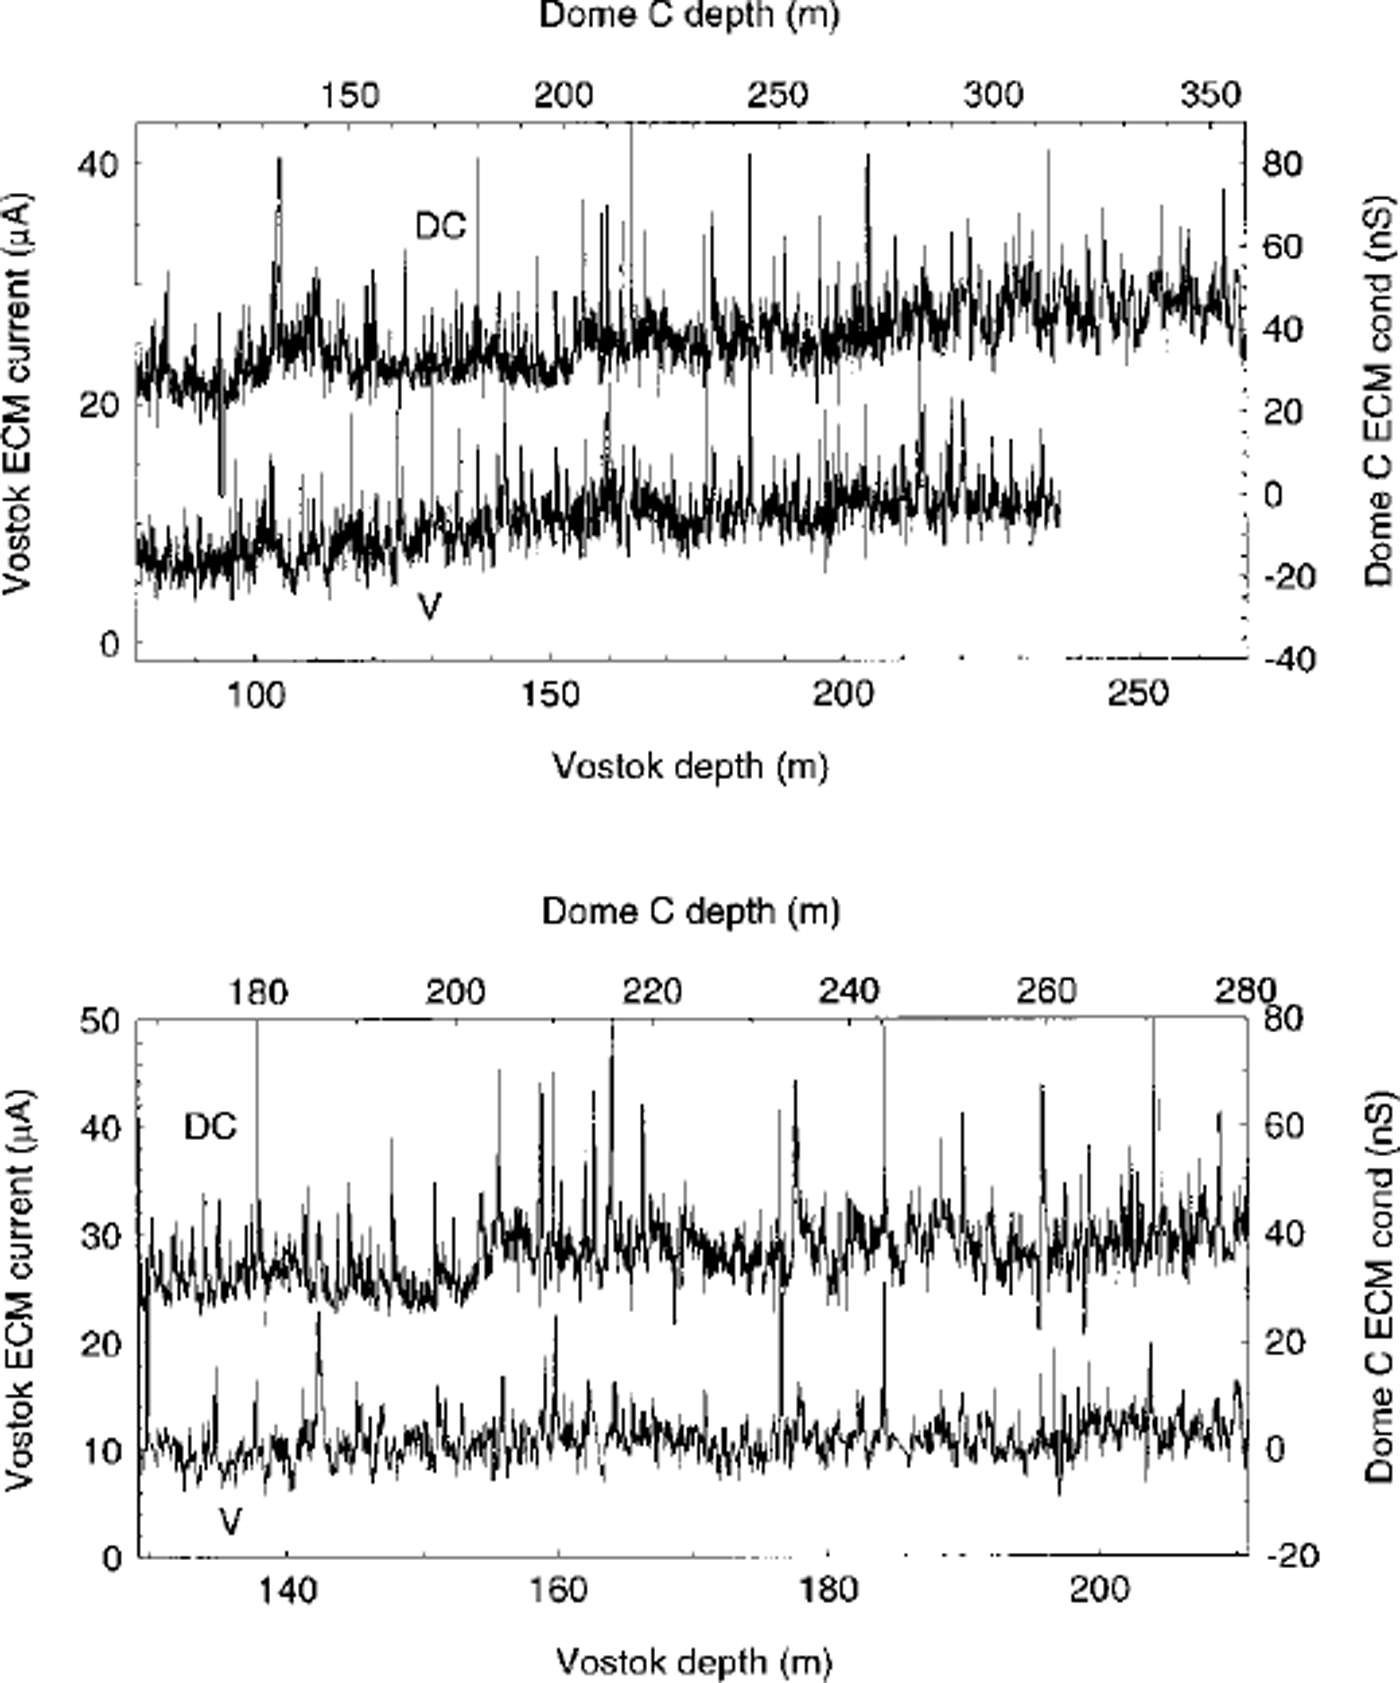
It was particularly difficult to find matches for the features in the background shape at Dome C that we considered significant. There is no obvious trend corresponding to the increase in background seen in both ECM and DEP at Dome C between 270 and 300 m. The clear trend at Vostok between 100 and 150 m also has no analogue at Dome G. This could be due partly to the effect of densification on conductivity and hence currents, but this should be a small effect below 100 m. We have no explanation for our inability to match some of the significant background trends; an understanding of their chemical origin is needed to progress further on this. There is an apparent fall in the ECM and DEP level in the very deepest ice analyzed in 1997-98, and this could correspond to the change in ECM level seen at Vostok at the end of the Glacial-Holocene transition.
The match we have suggested has the property that, when one plots Dome C depths against Vostok depths, a linear fit is obtained, with a gradient of 1.37 (i.e. Dome Caccumulation 37% higher than Vostok). The intercept of the best fit is at a Dome C depth of-9 m. The firn correction (i.e. the difference between true depth and ice-equivalent depth) at Vostok is approximately 32 m (personal communication from J. Jouzel, 1998), and we expect the Dome C value to be very similar (based on its similarly low temperature and accumulation rate). In that case, the intercept should be equal to (a-1)x32, where a is the gradient; this calculation yields an intercept of-12 m, very close to what we find. No significant changes in relative accumulation rate with depth are required for this fit. Table 1 shows the ratio of accumulation rates based on recent measurements, and our best fit. The suggested match implies that the accumulation rate at the new Dome C core is significantly lower than that of the previous Dome C core; 270 m at Vostok would correspond to around 360 m in the new Dome C core, as compared to 400 m in the old Dome C core (Reference Ciais, Jouzel, Petit, Lipenkov and WhiteCiais and others, 1994). (One can find a possible match with a higher accumulation rate, but the first results from younger and older ice drilled in 1998-99 indicate that the match shown in Figure 3 is more likely to be correct.)
Relative accumulation rates between Done C (DC) and Vostok (V). The first three rows refer to the previous Done C core

Conclusion
We have been able to suggest a fit between Dome C and Vostok electrical peaks. A number of strategies could be used to confirm it:
-
(a) Further peaks should be matched after the top section at Dome C is measured.
-
(b) The rapid change in δ18O at the start of the Holocene should be found in the next few tens of metres of ice drilled at Dome C, and will provide an unequivocal fixed point.
-
(c) Ash layers have been found at both sites, but no systematic search has been carried out that could allow an attempted match. Because they are laid down over a very short time period, a significant ash layer at one site can easily be missing from another site nearby, and even layers found in one Vostok core were not always found in another Vostok core (Reference BasileBasile, 1997). Nonetheless, isotopic and chemical analysis of such layers can provide a very specific fingerprint for matching between cores.
-
(d) The chemistry of individual ECM peaks could be compared between the sites to compare supposed matches; for example some peaks apparently contain high levels of chloride, rather than the more common sulphate.
If our match is correct, then we can make a preliminary estimate of the age of the ice at 358 m at Dome C, based on the most recent (GT4) dating of Vostok. This would give an age of > 11 ka BP, suggesting that the transition back out of the Holocene has begun and will be completed early in the 1998-99 drilling season. When more core is available, it should be possible to make a match between peaks in the Dome C core and those in the Byrd core. The Byrd core has been well dated by annual layer counting (Reference Hammer, Clausen and LangwayHammer and others, 1994) back to 50 ka, and therefore offers the possibility of transposing to Dome C an absolute time-scale covering this period.
Acknowledgements
This work is contribution No. 3 to the "European Project for Ice Coring in Antarctica" (EPICA), a joint European Science Foundation (ESF)/European Commission (EC) scientific programme, funded by the EC under the Environment and Climate Programme (1994-98) contract ENV4-CT95-0074 and by national contributions from Belgium, Denmark, France, Germany, Italy, the Netherlands, Norway, Sweden, Switzerland and the U.K. We thank our many colleagues involved in drilling, science and logistics at both Dome C and Vostok for their help and support. We also thank R. Röthlisberger and O. Zumbrunnen, who assisted in making the Dome C-Vostok match.



