I. Introduction
An important body of literature has been established regarding the size distribution of firms. Beginning with Gibrat's (Reference Gibrat1931) Law of Proportionate Growth, in which stochastic growth of firms generates a log-normal size distribution of firms, a vast body of literature has evolved on the size distribution of firms.Footnote 1 Schmalensee (Reference Schmalensee, Schmalensee and Willig1989, p. 994) notes that there is no single family of distributions that satisfactorily describes all industries. However, a widely held view is that the distributions, although right-skewed, become more log-normal over time (see, e.g., Angelini and Generale, Reference Angelini and Generale2008). In recent years, growing attention has been paid to the reasons behind the distributional evolution, such as age and financial constraints, and to the development of theoretical models of firm growth that give rise to log-normality.
Cabral and Mata (Reference Cabral and Mata2003), using Portuguese manufacturing firms, were among the first to examine the impact of the age of firms on their size distribution. They concluded that as the firms age, the size distribution evolves from right-skewed to log-normal. Bertinelli, Cardi, Pamukçu, and Strobl (Reference Bertinelli, Cardi, Pamukçu and Strobl2006) also found that the distribution of manufacturing and service firms in Luxemburg evolves over time from right-skewness to log-normality. However, based on the use of the true measure of plant size, rather than the proxy measure used by Cabral and Mata (Reference Cabral and Mata2003), they noted a reversal in the aging process in that for the case of very old plants, the distribution reverts to right-skewness (p. 311). More recently, Cirillo (Reference Cirillo2009, p. 1729) analyzed the size distribution of Italian firms and concluded that there is a clear difference in the size distribution by age. Specifically, as firms age, their size distribution shifts to the right. However, unlike Bertinelli et al. (Reference Bertinelli, Cardi, Pamukçu and Strobl2006) and Cabral and Mata (Reference Cabral and Mata2003), Cirillo (Reference Cirillo2009) found the size distribution for every age class to be stable over time. Coad (Reference Coad2010) developed a mathematical model that combines a firm's age distribution with the Gibrat-type process to produce a Pareto-optimal firm size distribution. The more skewed distribution of young firms is believed to be the result of financial constraints facing the newer firms (Cooley and Quadrini, Reference Cooley and Quadrini2001; Cabral and Mata, Reference Cabral and Mata2003).
A vast body of literature has grown up over the past several decades on the impact of firm size, firm age, and other factors on the growth of firms. However, the results are not conclusive with respect to their impact on the size distribution of firms (see, e.g., Coad, Reference Coad2009; Das, Reference Das1995). Oliveira and Fortunato (Reference Oliveira and Fortunato2006) find that financial constraints on firm growth are greater on small and new firms, but they do not consider the impact of financial constraints on the size distribution of firms. Cefis, Marsili, and Schenk (Reference Cefis, Marsili and Schenk2009) find that for manufacturing firms in the Netherlands, mergers and acquisitions make the size distribution more concentrated around the mean, less positively skewed, and thinner at the tails. Hutchinson, Konings, and Walsh (Reference Hutchinson, Konings and Walsh2010) find that for manufacturing firms in the UK and Belgium, interindustry diversification shifts the firm size distribution to the right, especially for older firms. Roberts, Klepper, and Hayward (Reference Roberts, Klepper and Hayward2011) find that firm size differences are influenced by the founders' prior wine industry experience. Specifically, firms founded by experienced individuals enter at a larger size and remain larger for the next twenty years. Yang, McCluskey, and Brady (Reference Yang, McCluskey and Brady2012) describe how clustering can have positive or negative effects on firms entering the industry.
Angelini and Generale (Reference Angelini and Generale2008, p. 435) contend that firms that are financially constrained are the younger ones but that the size distributions for “non-constrained firms are almost always visually and statistically indistinguishable from those for the entire sample. In the case of inter-country comparisons, financial constraints are more problematic in developing countries, such that for non-OECD [Organization for Economic Cooperation and Development] countries, financially constrained firms exhibit a more skewed size distribution.”
The purpose of this paper is to examine both the size distribution of California's North Coast wineries over time and by age. The North Coast, which consists of the counties north of San Francisco, including Lake, Marin, Mendocino, Napa, Sonoma, and Solano, represents more than 40 American Viticultural Areas (AVAs) and is home to approximately half the wineries in California. The advantage of examining firms within a specific industry and geographic location is that various factors that affect firm growth, such as financial constraints, are presumed to be constant.
As a first step, we perform the Kolmogorov-Smirnov (KS), Anderson-Darling (AD) and χ 2 tests for conformity to log-normality. Kernel nonparametric density estimation methods are then applied. Using both methods, we examine the size distribution of wineries both over time and by age. The results are then compared with those of other industries.
Although the distribution of firms has been extensively studied both theoretically and empirically, very little work has been conducted on the changing size distribution of wineries. Folwell and Volanti (Reference Folwell and Volanti2003), using data on all U.S. wineries, found a decrease in industry concentration. More recently, Cyr, Kushner, and Ogwang (Reference Cyr, Kushner and Ogwang2012) found that over the 25-year period from 1984 to 2009, smaller wineries increased as a proportion of the total number of wineries. The market share of the smaller wineries also increased over the same period. To maintain market share in the face of the success of small wineries, some of the larger California wineries created small brand wineries to take advantage of the preference of some consumers for boutique-type wines. An example of such a “winery within a winery” is E. & J. Gallo's 2004 addition of Cellar 254 as an on-site microwinery for its 2002 purchase of the Louis M. Martini winery (Caputo, Reference Caputo2007).
To the best of our knowledge, our study is the first to apply KS, AD, and χ 2 tests as well as kernel nonparametric density estimation methods to determine the changing size distribution of wineries and is certainly the first to examine the size distribution of wineries by age.
II. Data
In this study, like most other studies of the wine industry, we use annual production data (cases of wine produced) as a size measure. These data were obtained from the Wines & Vines: Annual Directory of the Wine Industry in North America and cover the following years: 1984, 1989, 1994, 1999, 2004, and 2009. We select five-year intervals to reflect the time it takes between the planting of vines and harvesting. The number of cases of wine produced is the only output variable reported in Wines & Vines for all the years.Footnote 2
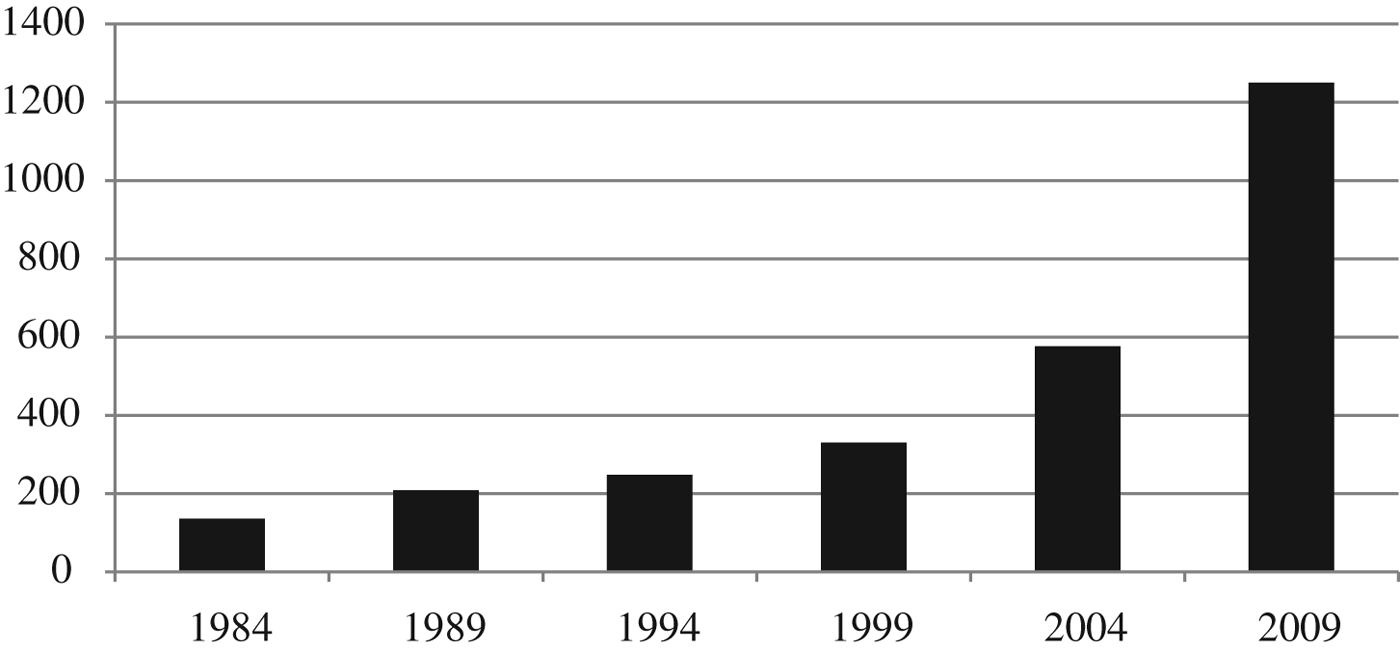
As shown in Figure 1, the number of wineries increased approximately tenfold from 135 in 1984 to 1,250 in 2009, in contrast to the approximately twofold increase in production over the same time period as depicted in Figure 2. Thus, the general decline in the average production per winery as shown in Figure 3 reflects changing size distribution over the 25-year period.
Number of North Coast Wine Firms, 1984–2009

Total North Coast Production, 1984–2009 (cases per year)
Average Production per Producer, 1984–2009 (cases per year)
III. Methodology and Results
To determine whether the size distribution of firms has changed over time, we classify wineries according to size as measured by output. As stated previously, because there is an approximately five-year period from the planting of vines to harvesting, we use five-year intervals from 1984 to 2009. As a first step, we perform the Kolmogorov-Smirnov (KS), Anderson-Darling (AD), and χ 2 tests for conformity to log-normality. Kernel nonparametric density estimation methods are then applied. Using both methods, we examine both the size distribution of wineries over time and by age.
A. Kolmogorov-Smirnov (KS) and Anderson-Darling (AD) and χ2 Tests
As previously indicated, we performed the Kolmogorov-Smirnov (KS), Anderson-Darling (AD), and χ 2 tests for conformity to log-normality for both the size distribution of U.S. wineries over time and the size distribution of wineries by age.
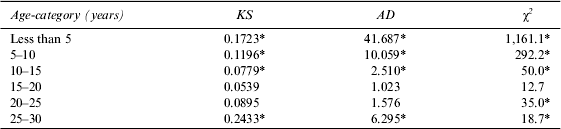
Table 1 reports the results for the size distribution over time. The three tests lead to universal rejection, at the 5 percent level of significance, of the null hypothesis that the distribution of wineries is characterized by a log-normal distribution for the two most recent years: 2004 and 2009. For 1999, two of the three tests (i.e., KS and χ 2) also lead to rejection of the same null hypothesis at the same level of significance. For the earliest two years, 1994 and 1999, all the three tests fail to reject, at the 5 percent level of significance, the null hypothesis that the distribution of wineries is characterized by a log-normal distribution. It can be concluded from these results that the distribution of wineries has shifted away from the (approximate) log-normality that was observed for earlier years.
Kolmogorov-Smirnov (KS), Anderson-Darling (AD), and χ 2 Tests for Log-Normality of the Winery Distributions Over Time
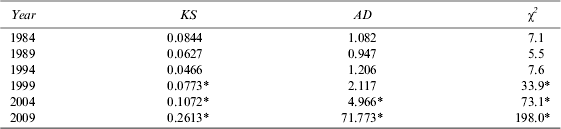
* Significant at the 5% level. All the test statistics and the associated critical values were computed using the statistical software package Easyfit (www.mathwave.com/easyfit-distribution-fitting.html).
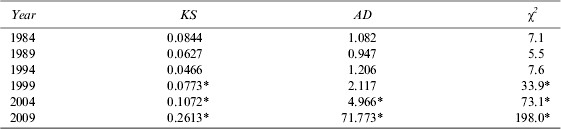
The impact of age is determined by comparing the size distribution for the following six age categories: Category 1 (<5 years), Category 2 (5 to 10 years), Category 3 (10 to 15 years), Category 4 (15 to 20 years), Category 5 (20 to 25 years), and Category 6 (25 years and over). Table 2 gives the results for the size distribution by these age categories. The three tests lead to universal rejection, at the 5 percent level of significance, of the null hypothesis that the distribution of wineries in each age category is log-normal for the following four age categories: less than 5, 5–10, 10–15, and 25–30. For age category 15–20, all the three tests fail to reject the same null hypothesis at the same level of significance. For age category 20–25, only the χ 2 test leads to rejection of the null hypothesis of log-normality. It is apparent from these results that the distribution of wineries is not robust with respect to the various age categories.
Kolmogorov-Smirnov (KS), Anderson-Darling (AD) and χ 2 Tests for Log-Normality of the Winery Distributions by Age Categories
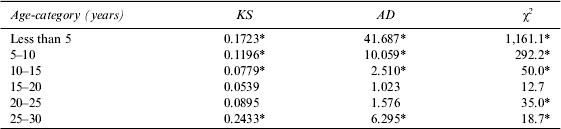
* Significant at the 5% level. All the test statistics and the associated critical values were computed using the statistical software package Easyfit (www.mathwave.com/easyfit-distribution-fitting.html).
B. Kernel Nonparametric Density Estimates
In this section, we present the kernel nonparametric density estimates of the distribution of wineries over time and by age classifications. The sample sizes employed in this paper are more than sufficient for meaningful nonparametric estimation of the size distribution of firms.Footnote 3
(1) The size distribution of U.S. wineries over time
Figures 4(a) and (b) show the size distribution of wineries for 1984 and 2009.Footnote 4 As the figures indicate, the size distribution of wineries has changed from positively skewed to bimodal. These results are inconsistent with the results in other industries, which find the size distribution to evolve over time from positive skewness to log-normality. Our results are, however, consistent with recent empirical research in the wine industry, which finds that small wineries are becoming a larger component of market share and that midsize wineries are being squeezed out by both smaller and larger wineries (Caputo, Reference Caputo2007; Cyr et al., Reference Cyr, Kushner and Ogwang2010; Reference Cyr, Kushner and Ogwang2012; Folwell and Volanti, Reference Folwell and Volanti2003).
(a) Winery Size Distribution, 1984, (b) Winery Size Distribution, 2009
(2) The size distribution of wineries by age classification
The impact of age is determined by comparing the size distribution for the six age categories mentioned above. The age and size of each winery for the period 1984–2009 were used to construct the size distribution for the six age categories. For every five-year interval beginning in 1984, wineries were placed in their respective age groups. For each age group, the data were then consolidated for all the periods. Figures 5(a)–(f) show the estimated kernel density plots for the six age categories. As firms age, the size distribution becomes less skewed and more bimodal, which is also inconsistent with the research on other industries which finds that as firms age, the size distribution becomes less positively skewed and more normal. Once again, as expected, the results are consistent with the above results, in which the size distribution of wineries has changed from positively skewed to bimodal. Our results are also consistent with recent empirical research in the wine industry, which finds that small wineries are becoming a larger component of market share.
Winery Size Distribution by Age Group, 1984–2009 (production in 1,000 cases)
As pointed out by a referee, rejection of log-normality does not rule out the possibility that long-run forces may cause the distribution to approach log-normality while one or more short-run shocks cause the distribution to appear bimodal temporarily. For example, a market or technological change may temporarily put midsize wineries at a disadvantage and cause many to exit. Even if this causes the distribution to be bimodal, it does not rule out the possibility that long-run forces are pushing the distribution to log-normality.
IV. Conclusions
The KS, AD, and χ 2 tests indicate rejection of the null hypothesis that the size distribution of wineries is characterized by a log-normal distribution in later years. The tests also indicate rejection of the null hypothesis of log-normality for the very new and very old age categories. The kernel nonparametric density estimates of the distribution of wineries over time and by age classifications confirm rejection of the null hypothesis that the size distribution of wineries follows a log-normal distribution. More specifically, our results indicate that the size distribution of wineries over time has changed from one that is positively skewed to one that is bimodal. These results are not consistent with the results for other industries, which find that the size distribution has become more normal over time. They are, however, consistent with recent empirical research in the wine industry, which finds that midsize wineries are being squeezed out by both smaller and larger wineries. Consumers appear to prefer the more expensive boutique wines or the cheaper large mass-produced wines. Thus, for midsize wineries to survive, they must be strategic in responding to the new market reality.
In terms of the distribution of firm size by age, our results indicate that as firms age, the size distribution of firms becomes less skewed and more bimodal, which is also not consistent with the research on many other industries; such research finds that as firms age, the size distribution becomes more normal. However, the results are consistent with those of Cyr et al. (Reference Cyr, Kushner and Ogwang2012), who found that the size distribution of U.S. wineries has become more bimodal over time. Thus, unlike in other industries, the smaller wineries, for a host of reasons, including successful product differentiation, are able to compete with the largest firms, which have the advantage of economies of scale. In industries where the product is much more homogeneous, economies of scale remain a significant determinant of concentration.
Unlike in many industries, in the wine industry new firms can enter and succeed, which means that the wine industry is not becoming as concentrated as other industries where either product differentiation or economies of scale are important barriers to entry. New entrants are able to meet the changing market and technological conditions of the industry. These results augur well for the growing area of wine tourism, which is highly dependent on so-called boutique or artisan wineries. Although larger wineries are losing market share, they still benefit from increased industry growth.
In terms of future research, the impact of financial constraints on wineries should be examined. Financial constraints affect a firm's decision to invest, and as shown by Cabral and Mata (Reference Cabral and Mata2003, p. 1079), can “to some extent explain the increased skewness in the size distribution in the size distribution that is typically observed in young cohorts of firms.” However, many of the wineries, especially the smaller ones, are not publicly traded, which makes it difficult to determine the financing constraints that they face.
A broader area of future research would be a regression model to examine the determinants of the changing size distribution of wineries. Variables such as economies of scale, financing (Oliveira and Fortunato, Reference Oliveira and Fortunato2006), mergers and acquisitions (Cefis et al., Reference Cefis, Marsili and Schenk2009), interindustry diversification (Hutchinson et al., Reference Hutchinson, Konings and Walsh2010), the wine experience of founders (Roberts et al., Reference Roberts, Klepper and Hayward2011), clustering (Yang et al., Reference Yang, McCluskey and Brady2012), and various government policies in aid of small business (see U.S. Small Business Administration) could be incorporated into the model. Another area of future research would be to incorporate all the wineries in the United States to provide greater insight as to what is happening to industry concentration.