


1. Introduction
Robot manipulators have evolved into vital mechanical assets within manufacturing enterprises. Degradation of robot manipulator performance is inevitable but it is available to mitigate the process of deterioration and reduce maintenance costs by optimizing maintenance management strategies (e.g., condition-based maintenance and predictive Maintenance) [Reference Aivaliotis, Arkouli, Georgoulias and Makris1]. The foundation of maintenance is fault detection and diagnosis (FDD). FDD techniques have been developed for various industrial systems [Reference Abid, Khan and Iqbal2], while the efficient supervision, fault detection, and diagnosis of robot manipulators remain a challenging field, encompassing a fusion of physical-oriented system theory, experiments, and computations [Reference Isermann3, Reference Khalastchi and Kalech4]. Currently, there are two main FDD techniques applied to robot manipulator applications, namely model-based and data-driven approaches [Reference Yuan, Ma, Cheng, Zhou, Zhao, Zhang and Ding5]. Data-driven approaches utilize input/output data to construct a black-box model (physical knowledge-independent) of the behavior [Reference Yin, Ding, Xie and Luo6]. Undeniably, data-driven methods have grown in versatility with the advancement of Artificial Intelligence (AI) algorithms. For the field of robotics, the verification and application of FDD techniques integrated with AI algorithms have been conducted at both the component and system levels. In scenarios involving component disassembly (e.g., gear, reducer, bearing, actuator, belt, etc.), deep learning approaches have shown an excellent performance and tremendous potential in fault detection [Reference Chen, Mauricio, Li and Gryllias7–Reference Hu, Wu, Yang, Zhang and Yang12]. Research conducted at the component level serves to mitigate the disturbance from multiple fault features modulating and submerging each other at the same time. In practical engineering applications, there is often a strong focus on in-situ FDD [Reference Zhou, Zhou, He, Huang, Zhu and Chen13–Reference Zhou, Zeng, Chen, Xiao and Xiang15], where researchers directly utilize on-site operational data collected without disassembly. Nevertheless, the application of data-driven methods in such scenarios remains restricted by issues related to data quality and the scarcity of large-scale industrial in-situ data.
Model-based approaches usually implement FDD based on physical system models established by first principles or empirical rules. These models exhibit a strong connection to the underlying failure mechanisms, and the evolution or mode of deterioration can be clearly explained by the internal model parameters. In the context of FDD for robot manipulators, residue generation technique is one of the most common methods. McIntyre et al. [Reference McIntyre, Dixon, Dawson and Walker16] developed a nonlinear observer to identify actuator faults based on the dynamic model of the robot manipulator. Muradore et al. [Reference Muradore and Fiorini17] presented a FDD scheme based on the inverse dynamic model of a robot using statistical method, which considered sensor faults as well as actuator faults. Dixon et al. [Reference Dixon, Walker, Dawson and Hartranft18] developed a prediction-error-based approach that considers errors caused by acceleration estimation and inevitable uncertainty in robot parameters. This approach is based on the generation of residuals and exploits the structure of the full nonlinear manipulator dynamics and its effectiveness is verified in a two-joint system. Namvar and Aghili [Reference Namvar and Aghili19] used a particular model of a robot manipulator which resulted from using joint torque sensors to detect and localize a class of additive fault signals. Another common technique for model-based approaches is parameter estimation, where the parameters have obvious physical interpretations. Freyermuth [Reference Freyermuth20] proposed an approach that directly utilizes identified model physical parameters as fault indicators for an industrial robot. This method has shown to be effective and interpretable for incipient fault but no quantitative and in-depth analysis of the deviation patterns of parameters has been conducted. Bittencourt et al. [Reference Bittencourt, Axelsson, Jung and Brogårdh21] investigated the wear effect on a joint by a number of steady-state experiments and proposed a model-based wear estimator under temperature disturbance. The method makes condition-based maintenance of robot manipulators possible but it requires costly long-term experiments to determine the properties of each joint, where the robot is run continuously under high load and stress levels for several months or years until failure.
In this paper, we aim to present a diagnosis method for incipient faults in the transmission components of robot manipulators. Drawing inspiration from references [Reference Freyermuth20] and [Reference Bittencourt, Axelsson, Jung and Brogårdh21], our method is centered around the analysis of friction characteristics in the robot’s joints, and then the characteristic physical quantities are used to construct regions that are state mechanism interpretable. In the joint friction characterization experiments, our focus is on tracking the evolutionary process from a cold start to achieving steady-state operation. To simplify the process and reduce the reliance on extensive prior knowledge, such as individual differences, specifically degradation modeling [Reference Gorjian, Ma, Mittinty, Yarlagadda and Sun22], we introduce an equivalent load threshold to assess the health status of joints. The advantages of this method are as follows: (1) The diagnostic method does not require additional sensors, rendering it a convenient and cost-effective solution. Only the feedback current and feedback position of the joint motors are necessary, which can be obtained by each industrial robot system itself. (2) The friction characteristics derived from steady-state friction experiments offer enhanced accuracy and reliability. Given the inherent complexity of tribological behavior, especially when compared to the pursuit of high-precision control objectives, simplifying unknown or intricate friction characteristics for fault diagnosis purposes proves beneficial. (3) Our examination of friction characteristics encompasses both friction curves and model parameters. The estimated friction coefficients with physical interpretability are finally treated as symptoms in the diagnostic sense, which supports a knowledge-based evaluation achieving an increased depth of diagnosis. The characteristic indicators that are relatively insensitive to temperature are identified, making cold start diagnosis possible.
The paper is organized in the following manner. Section 2 and 3 show the dynamic model of a robot manipulator and elaborate the fault diagnosis framework using friction characteristics. Section 4 describes the detail of the experiment implementation and offers insights into the state evolution of the steady-state experimental friction curves. Section 5 presents the construction of fault indicators. In Section 6, conclusions and future works are presented.
2. Dynamic Model and Friction Model
The dynamic model is a mathematical physics equation describing the relationship between the motion of the structure and the driving torque. The rigid-body dynamic model for articulated manipulators with n-degrees of freedom can be derived by Newton–Euler formulation, Lagrange formulation, etc. [Reference Siciliano, Khatib and Kröger23] and generally depicted as:
 \begin{equation}\boldsymbol{M}(\boldsymbol{q})\ddot{\boldsymbol{q}}+\boldsymbol{C}(\boldsymbol{q},\dot{\boldsymbol{q}})\dot{\boldsymbol{q}}+\boldsymbol{G}(\boldsymbol{q})+\boldsymbol{F}(\dot{\boldsymbol{q}})=\boldsymbol{\tau }\end{equation}
where
 $\boldsymbol{q}$
,
 $\dot{\boldsymbol{q}}$
,
 $\ddot{\boldsymbol{q}}$
are respectively the vector of angular position, velocity, and acceleration of the joints.
 $\boldsymbol{M}(\boldsymbol{q})$
is the inertia matrix, which embodies the inertia characteristics of robot joints or links, encompassing mass, moment of inertia, and rotational inertia. It reflects the inertial effects in dynamic analysis and the opposition to angular acceleration due to mass distribution.
 $\boldsymbol{C}(\boldsymbol{q},\dot{\boldsymbol{q}})$
is the matrix regarding of Coriolis and centripetal effects. It describes the interaction term between joint velocities and the torques generated by these velocities, embodying the inertia forces due to rotation, and captures the coupled effect on torques induced by the angular velocity changes, akin to the Coriolis effect.
 $\boldsymbol{G}(\boldsymbol{q})$
is the gravity vector encapsulating the static force consideration due to gravity on robot’s operation, and
 $\boldsymbol{F}(\dot{\boldsymbol{q}})$
represents the friction torque vector.
 $\boldsymbol{\tau }$
is the driving torque vector of the joints.
The dynamic model also establishes a connection between measurable quantities and dynamic parameters that characterize joint mechanical conditions. Through appropriate parameter estimation processes, dynamic model parameters can be used to represent characteristic physical quantities relevant to diagnostic symptoms. The friction coefficient, damping, moments of inertia, and gravitational torques vary with the internal physical characteristics of the joints. These characteristic physical quantities can reflect incipient mechanical faults such as wear, maintenance defects, or collisions, and the estimated parameters are physically interpretable, which is important for fault quantification and localization. It is shown in Figure 1 that the dynamic model of a robot manipulator is informative about each kernel mechanical constituent. As mentioned in Section 1, many studies have been put forward to construct fault observers based on Eq. (1). Though these methods are able to perform an active on-line fault diagnosis, the difficulty lies in identifying the full model parameters, including kinematics geometric parameters and dynamic inertia parameters. The coupling of inertia and friction parameters in the identification procedure results in an inaccurate model, increasing the risk of false positives in fault detection, similar to the bottleneck in collision detection [Reference Huang, Gao, Liu, Chen and Zhang24]. For fault diagnosis, especially for incipient faults (i.e., develop gradually over time), transmission components are more vulnerable than links and motors. It is practically intriguing to investigate the relationship between joint friction and the incipient faults [Reference Bittencourt, Axelsson, Jung and Brogårdh21, Reference Bittencourt, Wernholt, Sander-Tavallaey and Brogårdh25–Reference Bittencourt and Axelsson27], in which the effects of temperature, load and wear on a main axis with rotary vector reducer are presented. In this paper, the friction characteristics of both the main axis and wrist axis with harmonic reducers are studied based on experiments. In this paper, we attempt to find proper fault indicators and decision rules for practical engineering applications.
Parameter composition and incipient faults in robot manipulators.

To accurately capture the friction characteristics, the steady-state friction characterization experiments are suggested [Reference Bittencourt and Axelsson27]. These experiments involve single joint movements with a constant velocity of a robot manipulator. In this case, terms related to acceleration and the effects of Coriolis and centrifugal torques can be vanished:
 \begin{equation}G\left(q\right)+F\left(\dot{q}\right)=\tau\end{equation}
Note that in certain configurations, the gravity term may become negligible or effectively vanish, for instance, in base joints where the joint axis aligns parallel to the direction of gravity. Without loss of generality, the joints with gravity term are considered. To extract the frictional torques, the joint needs to undergo a symmetrical back-and-forth motion. For a testing cycle, the joint rotates at a velocity of
 $\dot{q}_{i}^{l}$
in the forward and the reverse phase can be respectively described as [Reference Bittencourt and Axelsson27]:
 \begin{equation}G\left(q_{i}\right)+F^{+}\left(\dot{q}_{i}^{l}\right)=\tau _{i}^{+}\end{equation}
 \begin{equation}G\left(q_{i+m}\right)+F^{-}\left(\dot{q}_{i+m}^{l}\right)=\tau _{i+m}^{-}\end{equation}
where the superscript
 $l$
represents the specified velocity level. The subscript
 $i$
is sampling points of time series,
 $i=1,2,3\ldots N$
. m is the marker point for converting the rotation direction.
 $\tau _{i}$
is the feedback torque of the servo motor.
Assuming friction is direction-independent under nominal operating conditions:
 \begin{align}F^{+}(\dot{q}_{m-i}^{l})=-F^{-}(\dot{q}_{m+i}^{l}), \quad G\left(q_{m-i}\right) = G\left(q_{m+i}\right) \end{align}
By combining the equations (3)-(5), the friction toque at a given velocity level can be obtained:
 \begin{equation}\overline{F}\left(\overline{\dot{q}}{}{}^{l}\right)=\text{mean}\left(\frac{\tau _{m-i}^{+}+\tau _{m+i}^{-}}{2}\right)\end{equation}
Friction modeling can be divided into two categories, physics-motivated approach and empirically motivated approach, depending on whether to predict the behavior from the internal physics of the problem or from dynamical systems consideration [Reference Al-Bender and Swevers28, Reference Johanastrom and Canudas-De-Wit29]. It is worth noting that the primary focus of this paper is fault diagnosis rather than achieving high-precision control of the system. Consequently, the friction characteristics in the pre-sliding regime are not considered. In the gross sliding regime, a prominent characteristic is steady-state friction force behavior with increasing steady-state sliding velocities, known as the Stribeck effect [Reference Stribeck30]. The friction model that can describe the Stribeck phenomenon has been proved to enable capture the real friction torque with a precision of 90% in robotic systems [Reference Marton and Lantos31, Reference De Wit and Carrillo32]. The general formulation of such models is [Reference Armstrong-Helouvry33]:
 \begin{equation}\overline{F}\left(\overline{\dot{q}}{}{}^{l}\right)=g\left(\overline{\dot{q}}{}{}^{l}\right)\text{sign}\left(\overline{\dot{q}}{}{}^{l}\right)+h\left(\overline{\dot{q}}{}{}^{l}\right)\end{equation}
where the function
 $g{(}{\cdot}{)}$
accounts for the friction contribution from the contact of asperities between two sliding surfaces. The function
 $h({\cdot})$
accounts for the friction contribution from the viscous shear of the lubricating film separating these surfaces.
The function
 $g({\cdot})$
is modeled as:
 \begin{equation}g\left(\overline{\dot{q}}{}{}^{l}\right)=F_{c}+(F_{s}-F_{c})\, \text{exp}\!\left(\!{-}\left| \overline{\dot{q}}{}{}^{l}/ V_{s}\right| ^{\alpha}\right)\end{equation}
where
 $F_{c}$
and
 $F_{s}$
are the Coulomb friction torque and the standstill friction parameter, respectively.
 $V_{s}$
is known as the Stribeck velocity indicating the range of velocity-weakening effect.
 $\alpha$
is the exponent parameter of the Stribeck nonlinearity and is usually treated as a constant ranging from 0.5 to 2 accounting for different physical configurations [Reference Waiboer, Aarts and Jonker34].
The viscous effect term
 $h({\cdot})$
with Newtonian lubricating medium is expressed as:
 \begin{equation}h\left(\overline{\dot{q}}{}{}^{l}\right)=F_{v}\cdot \overline{\dot{q}}{}{}^{l}\end{equation}
where
 $F_{v}$
is the viscous coefficient.
Waiboer et al. [Reference Waiboer, Aarts and Jonker34] hierarchically conducted friction modeling analysis based on physical models, demonstrating different viscous friction behavior in two elementary transmission components (i.e., gears and bearings). This suggests that non-Newtonian viscous friction behavior can be introduced through the composition of transmission components as well as the properties of the lubricating medium. More recently, nonlinear viscous friction has been observed in harmonic reducers [Reference Iskandar and Wolf35]. Thus, the function
 $h({\cdot})$
is modified by adding a non-Newtonian viscous friction exponent parameter
 $\beta$
as:
 \begin{equation}h\left(\overline{\dot{q}}{}{}^{l}\right)=F_{v}\cdot {\overline{\dot{q}}{}{}^{l}}^{\beta }\end{equation}
Consequently, the explicit expression of the steady-state experimental model used to explain friction behavior in this study is as follows:
 \begin{equation}\overline{F}\left(\overline{\dot{q}}{}{}^{l}\right)=F_{c}+\left(F_{s}-F_{c}\right)\exp \left(-\left| \overline{\dot{q}}{}{}^{l}/V_{s}\right| ^{\alpha }\right)+F_{v}\cdot {\overline{\dot{q}}{}{}^{l}}^{\beta }\end{equation}
The steady-state experimental friction model comprises a total of six parameters and these parameters are subject to physical feasibility constraints in the case of
 $\overline{\dot{q}}{}{}^{l} \gt 0$
:
 \begin{align}\begin{cases} \begin{array}{c}F_{s}\geq F_{c}\geq 0 \\ F_{s}\geq g\left(\overline{\dot{q}}{}{}^{l}\right)\geq F_{c} \\ V_{s}\geq 0 \\ \alpha \geq 0 \\ F_{v}\geq 0 \\ \beta \geq 0 \end{array}\end{cases} \end{align}
The applicability of this model in modeling of joint friction in a robot manipulator and the specific parameter identification process are presented in Section 4.
3. Friction-Based Fault Diagnosis Framework
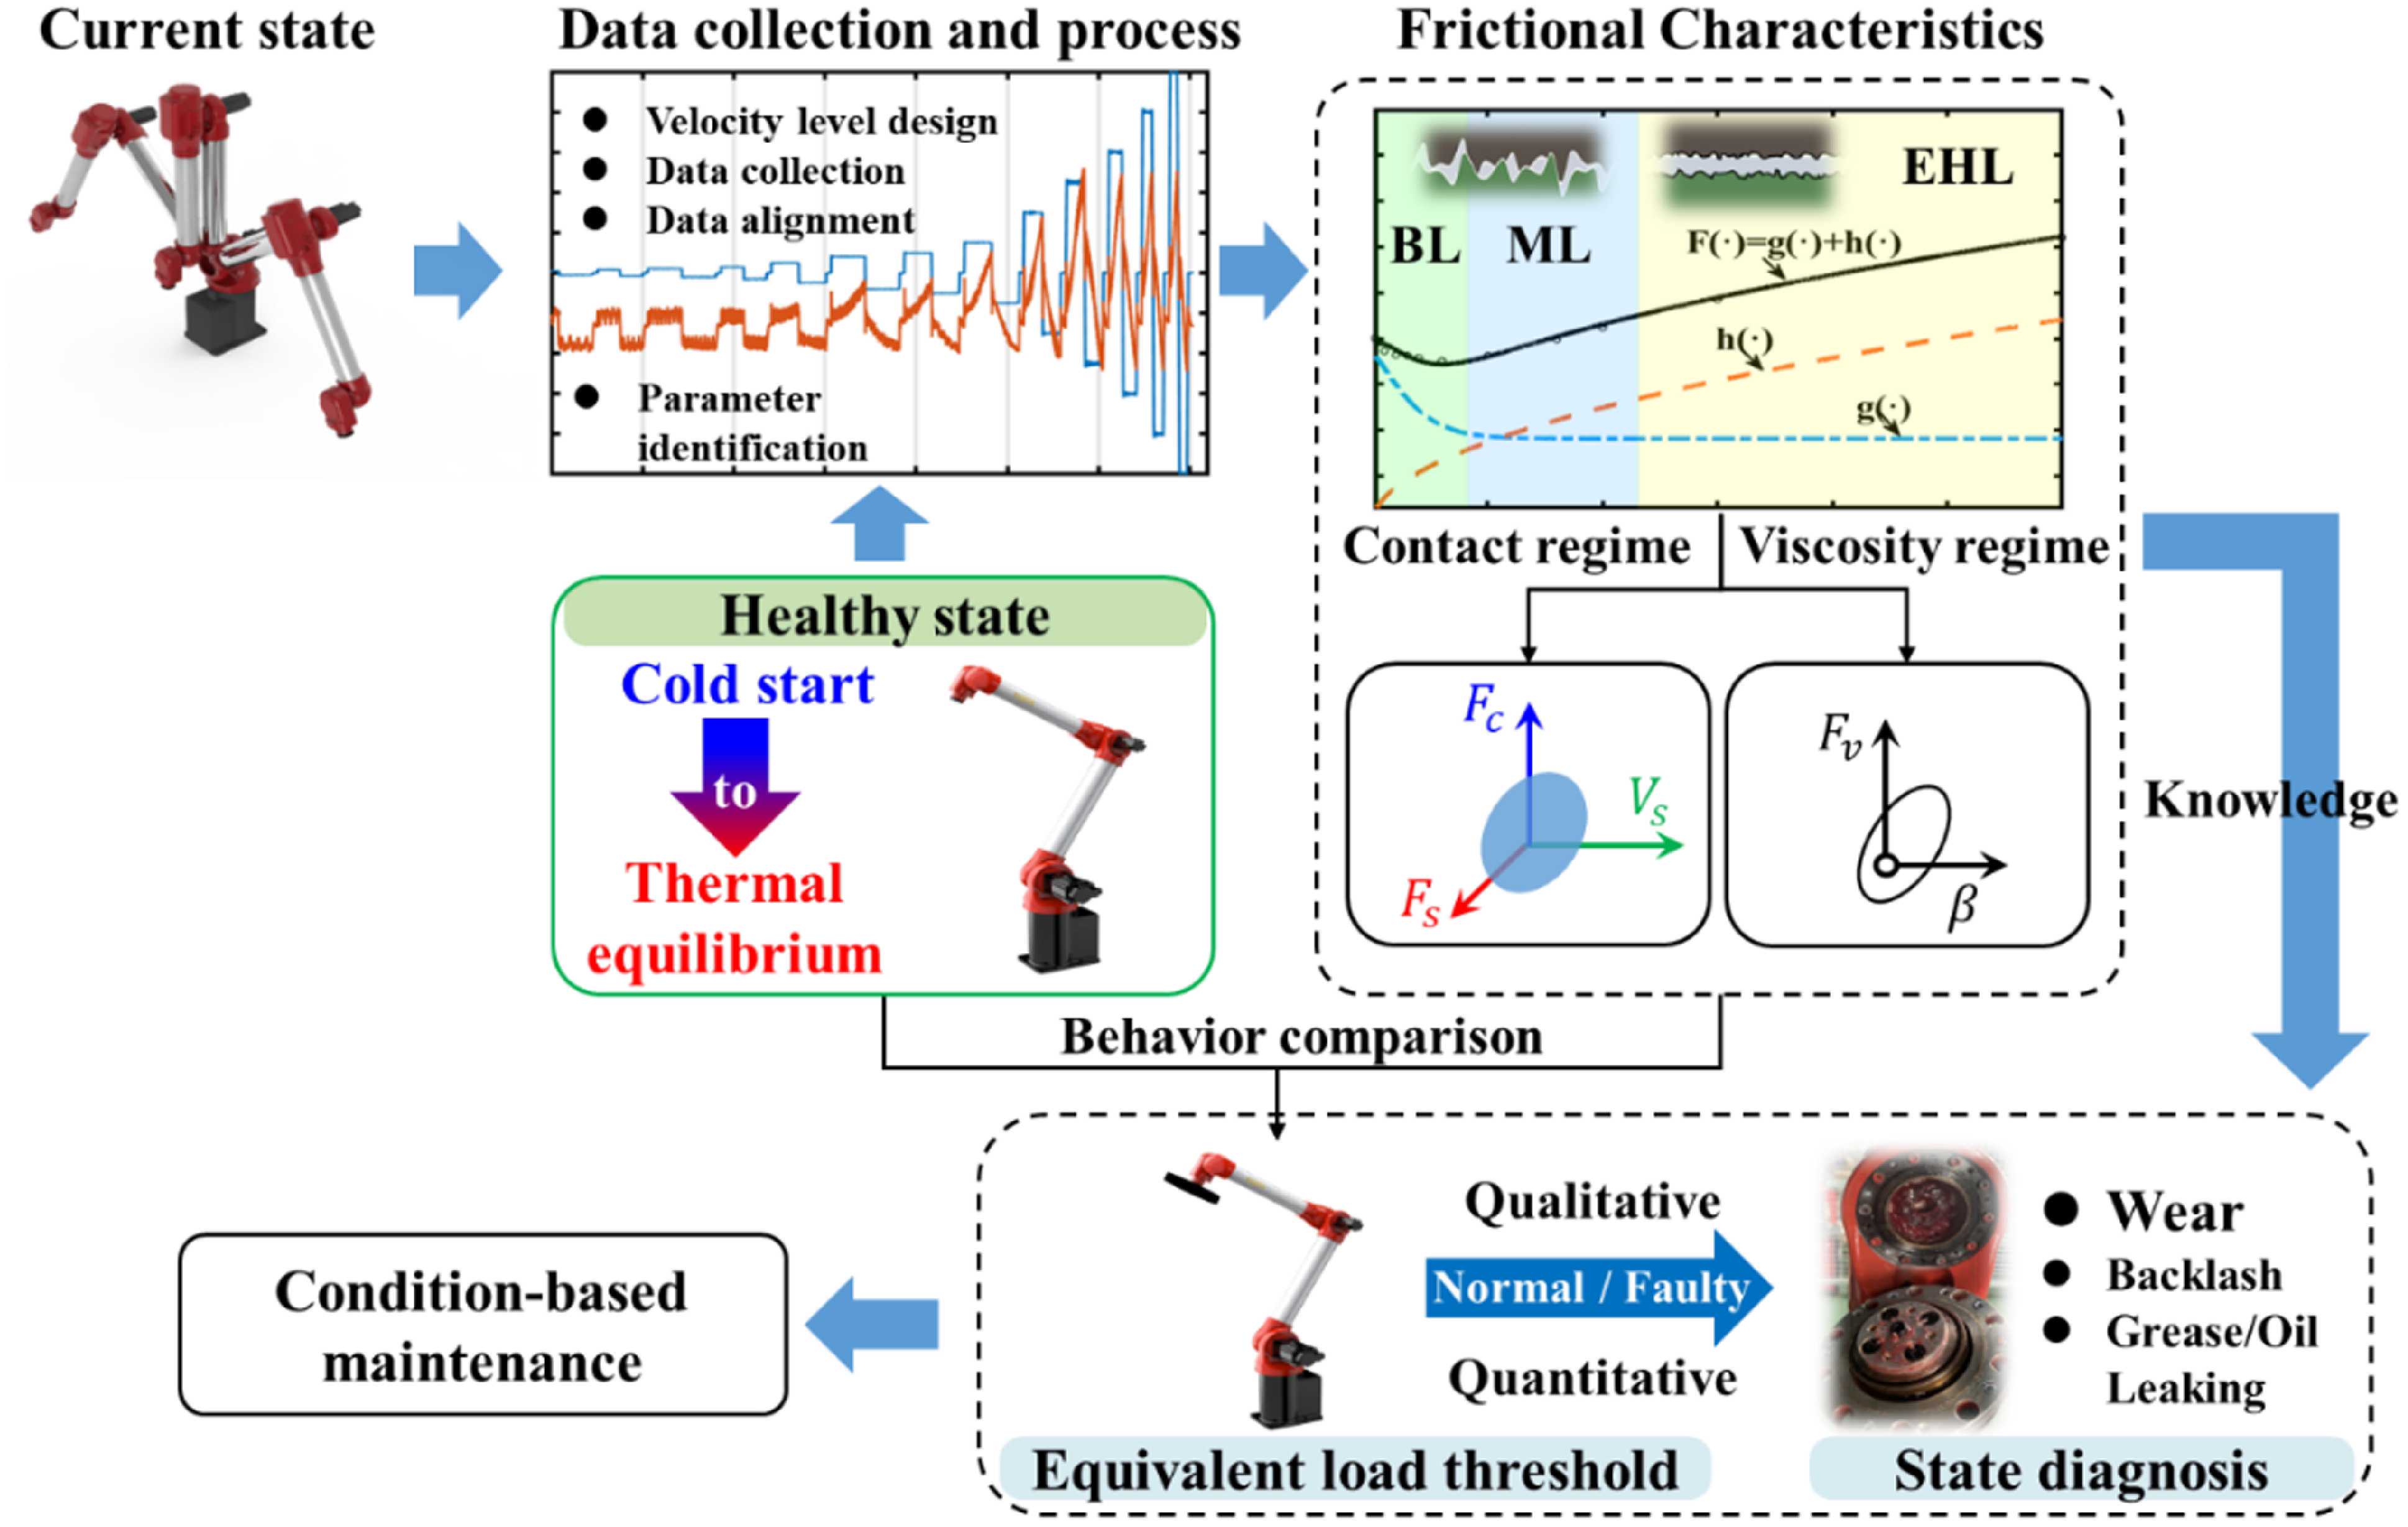
The degradation of a joint in a robot manipulator results in corresponding changes in its tribological behavior. According to this concept, a fault diagnosis framework for robotics is proposed as illustrated in Figure 2. There are three main parts in fault diagnosis process including definition of healthy state, friction curve and its characteristic decomposition, and anomaly detection. In previous investigations, most focused solely on the thermal equilibrium state for analysis. However, users do not expect to wait for a system to reach thermal equilibrium for diagnosis or control. An effective FDD strategy must identify the healthy or failed state regardless of its thermal state, that is, whether the system is in cold start or thermal equilibrium. Therefore, our focus is on experimentally measuring the behavior of healthy systems as they transition from a cold start to a thermal equilibrium state. Beside the curves of friction torque as a function of velocity, the parameters of the steady-state experimental model are divided into two categories according to the regimes of contact-related and viscosity-related. Subsequently, the corresponding confidence regions of a healthy state are constructed. It is known that the degradation process is a stochastic and individual-dependent phenomenon, which implies that fault reproducibility is uncertain. Performing fault experiments is costly and time-consuming, but it can provide insights into the common patterns of deterioration. Building on the insights from previous literature and the experiments conducted in this investigation, we propose a practical alternative by setting an equivalent load threshold for each joint of a robot manipulator. The underlying idea is that the load effect is considered a measure of the degree of joint degradation since the behavior of deterioration, such as wear, is similar to the load effect on friction. This similarity is attributed to the changes in micro-contact asperities. The logical criterion for failure occurrence is when the friction effect on a joint under load-free conditions exceeds that under a certain load. Evaluating the severity and types of faults will involve assessing the information related to the distance from the threshold and the friction characteristics. The feasibility and further details will be elaborated in the following section, which delves into the experimental content.
Framework of the proposed diagnosis approach for the joint of a robot manipulator. BL refers to boundary lubrication, which is mainly related to the interaction between the micro-asperities on the contacting surface. ML refers to mixed lubrication, where the interaction between micro-asperities coexists with the effects of a lubricating film. EHL refers to elastic hydrodynamic lubrication, which reaches a total separation of the surfaces by the lubricant.
4. Experimental Characterization for Joint Friction
The experiment platform, as depicted in Figure 3, features a 6-DOF articulated robot manipulator known as the HSR-BR609, developed by Huashu Robot Co., Ltd. The friction characterization experiment is conducted on joint 3 and joint 5 representing the main axis and wrist axis, respectively. This type of robot is composed of an offset wrist instead of the spherical wrist structure. The main transmission components in both joint 3 and joint 5 consist of harmonic drive gears. The experimental procedures are as follows: (1) Designing the test cycle and velocity levels for each joint. (2) Collecting the raw data of velocity and torque from motors according to the test cycle. (3) To trim and align data within the constant velocity segment. 4) Performing fitting and parameter identification based on a given model.
(a) Structure of an HSR-BR609 robot manipulator. (b) The experimental on-site device with or without a mass block.

4.1. Data collection of steady-state friction experiment
The steady-state friction experiment is to obtain friction torque at various velocity levels and then fit the model Eq. (11). Previous studies have often conducted friction experiments on joint 1 or on a test bed, primarily to isolate gravity from friction effects. In this experiment, we place significant emphasis on assuming directional independence of friction. The feedback torque data for joint 1 and joint 3 are collected as shown in Figure 4. It can be seen that the torque for joint 1, during the steady-state segment (operating at 5°/s), fluctuates around the mean value, while the torque for joint 3 is modulated by gravity. In this case, the mean value of the feedback torque for joint 1 can be regarded as friction torque, with the forward and reverse friction torques approximately measuring 15.077 N · m and −14.988 N · m. The effect of direction on friction is less than 0.1 N · m. Consequently, the subsequent investigations do not account for the directional dependence of friction.
(a) The initial configuration during the tests on each joint. (b) The forward and reverse feedback torques for joint 1 and joint 3 at a constant rotational velocity.

In the characterization experiments, the design of the test cycle determines the observable friction features and the time required. Based on our experience, the test cycle and velocity levels are as shown in Table I and Figure 5. There are 15 velocity levels, with 10 in the low-velocity range and 5 in the high-velocity range. As the friction behavior at low velocities offers more insight into the contact surfaces, we prioritize higher accuracy in the low-velocity regions of the friction curve. To strike a balance between time efficiency and accuracy, we employ a strategy involving small angular displacements at low velocities and larger angular displacements at high velocities. The entire testing cycle is executed within 3 minutes. During each cycle, a joint is rotated at the desired velocity level in both directions, ranging from
 $\overline{\dot{q}}^{1}$
to
 $\overline{\dot{q}}^{15}$
. Six signals are measured including joint position, velocity, torque, and registers R1&R2&R3 and during sampling the registers are used to mark states of start, rotation direction, and end, respectively. The sampling rate is 250 Hz in this study. The raw data collected from the motors are shown in Figure 5.
Experimental test cycle and velocity levels settings.

Operation trajectory, velocity, and torque measurement data for a testing cycle. (a) Joint 3. (b) Joint 5.

Before using Eqs. (3)∼(6), data alignment is necessary to enhance the estimation accuracy for friction torque. To extract the friction toque at a given velocity level, two conditions are required: (1) The data should be collected during a constant velocity phase. (2) The reverse angular displacement data should overlap as closely as possible with the forward phase. Figure 6 shows the angular position and velocity data of
 $\overline{\dot{q}}^{15}$
for joint 3. It can be seen that there is an approximately 4° lag between the constant forward and reverse stages. The lower half of the figure illustrates the corresponding velocity curve, which exhibits the asymmetry phenomenon as well. Several factors, such as acceleration and deceleration planning, data collection procedures, and data segmentation methods, can contribute to this lag. The reason why asymmetry occurs is not the focus of this study. It is still possible to proximately calculate the lag even if the cause of the inconsistency is unknown. The valuable data corresponds to the constant velocity segment, which is extracted from the raw data. The average angular displacement deviation can be calculated by subtracting data points from the forward and reverse constant velocity segments. According to the velocity level, the time difference between reaching a constant velocity state in both forward and reverse directions can be obtained. Finally, the number of data points needing to be trimmed can be yielded based on the known sampling frequency. The procedure can be expressed as:
The angular position and velocity data for
 $\overline{\dot{q}}^{15}$
for joint3, with the forward and reverse states distinguished by gray and white backgrounds. The blue solid line is the position over time, while the brown dashed line is a mirrored representation of the reverse stage curve. The red solid line illustrates velocity over time, with the green dashed line representing a mirrored version of the reverse curve. The dark blue dot-dashed line is generated by taking the absolute value of the green curve data.

 \begin{equation}\frac{mean\left(\left| q_{\textit{fconst}-i,\overline{\dot{q}}{}{}^{l}}^{+}-q_{\textit{rconst}+i,\overline{\dot{q}}{}{}^{l}}^{-}\right| \right)}{\overline{\dot{q}}{}{}^{l}}\times S=L\end{equation}
where
 $q_{\textit{fconst}-i,\overline{\dot{q}}{}{}^{l}}^{+}$
and
 $q_{\textit{rconst}+i,\overline{\dot{q}}{}{}^{l}}^{-}$
are the angular positions of intercepted constant velocity segments during forward and reverse motions at the velocity level
 $\overline{\dot{q}}{}{}^{l}$
. S denotes the sampling rate.
 $L$
is the number of lag points.
The aligned data are illustrated in Figure 7, and a mean positional error for
 $\overline{\dot{q}}^{15}$
between the forward and reverse stages is 0.109°. Alignment issues require particular attention at higher velocity levels due to the increased time required to reach a steady state.
The aligned angular position and velocity data for
 $\overline{\dot{q}}^{15}$
for joint3.

4.2. Evolution of steady-state friction and joint states
The steady-state friction curve can be yielded by connecting friction torque data points at each velocity level. In this section, the evolution of the steady-state friction curve from cold start to thermal equilibrium is investigated. Figure 8 shows the friction curves of joint 3 and joint 5 in two different states. To reach the thermal equilibrium, the robot manipulator undergoes reciprocating motion for more than 24 h. The cold start conditions exhibit higher friction, particularly at high velocity levels, and the impact differs between joint 3 and joint 5.
The friction curves for joint 3 and joint 5 in two different states.

The evolution of the steady-state friction curve for joint 3. (a) Transition from cold start to thermal equilibrium. (b) Transition from thermal equilibrium to cold start.

In order to observe the evolution process, a dedicated experiment is designed. Bittencourt et al. [Reference Bittencourt and Gunnarsson26] indicated that the thermal decay constant for robotic joints is approximately over 3 hours, and it takes more than twice that constant to achieve thermal equilibrium. This conclusion is consistent with the observations herein. In this experiment, the interval for the localized heating process (indices 1–5) and the cooling process (indices 6–11) has been established at 1 hour. Furthermore, to guarantee the observation of a stable thermal equilibrium state and the cold state, the intervals between the concluding heating/cooling phases have been maintained at over 24 hours (indices 5–6 and 11–12). The heating method is that each robotic joint repeatedly performs reciprocating motion according to the factory inspection trajectory (set by the manufacturer). After the machine reaches thermal equilibrium, it stops running and undergoes natural cooling without turning off the power. The results are shown in Figure 9 for joint 3 and Figure 10 for joint 5. The indices 1, 2, 3…12 in the figures refer to observations based on time series. Note that the time interval between index 5 and index 6, as well as the time interval between index 11 and index 12, is approximately 24 hours. For velocity levels greater than 3°/s, the friction decreases with running time, but a significant drop occurs in the first index interval, as shown in Figure 9(a). For the evolution state from thermal equilibrium to cold start (see Figure 9(b)), it is asymmetric to that in Figure 9(a). The behavior of curve changes can be attributed to the influence of temperature on friction. Temperature affects both the velocity-weakening region and velocity-strengthening regions. Moreover, the observed discrepancy in torque between the heating and cooling phases in the cold state is likely attributed to the distinct initial conditions of the robot’s motors. During heating, the robot initiates its thermal cycle from a fully powered-off state with cold motors, whereas during cooling, the motors remain energized for an extended period. This difference can be attributed primarily to thermal dissipation within the motors, which arises due to two main factors: the flow of electric current through the copper windings, known as the Joule effect, and the induction of eddy currents, caused by Foucault’s currents, in the ferromagnetic components resulting from the variation of magnetic flux passing through them [Reference Pagani, Legnani, Incerti, Beschi and Tiboni36]. Figure 10 shows the experimental results for joint 5. In comparison to joint 3, joint 5 exhibits higher heat dissipation efficiency, resulting in a friction curve that appears less sensitive to temperature.
The evolution of the steady-state friction curve for joint 5. (a) Transition from cold start to thermal equilibrium. (b) Transition from thermal equilibrium to cold start.

Though temperature has an influence on both velocity regions of the friction curves, the sensitivity of the two regions to temperature varies. In Figure 11, the standard deviation of the friction torque for the 12 friction curves at each velocity is calculated (indicated by the black solid line with rectangular symbols). This analysis reveals that the velocity-weakening region (friction curve area where friction force decreases with increasing velocity) is less sensitive to temperature in comparison to the velocity-strengthening region (friction curve area where friction force increases with increasing velocity). This observation can be attributed to the dominance of viscous friction, which is influenced by the dynamic viscosity characteristics of the grease. On the other hand, the cold-to-thermal friction ratio between curve 1 and curve 6 at each velocity level is also analyzed. The results indicate that this ratio initially increases with velocity and then gradually converges.
The standard deviation of friction torque at different operating times and temperatures (black solid line with rectangle symbols, left Y-axis). The cold-to-thermal friction ratio at different velocity levels (red solid line with circle symbols, right Y-axis).

5. Friction Behavior Comparison and Fault Diagnosis
Based on the preceding experiments, it can be seen that the friction curve can reflect the state of each joint in the robot manipulator. In this section, the friction characteristics are studied in the parameter space for the task of fault quantization and localization.
5.1. Parameter estimation
The model structure with 6 parameters of Eq. (11) is able to describe the friction curves. The model parameters can be divided into two categories that [
 $F_{c}$
,
 $F_{s}$
,
 $V_{s}$
,
 $\alpha$
] are associated with surface characteristics, used to describe the velocity-weakening regime, while [
 $F_{v}$
,
 $\beta$
] are related to lubrication characteristics, used to describe the velocity-strengthening regime. The nonlinear parameters
 $\alpha$
and
 $V_{s}$
jointly determine the impact range of the Stribeck effect, while
 $\alpha$
can be fixed for simplification [Reference Bittencourt and Gunnarsson26]. The parameters can be regressed by nonlinear least squares algorithm [Reference Golub and Pereyra37]. In this study,
 $\alpha$
is set as a constant of 1.3 and other parameters are solved using lsqnonlin function available in Matlab’s Optimization Toolbox while adhering to the constraints outlined in Eq. (12). The results of parameter estimation based on friction experiments conducted from a cold start to the thermal equilibrium state are presented in Figure 12. In Figure 12(a), the solid line is the predictive friction torque curve using the estimated parameters for observation 6 (thermal equilibrium state). In Figure 12, for the experimental observation indices 13, 14, and 15, friction experiments were performed by operating the manipulator with varying mass loads, specifically 2 kg under cold conditions, 2 kg under thermal conditions, and 5 kg under thermal conditions. The corresponding friction fitting curves can be seen in Figure 13. It can be seen that the parameters are affected by both temperature and load but their sensitivities are different. For instance, the coulomb and standstill friction parameter are more sensitive to load than temperature. For the Stribeck velocity coefficient, the changes induced by increased load are of a magnitude comparable to those caused by temperature variations. As for the viscous coefficient and the non-Newtonian viscous coefficient, they exhibit contrasting trends and are minimally affected by the load once the state is known. It is more intuitive in Figure 13 that load significantly influences the velocity-weakening regime but slightly influences the velocity-strengthening regime.
The model-based predictive friction curves and the parameter variations based on experimental observations for joint 3.

The friction curves of a robot manipulator with different loads on joint 3.

5.2. Construction of fault indicators
The preliminary analysis has showed how parameter changes can serve as indicators of joint states. However, in many cases, only data from healthy machines are available, and the detection of health status can be easily disturbed by cold start and thermal equilibrium states. The state variations affected by environmental factors introduce uncertainty into parameter estimates. In such cases, a statistical description of the healthy state, encapsulated by the mean value and covariance of the parameter vector, can be derived from available measurements. Thus, the healthy state indicators are constructed by the statistical description of parameter estimation obtained from a robot manipulator operating under load-free conditions during cold start and thermal equilibrium states. The measurements from the test robot manipulator can then be compared against the nominal statistics to determine whether the test manipulator is in a healthy state. A faulty one is expected to be detected as an anomaly based on these detection features. In term of detection features, prior knowledge can be utilized. As mentioned above, the velocity-weakening regime and the velocity-strengthening regime have different dependencies on the machine’s state, which means two detection features can be constructed. One feature reflects the surface properties or contact condition and the other characterizes the lubrication condition. The former is much less sensitive to temperature changes compared to the latter. In ref. [Reference Bittencourt and Axelsson27], it is shown that the effects of wear appear first in the low-velocity region while the incipient wear effect is submerged by temperature effects in the high-velocity region. Inspired by this phenomenon, an equivalent load threshold to assess the health status of a joint is presented. It is anticipated that the load torque will have significant impact on the low-velocity region of the friction curve, as it can be treated as an extended reasoning of the relation between the applied normal force and contact interaction in the context of block sliding friction. From the evolution experiments, the reasonable variation range for the friction curve of a healthy robot manipulator can be estimated. When examining the friction behavior of a manipulator (unloaded), if it is found that the friction characteristics in the low-speed region are equivalent to the friction behavior under a certain load, it indicates a significant change in the contact surface, which can be considered as an abnormality or a subject requiring further observation.
Figure 14 and Figure 15 show the case study of the robot manipulator for joint 3 and joint 5, respectively. A confidence ellipsoid for three parameters of the velocity-weakening regime and a confidence ellipse for two parameters of the velocity-strengthening regime are constructed with the mean and covariance data. Twenty sets of parameter identification results derived from the friction experiments are used, and the manipulator operates in a load-free condition. In these twenty sets of data, the friction data for cold start and thermal equilibrium are included. In Figure 14, The blue ellipsoid and ellipse show confidence regions of healthy robot manipulator parameters. The parameter uncertainties are visualized as 74% and 86.5% confidence regions, which corresponded to 2-standard deviations. For
 $N$
standard deviations spread of data, the radii of the ellipsoid will be given by:
The confidence regions for joint 3. (a) The blue and gray regions are the 2- and 6-standard-deviation ellipsoids for velocity-weakening parameters. (b) The 2-standard-deviation ellipse for velocity-strengthening parameters.

The confidence regions for joint 5. (a) The 2-standard-deviation ellipsoid for velocity-weakening parameters. (b) The 2-standard-deviation ellipse for velocity-strengthening parameters.

 \begin{equation}\boldsymbol{R}=N*\sqrt{\boldsymbol{\lambda}}\end{equation}
where
 $\boldsymbol{\lambda }$
is the eigenvalues of covariance data matrix.
Additional experimental data sets are used for comparison against the healthy region. The experiment conditions are listed in Table II. Each blue star marker represents an individual experiment test. Markers falling outside the confidence bounds can be considered outliers, while those within the bounds are either from a healthy state or have escaped detection. Due to the different sources of faults detected by the two regions, a marker may be flagged as anomalous in the view of velocity-weakening parameters (region 1, represented by the ellipsoid) but not in the view of velocity-strengthening parameters (region 2, represented by the ellipse). Three outliers are detected in the view of the velocity-weakening parameters, corresponding to experiments 4, 5, and 6 in Table II. The result aligns with the extended reasoning of the relation between the applied normal force and contact interaction, which the first three parameters [
 $F_{c}$
,
 $F_{s}$
,
 $V_{s}$
] are dominant by contact interaction while another two parameters [
 $F_{v}$
,
 $\beta$
] indicate the lubricant state.
The detection for joint 3.

To assess the severity of faults or the deviation of the healthy state, the Mahalanobis distance is utilized to quantitatively weigh the state of a test sample from the mean or median of the healthy region distribution. The Mahalanobis distance from a vector
 ${\boldsymbol{y}}$
to a distribution with mean
 $\mu$
and covariance Σ is expressed as [Reference De Maesschalck, Jouan-Rimbaud and Massart38]:
 \begin{equation}d=\sqrt{\left({\boldsymbol{y}}-\mu \right)\sum \nolimits^{-1}\left({\boldsymbol{y}}-\mu \right)^{\prime}}\end{equation}
Assuming a confidence bound of 2-standard deviations as acceptable variation for healthy data, any calculated distance greater than 2 ^ 2 = 4 will be treated as anomalous. As can be seen in Figure 14(a), the red lines mark the anomalous test samples and their distance values are displayed. Table II reveals that the distance increases with temperature and load, with the effect of load being significantly greater than that of temperature. Considering the complexity of friction, a conservative threshold for wear faulty can be given according to the data of experiment 5. Thus, the gray ellipsoid is a confidence bound of 6-standard deviations as acceptable variation for wear.
Figure 15 and Table III present the detection results for joint 5. Compared to joint 3, the friction in joint 5 is less significantly affected by the load due to the structure that the joint axis is located very close to the center of mass of the load. For a confidence bound of 2-standard deviations, it cannot differentiate between the unloaded and 2 kg-load cases. However, for the 5 kg-load case it obviously falls outside the confidence ellipsoid for velocity-weakening parameters. There are no outliers in ellipse for velocity-strengthening parameters as expected (see, Figure 14b and Figure 15b), since this region is not sensitive to the load effect.
The detection for joint 5.

In addition to quantifying the severity, the coordinate location of an abnormal sample also provides information about the states of joints. The dependencies of friction for such joints have been studied based on experiments, and the effects of the most relevant variables to the friction curve have been well summarized in ref. [Reference Bittencourt39]. Table IV illustrates how various factors influence the parameters of the steady-state experimental friction model. Each factor leads to distinct patterns of variation in terms of size and direction. For instance, the Mahalanobis distance is large along the projections of the three coordinates, which may be attributed to wear or loading effects. If the value projected on the
 $F_{s}$
axis is significantly smaller than the values on the other two axes, this may indicate the presence of a temperature effect. Therefore, the final fault diagnosis can be further performed using a pattern recognition algorithm or a knowledge-based approach.
Pattern of deviations of friction characteristic parameters induced by different types of factors in the robot manipulators.

+ +: significant increase.
∼ : scarcely influenced.
− −: significant decrease.
6. Conclusion
This study introduces a friction-based fault diagnosis method for robot manipulators focusing on the connection between tribological behavior and joint failures. The essence of this method relies on a model-based approach that incorporates parameter estimation. Since friction is greatly influenced by factors other than wear, particularly temperature, parameters with different sensitivities to temperature need to be classified based on prior knowledge of friction characteristics. According to the steady-state experimental friction model, the parameters are expected to fall into two categories characterized by distinct temperature dependencies. Based on experimental observations, two parameter ellipse regions for the healthy robot under load-free conditions are constructed to detect and isolate potential sources of faults. The ellipse associated with the velocity-weakening regime excels in detecting alterations in surface properties, making it a versatile tool for unified detection across diverse operational conditions, as it is minimally affected by temperature variations (cross-condition detection). For initial faults such as wear, which result in a qualitative performance decline only after a certain degree of deterioration, it becomes necessary to establish a threshold that signifies the extent of wear. In the experiments and literatures, it is observed that wear-induced changes in friction characteristics are similar to those caused by load effects. Thus, an equivalent load threshold is adopted as a reference to evaluate the state of a joint, which can avoid conducting costly destructive testing. In this study, two representative joints are considered, namely the joint 3 and joint 5 of the robot manipulators. The results show that due to differences in the pose and structure of the joints, the fault threshold requires dedicated designs.
Further verification of the equivalent load threshold and classification of additional incipient fault types will be the subject of our future work. It is important to note that friction is also associated with other degradation mechanisms, such as backlash growth and inadequate lubrication. Thus, the inherent relationship between faults and friction characteristics still needs to be further explored by understanding and modeling of friction and more extensive fault studies of other structural configurations of robot manipulators. Furthermore, it may be practicable to transfer this method to the field of quality control related to the large-scale production of industrial robots.
Author contribution
Xing Zhou, Shifeng Huang, Yaoqi Xian, and Huicheng Zhou conceived and designed the study. Wenbin Deng and Jian Zhou conducted data gathering. Xing Zhou and Yaoqi Xian performed statistical analyses. Xing Zhou, Shifeng Huang, and Yaoqi Xian wrote the article.
Financial support
The authors acknowledge the financial support provided by the Application and Fundamental Research Project of Guangdong Province (Project No. 2020B1515120010).
Competing interests
The authors declare no conflicts of interest exist.
Ethical approval
None.



