The coronavirus disease 2019 (COVID-19) pandemic along with many recent natural and human made disasters have again renewed the importance of public health emergency preparedness. Emergency preparedness efforts, including prevention, mitigation, and recovery activities, are used alongside disease surveillance and modeling tools to determine risk susceptibility (spread of disease) and the severity of a risk (morbidity and mortality of an infectious disease) within communities. However, since the emergence of COVID-19 in the United States in early March, 2020, the variation in surveillance models has made nationwide pandemic monitoring and containment difficult.Reference Berger, Wood, Jenkins, Olsen, Morse, Gresham, Root, Rush, Pigott, Winkleman, Moore, Gillespie, Nuzzo, Han, Olinger, Karesh, Mills, Annelli, Barnabei, Lucey and Hayman 1 Despite the US federal government declaring a national state of emergency for COVID-19 on March 13, 2020, it did not communicate a unified strategy or model for states to contain, detect, prevent, or assess COVID-19 risk. 2 In response to the absence of strong, centralized, federal guidance, North Dakota’s leaders developed their own model-based predictor on May 15, 2020, to determine COVID-19 risk across the state. The model used multiple indicators from the North Dakota health metric and assessments made by the Governor (governor’s metric) to determine the state’s overall risk. However, despite North Dakota implementing its model, the state’s COVID-19 mortality and 7-day case rates were the highest in the nation from July 1, 2020-December 31, 2020. 3,4 Examining why these events occurred is a necessary step toward improving pandemic mitigation in the future. 3,4 On July 1, 2020, the Harvard Global Health Institute and the Edmond J. Safra Center for Ethics also developed a model determined to detect COVID-19 risk within North Dakota. Its criteria for determining risk differs greatly from the North Dakota model, and as result, it communicates a different COVID-19 severity and risk from July 1, 2020-December 31, 2020.
High Case Rates Following Model’s Development
North Dakota gained national attention on August 26, 2020, when they became the state with the highest 7-day COVID case rate. They would carry this distinction for 99 days (apart from September 1-3) until December 1, 2020. North Dakota was also the state with the highest 7-day COVID mortality rate on September 23, 2020, and remained so for 58 days until November 19, 2020. 3 Despite this COVID-19 burden, at the peak of state-wide cases in August, zero counties had their risk status elevated to critical by the responsible state health agencies, and none of the counties were elevated to higher risk until September 4, 2020. 3,4 As a result of loose guidelines and varying county-level risk assignment, businesses continued to operate as if COVID-19 risk in North Dakota was not a threat, and preventative public health measures, including mask mandates and stay-at home orders, were not prioritized.
Harvard Global Health Institute’s Model-Based Predictor
Another model-based predictor designed during the pandemic was the “Key Metrics for COVID-19 Suppression” framework or Harvard health metric. 5 Developed on July 1, 2020, by research, policy, and public health experts from Harvard’s Global Health Institute and the Edmond J. Safra Center for Ethics, the framework’s intent was to provide a clear approach for assessing COVID-19 risk and suppressing COVID-19 impact across the nation. 5 While North Dakota used multiple criteria to determine COVID severity, Harvard’s health metric strictly utilized daily new cases per 100,000 on a 7-day rolling average for risk assessment. The Harvard health metric also provided guidance on the intensity of efforts required to contain COVID-19 at each risk level. 5 The Harvard health metric tracked North Dakota’s COVID risk and indicated the state was nearing critical-risk status much earlier than the North Dakota and governor’s health metric had.
The purpose of this study is to: (1) compare the performance of 3 methods (the North Dakota health metric, the governor’s metric, and the Harvard health metric) of assessing North Dakota’s COVID-19 severity on 4 select dates, and (2) to determine which metric provides policy-makers with enough guidance and time for public health intervention implementation that would result in the greatest reduction in cases and deaths during a pandemic.
Methods
North Dakota’s Health Metric Model
North Dakota’s model based predictor was derived from “North Dakota Smart Restart Program” which had intent to inform businesses and industries of COVID-19 risk in their counties throughout the pandemic. 2 The model’s architects were North Dakota’s Governor, the “North Dakota Economic Resiliency Team” (comprised of state-level departmental heads), and consultations from those in the “North Dakota Industry Working Group”, (comprised of industries directly impacted by the mitigation measures). 2
The North Dakota model used a health metric based on 3 criteria for assessing COVID-19 risk: (1) active cases per 10,000, (2) tests administered per 10,000, and (3) test positivity rate. All criteria were measured on a 14-day rolling average, and each of these criteria were graded individually on a 5-point color-coded scale to assess risk. 3 Additionally, the model was supported by the governor’s assessment of COVID-19 risk (the governor’s metric) communicated from July,1, 2020-December,2020 through press conferences using the 3 criteria listed above. 4
Data Sources
To determine COVID risk assignments across metrics, data were obtained from 3 sources. First, the North Dakota health metric data, as mentioned above (active cases per 10,000, tests per 10,000 and test positivity rate) was obtained through the North Dakota Department of Health (NDDoH) database. 3 The COVID-tracker website provided data for cases and deaths within North Dakota. 3 Adhering to the CSTE 2020 definitions, North Dakota identified a “case” of COVID-19 as a confirmed and probable. Confirmed cases include only a positive polymerase chain reaction (PCR) or nucleic acid amplification test (NAAT) test performed in a laboratory setting compared to probable cases which do not require PCR or NAAT tests. Probable cases are defined by clinical presentation and do not require a laboratory test for confirmation. Probable cases may also include those persons who have been previously linked to a confirmed case. Data for the 3 metrics came from various sites, including testing centers, hospitals, and intensive care unit (ICU) admissions. 3,6 Using this data and 2019 census data, NDDoH calculated a 14-day rolling average for each of the 3 components of the metric (active cases per 10,000, tests per 10,000, and test positivity rate) and assigned each component an individual risk score. The risk level of each component was scored as follows: 1 (new-normal, blue), 2 (low-risk, green), 3 (moderate-risk, yellow), 4 (high-risk, orange), and 5 (critical-risk, red).These 3 component risk scores were then averaged to produce 1 composite risk score (ie, North Dakota health metric; range of 1-5) on July 1, August 26, September 23, and November 13, 2020. These dates were used because they demonstrate the variability of COVID-19 risk within North Dakota over an extended period. These scores were used to grade the 53 counties of North Dakota throughout the pandemic (Table 1). 3 Second, North Dakota’s governor’s metric assignments were obtained from the COVID-19 Response press conferences held by NDDoH. 4 The North Dakota’s governor’s office adjusted the composite score (ie, North Dakota health metric listed above) for counties on 8 dates (May 29, September 4, September 25, October 9, October 16, October 30, November 6 and November 10, 2020) and reported a state risk level between 1 and 5. Last, the Harvard health metric used data (daily new cases per 100,000 on a 7-day rolling average) submitted by 50 states. 2,5 The Harvard health metric was then ranked on a scale of 1 (green-low risk), 2 (moderate-risk community spread, yellow), 3 (accelerated-risk community spread, orange), and 4 (critical-risk, out-of-control spread, red). 5
Harvard and North Dakota Health Metric with Unified Risk Levels New Normal and Low Risk

Note: North Dakota and Harvard health metric criteria and combines risk levels 1 (blue-new normal) and 2 (green-low risk) from North Dakota health metric to equal Harvard health metric risk level of 1 (green-low risk).
Comparing Models
The North Dakota model based predictor (North Dakota health metric and governor’s metric) used a different scale to assign COVID risk than the Harvard health metric. As such, the North Dakota health metric and the Governor’s metric were readjusted to a 4-point scale to compare against Harvard’s health metric 4-point scale. This was done by merging North Dakota’s 1 (new normal, blue) and 2 (low-risk, green) into Harvard’s 1 (low-risk, green) category (Table 1). 3,5
Statistical Analysis
The following dates were used to compare the metrics and their risk assignments: July 1 (date that Harvard’s health metric was adopted), August 26 (date that North Dakota had the highest 7-day COVID case rate in United States), September 23 (date that North Dakota had the highest 7-day COVID mortality rate in the United States), and November 13, 2020 (date that North Dakota implemented a statewide mask mandate). With the unified 1 to 4 scale the average risk across 53 counties on each day were defined as follows: 1 to 1.49-green-low risk (1), 1.50 to 2.49- yellow moderate risk or community spread (2), 2.50 to 3.49-orange, high risk or accelerate spread (3) and 3.50 to 4.0- red, critical risk (4) or out-of-control spread. 3–5 The chi-squared test was performed to compare the 4 risk levels for each of the 3 metrics in pairwise manner, to determine if different health metrics resulted in different COVID risk designations. Significance was set at α = 0.05. All figures, tables, graphs, and calculations were developed using Microsoft Excel 2016.
Results
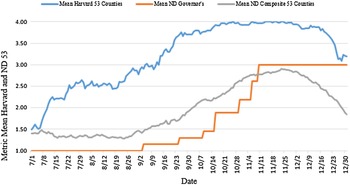
On July 1, 2020, there was not a significant difference in the risk appraisal between the Harvard health metric (1.49) and the North Dakota health metric (1.4) (Table 2; row 1). However, the governor’s risk assessment (level 1) was already falling below what the North Dakota health metric reported, and this difference was statistically significant (Table 2; row 2). After July 1, 2020, the Harvard health metric average risk across 53 counties continued to increase (Figure 1). The North Dakota health metric average risk across 53 counties indicated risk was decreasing until August 26, 2020. The governor’s metric consistently remained at 1.0, green, which represented low risk, even through August (Figure 1). This disparity between the governor’s reported risk, and the risk level of the North Dakota health metric persisted until November 11, 2020, and the difference between both the North Dakota health metric and the governor’s reported risk was significantly below the Harvard health metric throughout the entire duration of the pandemic (Figure 1).
Chi-squared test to compare the 3 metrics: A comparison of the metrics (Harvard and ND) and (Governor and ND) to the risk levels each metric assigned (1 to 4) on July 1, 2020, August 26, 2020, September 23, 2020, and November 13, 2020

Comparison of Harvard, North Dakota, and Governor’s daily metrics average across North Dakota’s 53 counties from July 1, 2020 to December 31, 2020. Display of average risk scores ranging from 1-1.49 (1), 1.5-2.49 (2), 2.5-3.49 (3), 3.5-4 (4) using three health metrics.

On August 26, 2020, North Dakota experienced the highest 7-day COVID case rate in the nation, and variations of COVID risk occurred across all 3 metrics (Figure 1). Compared to the North Dakota health metric, the Harvard health metric indicated an average risk of 2.77, or orange, representing accelerated community spread across 53 counties (Figure 1). The Harvard health metric called for stay-at home orders for this risk level to suppress COVID spread. The North Dakota Health metric on August 26, 2020, remained in green-low risk, meaning it was on track for containment, indicating an average risk of 1.31 across 53 counties (2 categories below the Harvard health metric). No preventative measures were advised to control the intensity of the pandemic on this day using the North Dakota metric. Despite the high case rate on August 26, 2020, the governor’s metric still indicated a 1.0 (green-low risk), and no public health interventions where taken (Figure 1). Chi-squared test results were statistically significant for differences in COVID risk levels assignments across all metrics after July 1 (Table 2).
On September 23 when North Dakota had the highest 7-day COVID mortality rate of all states, the Harvard health metric designated all North Dakota counties as critical risk status, or red status, representing out of control spread. At this stage, the Harvard health metric deemed stay-at home orders necessary to control the spread of COVID-19. The average risk across all counties using the Harvard health metric was 3.64 compared to North Dakota’s health metric which was only 1.69 indicating moderate risk, yellow status, representing some community spread. Despite the governor’s metric increasing slightly after August 26, 2020, from 1.0 to 1.15 on September 6, 2020 (green-low risk), on September 23, 2020, when North Dakota’s COVID-19 mortality rates peaked, the governor’s average risk score across all counties was only 1.16 (green-low risk), and chi-squared test results confirmed the statistical significance of this difference (Table 2).
When a mask mandate was implemented in North Dakota on November 13, 2020, the Harvard health metric average score across all North Dakota counties was 3.98 (red-out of control spread). The North Dakota health metric’s assigned risk began increasing after September 23, 2020, from 1.69 (green-low risk) to 2.8 (orange-accelerated community spread) a week prior to mask mandates on November 7, 2020. The governor’s metric on this day was 3.0 (orange-accelerated community spread) (Figure 1).
The governor’s metric indicated varying levels of risk after September 1, 2020, but it was below the North Dakota health metric until November 13, and never matched the Harvard health metric (Figure 1). For example, on September 4, 2020, the Governor changed risk designation for 8 counties from low to moderate risk, while lowering risk status to blue (new normal) in 13 counties. The result of this on the adjusted scale (1 to 4) was for the entire state to remain at a green low- risk status from September 4, 2020-October 16, 2020, (Figure 1). By lowering the risk in a few counties, the net effect placed the entire state at green-low risk of COVID-19 spread. In addition to this, while both Harvard and North Dakota metric reflected changing risk daily, the governor’s metric would change and stabilize for weeks until he communicated a different risk level. This delayed approach kept North Dakota in a green-low risk state even when cases were the highest in the nation on August 26, 2020 (Figure 1).
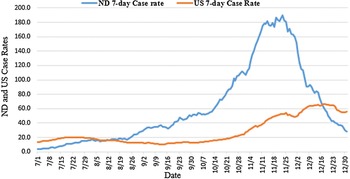
Data obtained through the COVID-tracker website indicated on August 26, 2020, North Dakota’s 7-day mortality and case rates surpassed the rest of the nation with North Dakota reporting 29.0 cases per 100,000 compared to the US reporting 12.6 cases per 100,000 (Figure 2). Despite the Governor assigning the state to a green low-risk (1) level, case rates continued to increase from August 26, 2020, until they peaked on November 23, 2020 (189.3 cases per 100,000) (Figure 2). The 7-day case rate and mortality rate climbed steadily after August 26, 2020, with little mitigation measures to control the high case rates and community spread. In the days prior to adopting its mask mandate, on November 9, 2020, North Dakota’s 7-day mortality rate was 2.31 per 100,000, and the rate remained high until a second peak on December 3, 2020 (Figure 2).
Comparison of North Dakota and US 7-day case rate from July 1, 2020 to December 31, 2020.

Limitations
While these findings are a call to action for the use of proactive approaches North Dakota could have used to mitigate COVID-19 risk or severity, a few limitations are worth noting. First, the quality and reliability of the data used within this study could be compromised by variability in testing facilities and inaccurate interpretation of test positivity in hospital settings and clinics. This would make daily comparisons of the testing metric inconsistent across the state. Furthermore, while this study communicated the consequences of using majority testing components to determine COVID, it is unclear whether they pose a threat in other models using similar metrics. The state of Kentucky utilized a model similar to North Dakota’s and with similar testing components and a composite score; however, the state’s model weighed each metric equally to reduce confusion and monitored escalating COVID-19 risk by assigning mask mandates in high-risk settings. Reference Varela7 North Dakota’s neighboring states, Minnesota and Montana, implemented mask mandates on July 25, and July 15, 2020, respectively, and had substantially lower cumulative COVID mortality rates than did North Dakota. 3
Discussion
Upon reviewing and comparing COVID risk assignments by the 3 metrics on 4 select time points, it is evident that the North Dakota health metric and the governor’s metric underrepresented the severity of the COVID-19 outbreak in North Dakota and delayed communicating this across North Dakota’s counties compared to the Harvard health metric. The “North Dakota Smart Restart Program” substantially understated the risk of COVID-19 and ultimately delayed implementation of mask wearing and social distancing, resulting in extraordinarily high case and mortality rates in North Dakota. Reference Jeane8
To help explain this delayed response, a deeper look at the construction of the North Dakota health metric is needed. First, the North Dakota health metric had 2 testing components (tests administered per 10,000, test positivity rate) and 1 incident component (14-day average active cases) when determining a risk score. This became problematic for North Dakota when COVID risk was understated despite North Dakota’s leaders touting their testing program was the highest per capita in the nation. Reference Karlgaard9 Under North Dakota’s original 5-point scale, if a county’s active case score were 5 (critical risk) and the county was testing extensively giving a testing score of 1 (new-normal) and a moderate test positivity rate of 9% giving a score of 3, the average North Dakota health metric score would be 3 (5+1+3=9/3). 2,3 This would indicate moderate risk for an entire county, despite that county having a high number of active cases indicating critical risk. As North Dakota’s active cases were increasing after July 1, 2020, the overall health metric indicated a slowly decreasing risk. At the same time, the Harvard metric reported North Dakota’s cases climbing and the situation worsening from July 1 to August 26, 2020. The Harvard health metric thus illustrates the high risk of COVID spread by using only incidence of COVID-19 to measure health risk. 5 In this way, the risk is not outweighed by other criteria such as number of tests performed and test positivity that do not reflect the real risk of a county. 6
The second problem is North Dakota’s use of a 14-day vs 7-day rolling average. The 14-day rolling average allowed for attenuation or a leveling of risk thus underestimating the current risk level, compared with Harvard’s 7-day average. An extremely high number of cases would need to be sustained for the North Dakota health metric to detect current public health concern that would need immediate action. What’s more, with a pathogen having an incubation period of 4-5 days, a 14-day rolling average is insufficiently sensitive to the viral spread through the community. As such, North Dakota remained in low-risk without the guidance to adopt preventative measures, such as reducing capacity in public spaces, stay-at home orders, and mask mandates. In contrast, the Centers for Disease Control and Prevention (CDC) and Harvard’s health metric uses a 7-d rolling average to assess COVID risk across the United States. Reference Varela7 The Harvard metric consistently indicated increasing risk across counties on days where North Dakota gained national attention (August 26 and September 23, 2020) the North Dakota and governor’s metric still assigned these counties green-low risk. Reference Jeane8
If designed appropriately, model-based predictors can also assist in the mobilization of human and financial resources necessary to optimize outbreak response. Reference Berger, Wood, Jenkins, Olsen, Morse, Gresham, Root, Rush, Pigott, Winkleman, Moore, Gillespie, Nuzzo, Han, Olinger, Karesh, Mills, Annelli, Barnabei, Lucey and Hayman1,Reference Hitchcock, Chamberlain, Van Wagoner, Inglesby and O’Toole10-12 As such, these models ought to be driven by scientific evidence-based approaches and supported by individuals in the health community. For the case of North Dakota, the model was designed by leaders mainly comprised of the Economic Resiliency Team as well as the Industry Working Group who primarily advocate for the economic interests of employees across the state. 2,Reference Norris, Sawin, Ferri, Raques Sastre and Porgo13 While these individuals are fit to advocate for employees in North Dakota, they may lack the expertise to develop a health metric model for the entire state. In comparison, the Harvard health metric was designed by public health experts from leading institutions and organizations (Harvard University, John Hopkins University, University of Pennsylvania, University of Washington, University of Minnesota, and Microsoft research). 5
Essential to risk preparedness is the ability to apply valid health metrics for appraising the severity of an infectious disease outbreak. Managing risk would require states to implement models with early warning components and associated program monitoring functions. These essential components assume models are subject to change and demands health officials develop appropriate responses to escalating risk early. Prior to August 26, 2020, North Dakota’s leaders could have monitored and intervened to reconsider the potential flaws in the model and its effect on the rising mortality rate and high-risk across the state. Mask wearing was delayed, and a response was coordinated after mortality rates peaked. A warning component was not embedded in North Dakota’s model to take preventative measures prior to outbreaks experienced in social settings, businesses, and nursing homes.
For severe acute respiratory syndrome coronavirus 2 (SARS-CoV-2) and similar viruses that are highly transmissible, warning components should extend beyond the state’s local community. Government and state leaders must find the will to collaborate across state borders to communicate escalating risk and promote solutions together. Reference Jayasinghe, Weerawarana and Jayaweera14,15 These efforts must be prompted and supported by the federal government, which has the capacity to extend additional resources when necessary. Concerning the United States, in matters of health, states have primary authority, and the federal government intervenes under 2 conditions. First, the health threat exceeds more than 1 state, and second, when a threat is beyond a state’s capacity to control or respond. Reference Altman16 These criteria were met, but a coordinated response at the federal level was lacking, thus exacerbating and extending the severity of the COVID-19 pandemic. 15 The federalist approach has significant consequences for how leaders respond to COVID-19 across states. 17,Reference Haffajee and MM18 Federal emergency preparedness and guidance efforts were designed for viruses like SARS-CoV-2. With the goal to protect the health of all citizens, federal level authorities must guide collaboration based on the best scientific evidence. This would require a multi-sectoral strategy to ensure coordination in decision-making across state borders. Reference Karlgaard9,15,Reference MacLehose, Brand and Camaroni19,20
The Harvard health metric offered a proactive approach toward containing COVID-19. The risk levels and metric used aligned with the growing risk across North Dakota’s counties. The metric was absent of other criteria including test positivity numbers and tests administered which enabled it to accurately reflect the risk of COVID-19. The health metric not only gave guidance on risk levels, but also provided guidance on the necessary approaches to contain spread at each risk level. As of July 2, 2021, the CDC continues to use a similar 4-level system model. Reference Varela7,Reference Osterholm and Olshaker21,22 The Harvard health metric was ahead of its time, and it should be considered as a national standard of risk assessment in future pandemics. 23 If North Dakota had used this metric, it would have provided the state the opportunity to assess cases accurately and intervene, as necessary. Reference Osterholm and Olshaker21
Conclusions
Model-based predictors have a meaningful effect toward communicating risk and reducing the spread of infectious diseases including COVID-19. When comparing North Dakota’s health metric to Harvard’s health metric, it was evident that North Dakota’s health classification underestimated risk. By communicating a low-risk status, North Dakota’s metric and the governor’s metric did not allow for necessary adoption of preventative measures. Consequently, many citizens did not change their normal behaviors until after mortality rates had reached the devastating levels. Only after adopting mask mandates did North Dakota meet the rest of the United States in containment of the virus. The observations outlined in this study show that model-based predictors give guidance to the population, to the health-care sector, and to policy decision-makers.
Finally, the findings are a call for action from the federal government that provided little guidance nationwide and left states to act independently. The federal government must reconsider where resources should be allocated. Since 1970, we have experienced over 30 infectious disease outbreaks that are of concern to our nation’s security. For the national health agencies such as the Centers for Disease Control and Prevention (CDC) to lead effectively in the future, they must be empowered with resources and decision-making capacity. The federal government must also utilize epidemiological and public health expertise to advance the credibility of such guidance. For this to occur, states should use model-based predictors to relay the risks of infectious disease in a timely manner. As more research becomes available, studies like this one, should be used to guide policy-makers and those in health capacities to consider proactive models.
Acknowledgments
The research team thanks co-authors Hohman A., Strand M., Shyllon O, Jansen. R, McDonough S. for their substantial contributions in providing further contextual and intellectual content within the manuscript and in assisting to create and edit data tables and figures within the manuscript.
Author contribution
Savita Sidhu: Developed and edited manuscript concepts and intellectual content and created graphs and tables, combined author’s contributions into the manuscript’s final product; Adam Hohman: contributed additional intellectual content of manuscript; Mark Strand: Developed research plan to address content of the article, continuously monitored research team, edited manuscript; Omobosinuola Shyllon: Contributed intellectual content of manuscript; Rick Jansen: Edited manuscript, assisted in development of tables; Stephen McDonough: Contributed to intellectual content of manuscript.
Funding
This research received no specific funding from public, commercial, or not-for-profit sectors.
Competing interests
None.
Ethical standard
This article does not contain any studies involving human participants performed by any of the authors.