I. INTRODUCTION
Zr-based BMGs have attracted much attention in the past decades due to their high glass-forming abilities and unique combination of superior strength (∼1.9 GPa), Young's modulus up to 100 GPa, and high elastic strain limit of around 2%. Reference Suryanarayana and Inoue1 The corrosion resistance of the alloys is also very good, and is better than a lot of other crystalline alloys or stainless steels. Reference Zhang, Li, Pan, Guo, Zhang and Liu2 These properties together with good formability in the supercooled liquid region make the bulk metallic glasses a promising engineering material for some niche applications like ball bearings for shot-peening and micromotors. Reference Jin and Löffler3–Reference Jiang, Nie, Li, Jin, Chang, Huang and Jiang6 Zr–Co–Al BMGs are a recently developed BMG system with good mechanical properties and corrosion resistance. Reference Zhang, Wang, Qiang, Wang, Wang, Li, Shek and Dong7–Reference Wada, Zhang and Inoue10 The critical diameter for glass-forming of Zr–Co–Al BMGs is up to 18 mm. Reference Pang, Zhang, Asami and Inoue11,Reference Wada, Qin, Wang, Yoshimura, Inoue, Sugiyama, Ito and Matsushita12 Recently, silver was introduced to this system for enhancing the glass-forming ability and the critical diameter increased up to 20 mm. Reference Hua, Pang, Li, Wang, Li, Georgarakis, Yavari, Vaughan and Zhang13 In addition to the above considerations, the corrosion and oxidation resistance are also important factors for industrial application.
BMGs are structurally homogeneous and have no grain boundaries and defects like dislocations. They in general do not suffer from nonuniform corrosion. However, impurities inevitably exist in practice and will upset the uniform structure of BMGs. In addition, the surface atoms of BMGs are more active and have higher energy compared to the surface atoms of crystalline alloys. Reference Zhang, Li, Pan, Guo, Zhang and Liu2,Reference Cao, Zhang and Shek14 Amorphous alloys therefore sometimes exhibit lower corrosion resistance compared to their crystalline counterparts.
The study of the corrosion behaviors of BMGs is useful for designing methods to improve the corrosion resistance of BMGs, such as spraying, Reference Carvalho, Borges, Branco and Pereira15,Reference Verne, Ferraris, Ventrella, Paracchini, Krajewski and Ravaglioli16 controlled oxidation, Reference Nie, Yang, Chen, Yeap, Zeng, Li, Pan, Wang, Cao, Ding and Jiang17,Reference Nie, Yang, Ma, Chen, Yeap, Zeng, Li, Pan, Wang, Cao, Ding and Jiang18 ion implantation, Reference Tao, Yang, Bai, Mu, Li, Xie and Chen19,Reference Tao, Yang, Mu, Chen and Xie20 and laser processing. Reference Basu, Samant, Harimkar, Dutta Majumdar, Manna and Narendra Dahotre21,Reference Riahi22 It is important to determine the resistance of the Ag-bearing Zr–Co–Al BMGs to harsh environment when assessing its viability for various applications. In this paper, the corrosion and oxidation behaviors of Zr–Co–Al and Zr–Co–Al–Ag BMGs under different conditions are reported. The effects of different silver contents in the system are discussed.
II. EXPERIMENT PROCEDURES
A. Sample preparation and characterization
Zr–Co–Al–Ag ingots were prepared by arc melting mixtures of pure Zr (99.9 wt.%), Al (99.99 wt.%), Co (99.99 wt.%), Ag (99.9 wt.%) metals in a Ti-gettered argon atmosphere. These ingots were remelted three times to improve their compositional homogeneity. BMG rods of 3 mm diameter were produced by copper mold suction casting technique. Samples of four different compositions in atomic percentage, namely, Zr56Co28Al16, Zr54.32Co27.16Al15.52Ag3, Zr51.52Co25.76Al14.72Ag8, and Zr49.84Co24.92Al14.24Ag11 were prepared.
The rods of Zr–Co–Al–Ag BMGs were cut into disc shapes with thickness of 1–2 mm. A Philips X’Pert PRO x-ray diffraction (XRD; Royal Philips, Eindhoven, Netherlands) was used to confirm the amorphous structure of the samples. The thermal stabilities of the samples were measured with a Perkin Elmer differential scanning calorimetry (DSC) 7 (PerkinElmer, Waltham, MA) using a constant heating rate of 20 K/min in a purified argon atmosphere. The samples for corrosion tests were attached on a copper cube of 1 cm × 1 cm × 1 cm size with silver adhesive. The samples on copper cubes were then mounted in epoxy. All the sample surfaces to be exposed to corrosive media were ground with sandpaper down to 800 grit. Alumina suspension was then used to polish the surfaces to mirror finish. The edges of the samples were covered by nail polish.
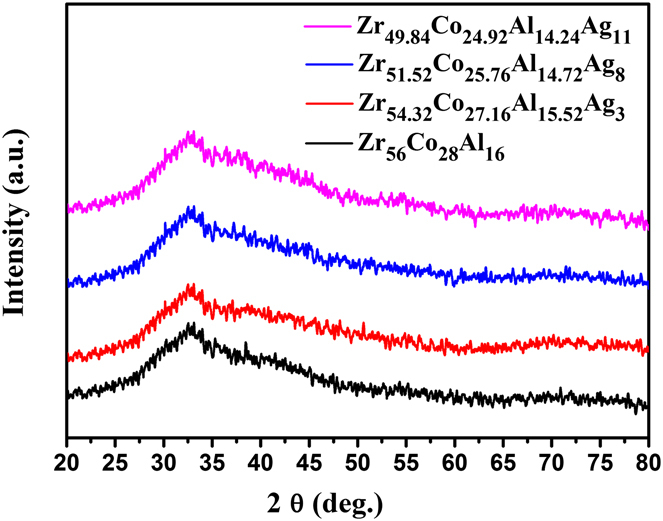
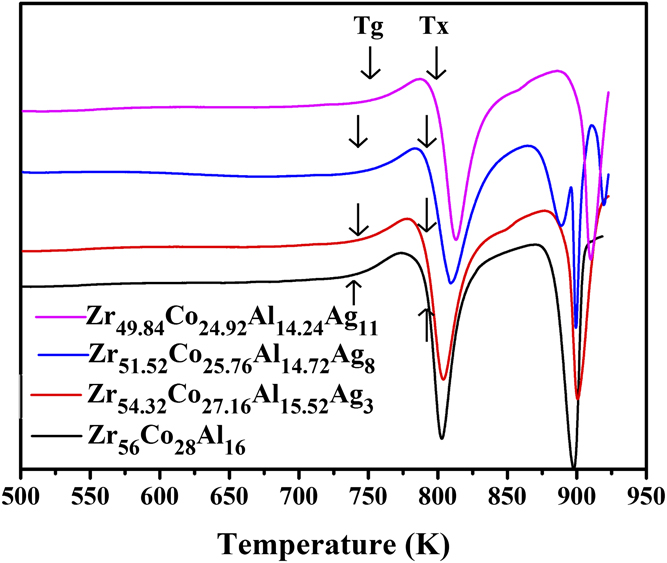
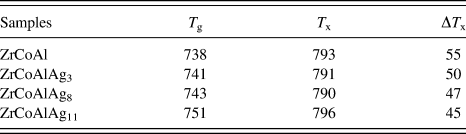
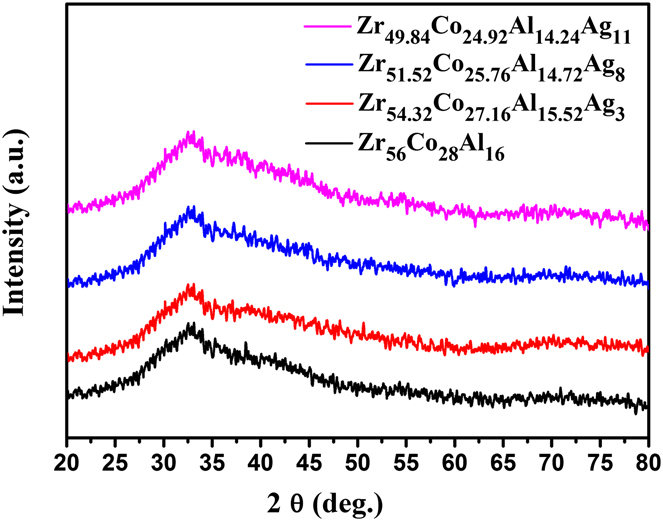
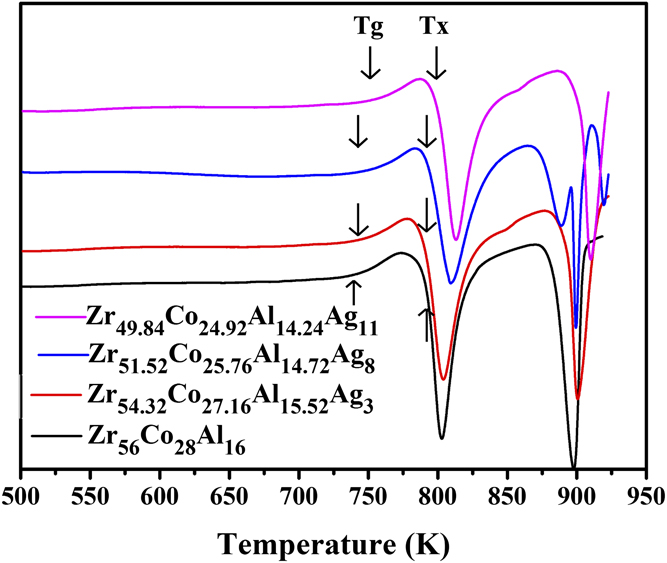
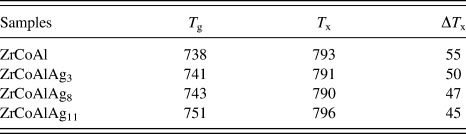
Figure 1 shows the x-ray diffraction patterns of the Zr–Co–Al–Ag alloy samples with different silver contents. Only broad peaks were found in the XRD traces, indicating the formation of amorphous structures. Figure 2 shows the DSC curves of the BMG samples, all of which exhibited a distinct glass transition followed by a supercooled liquid region before crystallization. The glass transition temperature T g, the onset crystallization temperature T x, and the supercooled liquid region ΔT x(=T x − T g) are listed in Table I. T g increased monotonically from 738–751 K (a difference of 13 K) with different Ag contents, whereas T x remains more or less constant (a difference of only 6 K), leading to the decrease of ΔT x from 55 to 45 K.
XRD patterns of Zr–Co–Al–Ag BMGs with different silver contents.
DSC curves of Zr–Co–Al–Ag BMGs with different silver contents.
Summary of the thermal parameters of Zr–Co–Al–Ag BMGs with different silver contents.
B. Potentiodynamic polarization experiments and immersion tests
All electrolyte solutions were prepared with analytical grade chemicals and deionized water. Potentiodynamic polarization experiments were done with an electrochemical workstation. The reference electrode was a saturated calomel electrode (Hg2Cl2/KCl) and the samples were treated as the working electrode, with a graphite rod as the auxiliary electrode. The corrosion mediums were 0.5 mol/L NaCl solution (pH ∼ 7) and 1 mol/L H2SO4 solution (pH < 0.5), respectively. After the polarization experiments, the morphologies of the top surfaces were observed using a JEOL JSM 820 scanning electron microscope (SEM; Japan Electron Optics Laboratory Company, Tokyo, Japan). Chemical composition analyses were conducted using energy dispersive x-ray spectrometers (EDX) attached to the SEM.
Immersion tests were also carried out. Before the tests, the weight, thickness, and diameter of the samples were measured. The solutions were in contact with air to simulate the real environment. After the tests, the samples were washed with deionized water and the weights were measured after drying. The average rate of corrosion was calculated by the following formula Reference Suryanarayana and Inoue1 :
 $${R_{{\rm{corr}}}} = 8.76 \times {10^4} \times w/(a \times {\rm{\rho }} \times t){\rm{\quad,}}$$
where R corr is the average rate of corrosion, w is the corrosion weight loss, a is the actual corrosion area, ρ is the density of the sample, and t is the time of corrosion.
C. Thermogravimetric analyses
Both sides of samples for thermogravimetric analysis were polished with sandpaper and then washed with acetone to ensure the cleanliness of the surface. The mass gain during oxidation was measured by thermogravimetric analyzer (TGA Q50, TA Instruments, New Castle, DE) in synthetic air with a constant flow rate of 50 mL/min. The heating profile consisted of a rapid heating ramp from room temperature to the desired temperature (between 673 and 923 K) and was then held isothermally for 5 h. After oxidation, the morphologies of the top surface and cross-section were observed with SEM. Chemical composition analyses were conducted using EDX attached to SEM.
III. RESULTS
A. Potentiodynamic polarization experiments and immersion tests
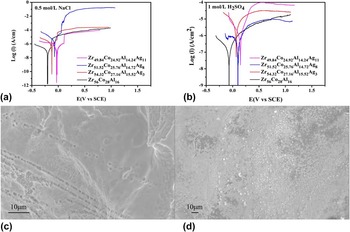
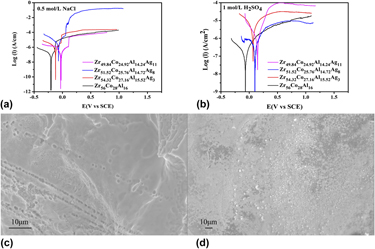
Figure 3(a) shows the polarization curves of the Zr–Co–Al–Ag BMGs with different silver contents in 0.5 mol/L NaCl solution at room temperature. The BMG samples were passivated with low passive current densities which indicate that the BMGs had good passivity in 0.5 mol/L NaCl solution. The corrosion potential (E corr) increased when the silver content increased which indicated that the corrosion resistance increased. E pit − E corr is a parameter showing the stability of the passive film. The E pit − E corr of the Zr–Co–Al–Ag BMGs with 11 at.% Ag and 8 at.% Ag are 0.22 V and 0.17 V, and less pitting existed on BMGs with 8 at.% and 11 at.% Ag. Increasing silver content would therefore improve the stability of the passive film on Zr–Co–Al–Ag BMGs.
Potentiodynamic polarization curves of Zr–Co–Al–Ag BMGs with different silver contents in (a) 0.5 mol/L NaCl solution; (b) 1 mol/L H2SO4 solution. Grown out pits of Zr–Co–Al–Ag BMGs with (c) no silver; (d) 11 at.% silver corrode in 0.5 mol/L NaCl solution.

Figure 3(b) shows the polarization curves of the Zr–Co–Al–Ag BMGs with different silver contents in 1 mol/L H2SO4 solution at room temperature. The corrosion resistance of Zr–Co–Al–Ag BMGs increased with increasing Ag content as indicated by the increasing corrosion potential (E corr). There was no pitting during the corrosion process in H2SO4 solution.
Figures 3(c) and 3(d) show the grown out pits formed on the BMG samples with different silver contents in 0.5 mol/L NaCl solution. It is found that there are some hemispherical corrosion pits on Zr–Co–Al BMGs. On the other hand, some white corrosion products instead of hemispherical corrosion pits can be found on Zr–Co–Al–Ag BMG with 11 at.% Ag. The white corrosion products had strong binding force with the surface as revealed by the fact that the products could not be removed by washing with deionized water. The BMGs with or without silver are thought to have different corrosion mechanisms in 0.5 mol/L NaCl solution. Compared to the overall sample compositions, the contents of zirconium and aluminum at the pits were lower than that of the normal sample surface according to the EDX results.
There was no measurable weight loss in the four samples after the 2-week immersion tests in 0.5 mol/L NaCl solution and 1 mol/L H2SO4 solution, respectively. The average corrosion rate of the alloy is therefore less than 1 μm/year Reference Suryanarayana and Inoue1 and it exhibited the high corrosion resistance of Zr–Co–Al–Ag BMGs in normal service circumstances.
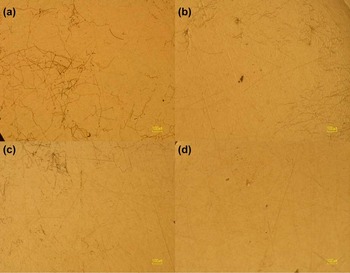
Figure 4 shows the surface morphologies of Zr–Co–Al–Ag BMGs with different silver contents immersed in 0.5 mol/L NaCl solution. All the BMG samples had pitting on the surface, especially dense on the Ag-free BMG. For the BMGs containing 3 at.% and 8 at.% silver, the corrosion pits significantly reduce, while there are no obvious corrosion pits on the surface of BMG containing 11 at.% silver. The addition of silver improved the pitting resistance of the BMGs obviously.
Surface morphologies of Zr–Co–Al–Ag BMGs with (a) no silver; (b) 3 at.% silver; (c) 8 at.% silver; and (d) 11 at.% silver immersed in 0.5 mol/L NaCl solution.

B. Thermogravimetric analyses
According to the DSC curves shown in Fig. 2, the temperature range for the oxidation study was selected in the temperature range of 673–873 K to cover the range from far below T g to above T x.
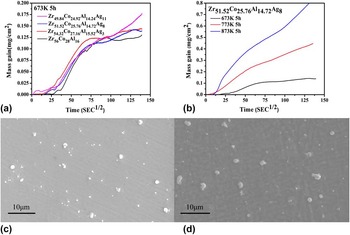
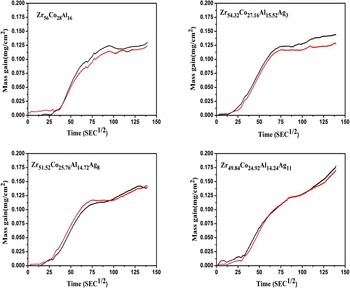
Oxidation kinetics of Zr–Co–Al–Ag BMGs with different silver contents at 673 K are shown in Fig. 5(a). Almost all the oxidation kinetics behavior obeyed a two-stage parabolic rate law, which is similar to that of Zr–Co–Al BMGs. Reference Cao, Zhang and Shek14 An initial transient oxidation and a steady-state oxidation make up the two-stage kinetics. Comparing the four curves, the differences between them were not particularly evident. Only the alloy with 11 at.% Ag had shorter transition time and higher oxidation rate especially during the steady-state oxidation. The addition of 11 at.% Ag reduced the oxidation resistance of Zr–Co–Al–Ag BMGs. The experiments were repeated and the results of the oxidation at 673 K are shown in Fig. 6. All the results had excellent reproducibility.
Mass gain (mg/cm2) versus time (s1/2) for Zr–Co–Al–Ag BMGs with (a) different silver contents at 673 K; (b) 8 at.% Ag at 673, 773, and 873 K. Surface morphologies of Zr–Co–Al–Ag BMGs with 8 at.% Ag oxidized at (c) 773 K; (d) 873 K.

Mass gain (mg/cm2) versus time (s1/2) for Zr–Co–Al–Ag BMGs with different silver contents at 673 K.

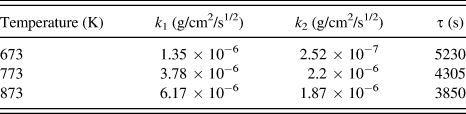
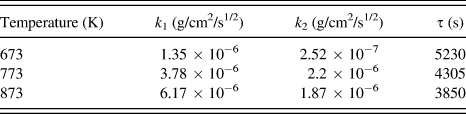
The Zr–Co–Al–Ag BMG with 8 at.% Ag was selected to perform oxidation at different temperatures, namely, 673, 773, and 873 K. The temperature at 673 K is lower than T g and the sample was still amorphous. At 773 K, the alloy was in the supercooled liquid region, while the alloy was partly crystallized when the temperature was 873 K which was higher than the first crystallization peak. Oxidation kinetics of Zr–Co–Al–Ag BMGs with 8 at.% Ag at 673, 773, and 873 K are shown in Fig. 5(b). The rate of oxidation increased when the temperature increased. The values of the transition time between the two stages and the rate constant k at different temperatures and stages were found by linear regression and are listed in Table II.
Variation of parabolic rate constant (k, g/cm2/s1/2) with temperature (K) at different stages, τ (s) is the transition time between the first stage and the second stage.
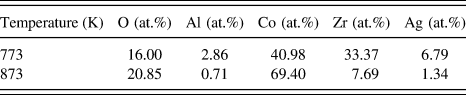
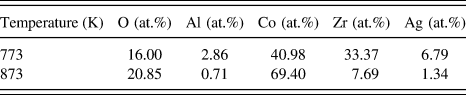
The surfaces of the Zr–Co–Al–Ag BMGs with different silver contents and oxidized at 673 K had no significant change. The oxide layers were too thin to be distinguishable through backscattered electron imaging. However, there were obviously white particles on the sample surface of Zr–Co–Al–Ag BMG with 8 at.% Ag, oxidized at 773 K and 873 K, as shown in Figs. 5(c) and 5(d). EDX results of the white particles are shown in Table III. The size and the amount of white particles increased when the temperature increased.
EDX result of the white oxidation products on the surface of Zr–Co–Al–Ag BMGs with 8 at.% Ag oxide at 773 K and 873 K.
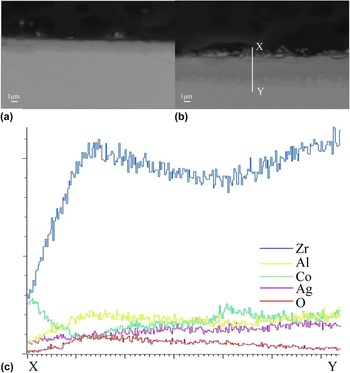
Figures 7(a) and 7(b) showed the cross-sectional backscattered electron images of Zr–Co–Al–Ag BMG with 8 at.% Ag oxidized at 773 K and 873 K, respectively. The oxide layer could not be seen at 673 K. At 773 K, only a thin layer (1.8 ± 0.1 μm) could be found after 5 h oxidation. The compact oxide layer connected well to the substrate and could protect the sample by suppressing the inward diffusion of oxygen. At 873 K, an oxide layer (5.4 ± 0.1 μm) could be found after 5 h oxidation. The thickness of the oxidation layer increased when the temperature increased. Figure 7(c) shows the EDS line profile corresponding to line X-Y in Figure 7(b). The result indicates that the enrichment of Co is on the surface of the sample. In the oxide layer, the content of zirconium and aluminum increased.
Cross-sectional backscattered electron images of Zr–Co–Al–Ag BMG with 8 at.% oxidized at (a) 773 K; (b) 873 K. (c) The corresponding EDS line profile of sample in (b).

IV. ANALYSIS AND DISCUSSION
A. Corrosion
From the potentiodynamic polarization results in Figs. 3(a) and 3(b), it is found that the addition of silver could increase the corrosion potential (E corr) of the BMG samples in both 0.5 mol/L NaCl solution and 1 mol/L H2SO4 solution. The enrichment of elements such as Zr and Al, which favored passivity, would make the passive film stronger. Zr and Al in the surface film of the Zr-based BMGs would preferentially react with oxygen when they are exposed to air. Reference Pang, Zhang, Asami and Inoue11 According to the standard electrode potential (SEP) of Zr (−1.45 V), Al (−1.66 V), Co (−0.28 V), and Ag (0.7996 V), Reference Vanysek23 Zr and Al were preferentially oxidized in the surfaces due to their lower SEPs compared with those of Co and Ag. The lower SEP of the two elements also explained the absence of Ag in the surface film. SEM results shown in Figs. 3(c) and 3(d) indicated that the Zr-based BMGs with or without silver had different morphologies after corrosion and this implied different corrosion mechanisms of the BMGs. Pitting is mainly found in corrosion in solutions containing chloride. Reference Kamachi Mudali, Baunack, Eckert, Schultz and Gebert24 Silver chloride was insoluble in the solution and that was a possible reason of the white corrosion products on the surface of the sample with 11 at.% Ag corrode in NaCl. Compared to the overall sample composition, the Zr and Al contents at the pits were lower than those of the normal sample surface. That proved the enrichment of Zr and Al on the surface of the alloy during the formation of the passive film. This is similar for Ti–Zr–Cu–Pd–Sn and Ni–Pd–P–B BMGs, Reference Qin, Oak, Ohtsu, Asami and Inoue25,Reference Qin, Zeng, Louzguine, Nishiyama and Inoue26 and because of the highest SEP (0.915 V) of Pd among all the constituents in the alloy systems, the noble metal Pd stays completely in the underlying alloy surface.
In 0.5 mol/L NaCl solution, Fig. 3(a) shows that after adding silver, the pitting potential of the BMGs increased. The results of immersion tests in Fig. 4 also show that the addition of silver reduced the density of corrosion pits on the surface and the corrosion resistance of the BMGs was improved. According to the work by Pang et al. on the corrosion behavior of Zr–Al–Co–Nb BMGs, Reference Pang, Zhang, Asami and Inoue11 the formation of Zr4 +- and Al3 +-enriched oxide surface film resulted in the high corrosion resistance in the corrosive medium. The corrosion resistance of Zr-based BMGs in chloride solutions could be further enhanced with increasing Zr content and decreasing Al content in the surface films. Zr4 + oxide is more stable than Al3 + oxide, because Zr revealed higher pitting resistance than that of Al. Reference Palit and Elayaperumal27 It was reported that the addition of Ag would make the surface films of the alloys enrich in Zr and Al, when the alloys are immersed in phosphate-buffered saline. Reference Hua, Huang, Wang, Cao, He, Pang and Zhang28 Zr was further concentrated while Al content decreases in the spontaneously passivated films when the content of Ag increased. This difference was confirmed by the result that there were fewer tree patterns on the corroded surface of the sample with Ag after immersion tests. The enrichment of Zr and Al was also confirmed by the corrosion behavior of Zr–Co–Ag–Al BMGs in phosphate-buffered saline. Reference Zhang, Li, Pan, Guo, Zhang and Liu2 To summarize, Ag promoted Zr- and Al-enrichment in the passive film and hence improved the corrosion resistance of Zr–Co–Ag–Al BMGs.
B. Oxidation
According to the results of TG tests in Figs. 5(a) and 5(b), the oxidation kinetics of Zr–Co–Al–Ag BMGs over the temperature range obeyed a two-stage parabolic rate law. The sample with 11 at.% Ag has shorter transition time and higher oxidation rate, especially during the steady-state oxidation. According to the thermodynamic data of pure silver, Reference Gaskell29 the temperature for the equilibrium among pure solid silver, oxygen gas (1 atm pressure), and pure silver oxide is around 462 K. It means that the standard Gibbs free energy of silver oxidation formation is zero at 462 K, and increases at higher temperature. So silver oxide will spontaneously dissociate into pure silver and oxygen gas over the temperature range in this study. It is reported that the silver atoms were more likely to remain as the uncorroded materials inside the scales as it did not diffuse back into the substrate or its diffusivity was much slower than that of oxygen and other cations. Reference Kai, Ren, Kao, Wang, Chuang, Freels and Liaw30 Then some metallic Ag particles may form and play a partly blocking effect in reducing the available cross-section of the substrate. That might reduce the inward diffusion of oxygen or outward diffusion of cations, and hence the oxidation rate was reduced. This blocking effect is more evident at the temperature below or equal to 698 K. Reference Kai, Ren, Kao, Wang, Chuang, Freels and Liaw30 The content of Ag was another important parameter affecting the oxidation rates. With increasing content of Ag, the resistance to silver oxide dissociation is higher according to the equilibrium of the chemical reaction. The blocking effect is not strong as expected and if more silver is added in the Zr-based BMGs, the oxidation resistance will reduce.
Some white particles are found after the Zr–Co–Al–Ag BMG with 8 at.% Ag was oxidized at 773 K and 873 K. The thickness of the oxide layer increased from 1.8 to 5.4 μm, when the temperature increased. The size and amount of the cobalt-rich white particles were also increased. EDX results also showed that the enrichment of Co was on the surface of the sample, while in the oxide layer, the content of zirconium and aluminum increased. According to the SEP of Zr (−1.45 V), Al (−1.66 V), Co (−0.28 V), and Ag (0.7996 V), Reference Vanysek23 Zr and Al are preferentially oxidized in the surfaces due to their lower SEPs compared with those of Co and Ag. Cao et al. Reference Cao, Zhang and Shek14 analyzed the oxidation behavior of Zr–Co–Al BMGs and confirmed that the oxidation process started with the formation of Zr and Al oxides followed by the formation of CoO crystals along the grooves of the freshly ground surface. The oxidation processes involved the inward diffusion of oxygen through the oxide layer, and outward diffusion of cobalt. CoO is a p-type cation-deficient oxide, through which Co diffusion is easier, whereas ZrO2 is an n-type anion-deficient oxide which makes it easier for oxygen to diffuse into the sample. CoO therefore mainly formed on the surface of the sample and ZrO2 was formed in the innermost layer.
V. CONCLUSION
In this study, corrosion and oxidation behaviors of Zr–Co–Al–Ag BMGs with different silver contents were investigated. The addition of silver could improve the corrosion resistance of Zr–Co–Al–Ag BMGs in both 0.5 mol/L NaCl and 1 mol/L H2SO4 solution. Pitting only appeared in 0.5 mol/L NaCl solution. After adding silver, the corrosion and pitting potential of the BMGs increased. Addition of silver was thought to result in the enrichment of elements such as zirconium, which had better passivity in the passive film, Reference Zhang, Li, Pan, Guo, Zhang and Liu2 and the quality of the passive film was improved. Thus, the addition of silver up to 11 at.% could improve the corrosion resistance of Zr–Co–Ag–Al BMGs.
The oxidation behaviors of Zr–Co–Al–Ag BMGs with different silver contents were similar. The oxidation kinetics of all the samples over the temperature range investigated obeyed a two-stage parabolic rate law. The alloy with 11 at.% Ag had shorter transition time and higher oxidation rate especially during the steady-state oxidation. The addition of Ag reduced the oxidation resistance of Zr–Co–Al–Ag BMGs. There were some cobalt-rich white oxide particles on the sample surface after the Zr–Co–Al–Ag BMG with 8 at.% Ag was oxidized at 773 K and 873 K. The thickness of the oxide layer increased from 1.8 to 5.4 μm. The size and amount of the white particles were also increased.
ACKNOWLEDGMENT
The work presented in this paper was supported by a General Research Fund (Project number: CityU 120813) from Research Grants Council, Hong Kong SAR Government.