1 Introduction
How easy is it for political parties to earn representation in the national legislature? Does the process of translating votes into seats favor larger parties? Though related, these are distinct questions that are central to the study of electoral systems and their consequences. An electoral system may bar parties that fail to exceed a vote threshold from earning any seats and at the same time exact proportional allocation for parties eligible for seats. Conversely, a system may allow even the smallest parties to earn a seat but grant marked seat advantages to larger parties.Footnote 1 These alternative combinations of electoral system provisions engender sharply different incentives for electoral competition, the former allowing many moderately sized parties to compete as equals and the latter promoting top-heavy competition between two dominant parties flanked by a possibly large number of fringe alternatives. We therefore believe that these two quantities (threshold of representation and disproportionality of allocation for parties above the threshold) deserve separate measurement and evaluation of their (possibly independent) consequences. We take up the first task of empirical measurement in this paper.
We make two main contributions. First, we develop a method to obtain conceptually distinct measures of empirical thresholds of representation and of electoral disproportionality favoring larger parties from electoral returns data. We use real electoral returns to estimate these quantitiesFootnote 2 so that the measures summarize the translation of vote shares to seats under actual, competitive electoral forces that simultaneously shape the behavior of both voters and parties. Our approach builds on a classic votes-to-seats curve model (e.g., Taagepera Reference Taagepera1973; Tufte Reference Tufte1973; Schrodt Reference Schrodt1981; Grofman Reference Grofman1983; King and Browning Reference King and Browning1987; King Reference King1990). We preserve the disproportionality (or responsiveness) parameter shared by these previous studies and enrich it by allowing for a stochastic national threshold of representation. We establish that these parameters are identified from observed votes/seats data under a very mild assumption on the number of parties that earn positive vote shares in Theorem 1 of Section 2. To efficiently estimate this enriched model, we develop a Maximum a Posteriori (MAP) estimator using an Expectation-Maximization (EM) algorithm (Dempster, Laird, and Rubin Reference Dempster, Laird and Rubin1977).Footnote 3 The resulting estimated parameters are statistics in the classic sense of providing efficient empirical summaries of the votes-to-seats relationship, and they come with a gauge of confidence in these estimates in the form of standard errors.
We implement the MAP-EM procedure in 116 electoral systems used in 417 elections to the lower house across 36 European countries since WWII. The estimated model fails a goodness-of-fit test in only 5 (from two countries, France and North Macedonia) of the 116 systems. We reject a simpler estimated model that assumes no threshold in favor of our model in 49 systems. The average estimated expected threshold in these 49 systems is
 $3.67\%$
while it is
 $0.8\%$
in the remaining systems. The two modal electoral system configurations involve (1) systems for which the no-threshold model is rejected and also exhibit proportional allocation for parties exceeding thresholds (32.76% of all systems) and (2) disproportional seat allocations consistent with a no-threshold model (38.79% of all systems).Footnote
4
As a second contribution, we develop a battery of inference procedures that allow us to evaluate both model fit and alternative hypotheses regarding the function of the electoral system. Importantly, we develop a test procedure to address a long-standing problem in the literature, namely whether observed or unobserved changes in the electoral system or structural changes in voter or party behavior have led to statistically significant changes in the pattern of votes-to-seats allocation? To illustrate this procedure, we compare three alternative definitions of electoral systems. In the first definition, an electoral system persists if there are no changes in the seat allocation formula and if the number of districts, seats, and legal threshold remain within 5% of the system’s average. The second definition identifies a new electoral system only when the allocation formulas change. In the third, there is a new electoral system whenever we observe a change in any of these features of the electoral system. While our test provides conditional support for the 5% cutoff definition over the alternatives, our procedure can be used to evaluate electoral system change without recourse to an ad hoc rule.
An ancillary contribution of this study is the compilation of a new dataset of electoral results and institutions for 417 elections in 36 European countries in the period 1945–2010. In addition to offering finer resolution than is typical on the seats and votes returns in these elections, our data complement existing datasets of electoral institutions (e.g., Beck et al. Reference Beck, Clarke, Groff, Keefer and Walsh2001; Golder Reference Golder2006) with novel institutional details, especially with regard to the rules regulating access and modes of seat allocation, for example, legal thresholds, the presence of majority or plurality bonuses, and the exact nature of upper tier allocation along with the types of links that tie different tiers.
Our emphasis on separate and distinct measurement of national thresholds of representation is consistent with increasing interest, theoretical, normative, and empirical, on that aspect of national electoral systems. On the theoretical side, electoral thresholds figure prominently in analytical accounts that explore the determinants of the number of viable candidates in elections.Footnote 5 On the normative side, while it is tempting to dismiss the significance of national thresholds on the grounds that (by their very nature) they only affect the viability of representation for relatively small parties, it is important to appreciate that these “small” parties may represent minorities, political or ethnic, struggling for their integration in the political process. Because electoral thresholds often reflect explicit intent to bar representation to such political minorities, they are of interest to a growing community of scholars who specialize on the ethical and positive issues of minority representation, as exemplified by the extensive attention to thresholds devoted by the Venice Commission, the advisory body of the Council of Europe on constitutional matters (European Commission for Democracy through law (Venice Commission) (2018)).Footnote 6
On the positive side, the importance of estimating national thresholds of representation is also highlighted by the fact that the choice to institute them, directly or implicitly, is rarely politically innocuous. When they are not blatantly intended at barring representation to politicized ethnic minorities, high thresholds are often defended citing the need to avoid the proliferation of many frivolous parties. Such justification was used by supporters of the relatively high electoral thresholds instituted in Germany after the Second World War (the proliferation of parties implicitly debited as one of the flaws of the pre-war system). In this, as in all cases, thresholds are instituted by winning majorities, broad or marginal, depending on the rules for setting the electoral system. It is hard to imagine that savvy political actors involved in these decisions do not take into account which of the larger parties are likely to benefit the most from any votes diverted from smaller and, due to thresholds, no-longer viable parties. Even such a small advantage may prove crucial for a larger party competing for government.
A challenge faced by students of electoral systems is that the actual level of thresholds of representation is often hardly discernible from the provisions of the electoral law. Even when explicitly codified in the main body of the electoral law, legal thresholds often apply at the subnational level, or are qualified by additional provisions for the allocation of seats, so that the threshold parties effectively face at the national level cannot be directly determined from the provisions of the electoral system alone. In the example of Germany’s mixed electoral system with both single-member districts and a national PR component, a high national legal threshold of 5% was in place for most of the post-war years. At the same time, the electoral law allowed parties below that threshold to earn seats by winning a plurality of the vote in single-member districts. Therefore, despite the fact that the actual expected threshold in Germany is arguably lower than 5% by virtue of this additional provision of the law,Footnote 7 the numerical value analysts may assign to the expected level of the threshold is both not obvious and ought to come with a gauge of uncertainty we can place in it. Indeed, our point estimates of the German threshold over time reflect a level lower than 5%, but with a sizable confidence interval around them. In the minority of cases when the electoral law determines the national electoral threshold explicitly and unambiguously (for example, this is so for the Greek electoral systems in the period from 2003 to 2009), our estimator successfully recovers the actual threshold.
Besides providing a rigorous and comparable method to evaluate the national level of electoral thresholds, our study also offers additional advantages when it comes to measuring disproportionality. Of course, thresholds contribute to the overall pattern of disproportionality, but our second disproportionality measure is different and distinct because it is specific to parties that exceed these thresholds. We argue that this separation between the two measures provides both more accurate and more politically relevant resolution on the pattern of votes–seats allocation. Disproportionality is of primary interest to positive scholars of electoral systems as an indication of how likely it is that the largest among the larger parties captures a majority in parliament. For that purpose, we claim that it is often more informative to know whether the process of seat allocation favors larger parties among the parties viable for seats, rather than having an overall gauge of disproportionality. Returning to the German example, seats–votes data will show higher levels of disproportionality whenever parties close to the national threshold fail to obtain representation. But high levels of overall disproportionality need not translate to a high probability of a parliamentary majority for the largest party in each election because seats are allocated nearly perfectly proportionally for parties above the 5% threshold. As we already pointed out in the introductory paragraph, the two quantities (thresholds and disproportionality for parties above thresholds) can be manipulated independently in electoral laws and, in fact, vary independently in the data.
This discussion is independent of the related question of what kind of criterion of disproportionality a given measure captures? We eschew the latter question, though it still applies whether we choose to measure disproportionality for all parties (as the extant literature does) or only for parties above the electoral threshold, as we propose. It is by now well understood that there are many such alternative measures (Cox and Shugart Reference Cox and Shugart1991; Gallagher Reference Gallagher1991) (at least as many as the various proportionality formulas) and that differences between most measures matter less as the number of allocated seats increases. Our measure has the conceptual backing of Theil’s (Reference Theil1969) justifications, and captures well the “political character” of disproportionality, as in Cox and Shugart (Reference Cox and Shugart1991).
Before we proceed with the analysis, we take the opportunity to relate our work to different strands of the literature, besides that already cited. Various models of votes-to-seats allocation related to ours have been used by numerous authors in order to theoretically and empirically characterize the pattern of allocation in two and multiparty contexts (e.g., Theil Reference Theil1969; Taagepera Reference Taagepera1973; Tufte Reference Tufte1973; Schrodt Reference Schrodt1981; Grofman Reference Grofman1983; Jackman Reference Jackman1994; Calvo Reference Calvo2009; Linzer Reference Linzer2012; Calvo and Rodden Reference Calvo and Rodden2015), to explore possible partisan bias or party-specific swing ratios (King and Browning Reference King and Browning1987; King Reference King1990; Linzer Reference Linzer2012), to understand the historical process of adoption of Proportional Representation (PR) (Calvo Reference Calvo2009), or the effects of geographical dispersion of electoral support on party systems (Calvo and Rodden Reference Calvo and Rodden2015). We differ from these authors in that we introduce and jointly estimate national electoral threshold parameters.
Of course, we are not the first to attempt to quantify electoral thresholds, and a number of authors have proposed ways to convert observed electoral provisions into a national threshold of representation (e.g., Taagepera Reference Taagepera1989; Taagepera and Shugart Reference Taagepera and Shugart1989; Gallagher Reference Gallagher1992; Lijphart Reference Lijphart1994; Taagepera Reference Taagepera1998a,Reference Taageperab, Reference Taagepera2002; Ruiz-Rufino Reference Ruiz-Rufino2007; Taagepera and Shugart Reference Taagepera and Shugart2017). Naturally, thresholds are determined by a confluence of formal provisions along with unobserved or harder to quantify features of the electoral system such as districting practices, or the specific configuration of party forces (emergent or intentionally built through, e.g., malapportionment) that render representation viable in each instance. Among the advantages of our estimation approach is that it allows us to quantify the combined effect of these possible determinants of barriers to representation; and that it comes with a gauge of the confidence we can place on the resulting measurement in the form of a standard error.
2 Model, Identification, and Estimation
In this section, we specify a statistical model of the allocation of seats as a function of vote shares that incorporates a threshold of representation, show that this model is identified, and outline our estimation strategy. Consider
 $N$
parties that compete across
 $T$
elections under the same electoral system. Index parties by
 $i=1,\ldots ,N$
and elections by
 $t=1,\ldots ,T$
. Let the vote share of party
 $i$
in election
 $t$
be denoted by
 $v_{t,i}\geqslant 0$
, and denote the number of seats allocated to that party in election
 $t$
by
 $s_{t,i}\geqslant 0$
. Let the vector of realized seat allocations in election
 $t$
be denoted by
 $s_{t}$
and the corresponding vector of vote shares by
 $v_{t}$
. Let
 $F$
denote the joint distribution of
 $(s_{t},v_{t})$
, denote its marginal over vote shares by
 $F_{v}$
, and the conditional distribution over seats given vote shares by
 $F_{s\mid v}$
, so that
 $F=F_{s\mid v}\cdot F_{v}$
. Assume that seats
 $s$
are drawn conditionally independently across elections according to
 $F_{s\mid v}$
, conditional on realized vote shares
 $v$
.Footnote
8
Our goal is to estimate the conditional distribution
 $F_{s\mid v}$
. Since both the vote shares
 $v$
and seat allocations
 $s$
are observable, this distribution is in principle nonparametrically identified but such an approach would be impractical for estimation purposes as we do not have the luxury of observing centuries of elections. We will therefore specify a parametric family of distributions within which
 $F_{s\mid v}$
belongs.
To parameterize
 $F_{s\mid v}$
and accommodate seat allocation processes that provide for a (for our purposes unobserved to the analyst) threshold of representation, we assume that in each election
 $t$
, a latent variable
 $\unicode[STIX]{x1D703}_{t}^{\ast }$
is drawn from a distribution
 $f(\unicode[STIX]{x1D703}_{t}^{\ast }\mid \unicode[STIX]{x1D703},\unicode[STIX]{x1D70E})$
and a national electoral threshold
 $\unicode[STIX]{x1D703}_{t}$
is realized as a function of
 $\unicode[STIX]{x1D703}_{t}^{\ast }$
. Specifically, the threshold
 $\unicode[STIX]{x1D703}_{t}$
is zero if the latent variable
 $\unicode[STIX]{x1D703}_{t}^{\ast }$
is negative and is equal to
 $\unicode[STIX]{x1D703}_{t}^{\ast }$
otherwise, that is,
 $\unicode[STIX]{x1D703}_{t}=\max \{0,\unicode[STIX]{x1D703}_{t}^{\ast }\}$
. Turning to the distribution of seats in election
 $t$
given the realized threshold,
 $\unicode[STIX]{x1D703}_{t}$
, we start with the (provisional) assumption that parties whose vote share falls below the realized threshold receive no seats, that is,
 $s_{t,i}=0$
when the vote share of party
 $i$
satisfies
 $v_{t,i}<\unicode[STIX]{x1D703}_{t}$
. For parties that exceed the threshold in election
 $t$
, we assume (as in, for example, King (Reference King1990)) that the allocation of seats follows a multinomial distribution
 $$\begin{eqnarray}p(s_{t}\mid v_{t},\unicode[STIX]{x1D6FD},\unicode[STIX]{x1D703}_{t})=\text{Multinomial}\left[q_{1}(v_{t},\unicode[STIX]{x1D6FD},\unicode[STIX]{x1D703}_{t}),\ldots ,q_{N}(v_{t},\unicode[STIX]{x1D6FD},\unicode[STIX]{x1D703}_{t});\mathop{\sum }_{i=1}^{N}s_{t,i}\right],\end{eqnarray}$$
where the expected seat share of party
 $i$
is given by
 $$\begin{eqnarray}q_{i}(v_{t},\unicode[STIX]{x1D6FD},\unicode[STIX]{x1D703}_{t})=\left\{\begin{array}{@{}ll@{}}\displaystyle {\displaystyle \frac{v_{t,i}^{\unicode[STIX]{x1D6FD}}}{\displaystyle \mathop{\sum }_{j:v_{t,j}\geqslant \unicode[STIX]{x1D703}_{t}}v_{t,j}^{\unicode[STIX]{x1D6FD}}}} & \text{if }v_{t,i}\geqslant \unicode[STIX]{x1D703}_{t},\\ \displaystyle \frac{\mathbb{I}(v_{t,i}=\max _{j}v_{t,j})}{\displaystyle \mathop{\sum }_{k}\mathbb{I}(v_{t,k}=\max _{j}v_{t,j})} & \text{if }v_{t,i}<\unicode[STIX]{x1D703}_{t}.\end{array}\right.\end{eqnarray}$$
Here,
 $\unicode[STIX]{x1D6FD}$
is a disproportionality parameter, while
 $\mathbb{I}(\cdot )$
is an indicator function taking the value one if the expression in parentheses is true, and zero, otherwise. The second line of (2) covers the case the realized threshold exceeds the vote share of the plurality party (admittedly a negligible event in our estimation and certainly in the data), specifying that seats are allocated with equal probability among parties tied in the plurality position.Footnote
9
We complete the statistical model of seat allocation by specifying a parametric normal distribution for the latent threshold variable, that is,
 $\unicode[STIX]{x1D703}_{t}^{\ast }\,\sim \,f(\unicode[STIX]{x1D703}_{t}\,\mid \,\unicode[STIX]{x1D703},\unicode[STIX]{x1D70E}):=N(\unicode[STIX]{x1D703},\unicode[STIX]{x1D70E}^{2})$
. This parametric form allows us to compute in closed form the expected national threshold
 $\bar{\unicode[STIX]{x1D703}}(\unicode[STIX]{x1D703},\unicode[STIX]{x1D70E})$
and its standard deviation
 $\bar{\unicode[STIX]{x1D70E}}(\unicode[STIX]{x1D703},\unicode[STIX]{x1D70E})$
as functions of the parameters
 $\unicode[STIX]{x1D703},\unicode[STIX]{x1D70E}$
(see Online Appendix E). Naturally, the expected threshold
 $\bar{\unicode[STIX]{x1D703}}$
is of primary importance for our purposes, though the nuisance parameter is also of potential relevance—and certainly necessary given the stochastic perspective we take on the data. In turn, parameter
 $\unicode[STIX]{x1D6FD}$
serves as a natural (dis)proportionality parameter for the seat allocation among parties that exceed the threshold, implying proportional representation (in expectation) when
 $\unicode[STIX]{x1D6FD}=1$
, disproportional allocations favoring larger parties when
 $\unicode[STIX]{x1D6FD}>1$
, and disproportional allocations favoring smaller ones when
 $\unicode[STIX]{x1D6FD}<1$
. Theil (Reference Theil1969) provides justifications for this parameter choice, but it has a long tradition in empirical models of seats–votes relationships, especially in two-party systems (e.g., Kendall and Stuart Reference Kendall and Stuart1950; Taagepera Reference Taagepera1973; Tufte Reference Tufte1973; Schrodt Reference Schrodt1981).
With the model thus specified, and before we move to estimation, we first show that the parameters
 $\unicode[STIX]{x1D703},\unicode[STIX]{x1D70E},\unicode[STIX]{x1D6FD}$
that determine the conditional distribution of seats given votes
 $F_{s\mid v}$
according to the above assumptions are identified.
Theorem 1. Assume the conditional distribution of seats given votes,
 $F_{s\mid v}$
, is parameterized by
 $\unicode[STIX]{x1D703}_{0},\unicode[STIX]{x1D70E}_{0},\unicode[STIX]{x1D6FD}_{0}$
,
 $\unicode[STIX]{x1D70E}_{0}>0$
,Footnote
10
as above and that:
-
 $(A_{1})$
-
We observe repeated elections with vote–seats data
$(v,s)\sim F$
. -
$(A_{2})$
-
$F_{v}$
has strictly positive mass on
${\mathcal{V}}_{3}=\{v\mid v_{i_{1}}>v_{i_{2}}>v_{i_{3}}>0\text{ for some }i_{1},i_{2},i_{3}\}$
.


Then parameters
 $\unicode[STIX]{x1D703}_{0},\unicode[STIX]{x1D70E}_{0},\unicode[STIX]{x1D6FD}_{0}$
are identified.
The proof of Theorem 1 appears in Online Appendix A. Note that assumption (
A
1
) is standard, so that the crucial identification condition is (
A
2
), which simply requires that there exists positive probability that at least three parties receive positive vote share. This is a very mild assumption that is easily met in our sample. By virtue of this assumption, we first establish that parameter
 $\unicode[STIX]{x1D6FD}_{0}$
is identified from the subset of the data where the smallest of the three parties receives seats. We then further use (
A
2
) to show that we can identify (at least) two quantiles of the normal distribution
 $f(\cdot \mid \unicode[STIX]{x1D703}_{0},\unicode[STIX]{x1D70E}_{0})$
, which in turn pins down the two parameters
 $\unicode[STIX]{x1D703}_{0}$
and
 $\unicode[STIX]{x1D70E}_{0}$
.
Before we move to estimation, we comment on a few aspects of the model and its interpretation, and enter some caveats. First, we view the joint distribution over votes and seats,
 $F$
, as an equilibrium distribution induced by the electoral system. By that we mean that all agents involved (parties, candidates, and voters) behave to the best of their ability and understanding of anticipated electorate behavior and preferences: Parties contest elections, field candidates and lists, form alliances local or national, and respond to observed transient shocks in voter preferences; similarly, voters tailor their behavior to the rules and to the menu of options that arise form the parties’ behavior. It is not our objective to identify these supply and demand forces that shape
 $F$
; we merely assume that they combine to determine it. Second, in this perspective, we construe an electoral system broadly as both the legal rules for translating votes to seats as well as the structural features (observable or not) that encourage or discourage participation by certain demographics, the alignment of likely voter preferences across districts given districting choices, but also the structural variability in these preferences (aggregate and individual preference shocks, and other vicissitudes of public opinion toward issues or parties). Third, our assumption that the conditional distribution over seats
 $F_{s\mid v}$
is nondegenerate and involves a stochastic threshold is consistent with and follows from this perspective. For example, a party may contest the election hoping to achieve a certain vote share and some seats in expectation. Given aggregate uncertainty about voter behavior, the party may hit the target national vote share but may or may not succeed at earning seats because the realized alignment of vote shares across districts on election night proved or did not prove favorable, respectively. Fourth, any time we force a parametric form to a distribution (as we do for
 $F_{s\mid v}$
), we take the risk of misspecification. Our goodness-of-fit test in Section 4 provides a way to safeguard against such a risk. Finally, permanent structural changes affecting parties’ or voters’ behavior could result in a different votes–seats distribution
 $F$
with a different conditional,
 $F_{s\mid v}$
. In Section 4, we also develop a test of electoral system change that can be used as a way to detect such changes.
We now derive a likelihood for our model in order to motivate our estimator and provide additional insight as to the nature of information present in the data that allows us to recover the threshold parameters. First, we logically infer from the observed data
 $(v_{t},s_{t})$
that the threshold in period
 $t$
did not exceed
 $$\begin{eqnarray}\bar{v}_{t}=\min _{i\in \{1,\ldots ,N\}}\{v_{t,i}\mid s_{t,i}>0\},\end{eqnarray}$$
that is, the minimum vote share among parties that received seats. Letting
 $p(s_{t}\mid v_{t},\unicode[STIX]{x1D6FD},\unicode[STIX]{x1D703}_{t})$
denote the probability of
 $s_{t}$
given votes
 $v_{t}$
,
 $\unicode[STIX]{x1D6FD}$
, and realized threshold
 $\unicode[STIX]{x1D703}_{t}$
, we note that if the latter falls in any interval
 $(\ell ,u ]\subset [0,\bar{v}_{t}]$
and there does not exist a party
 $i$
with vote share
 $v_{t,i}$
in
 $(\ell ,u)$
, then
 $$\begin{eqnarray}p(s_{t}\mid v_{t},\unicode[STIX]{x1D6FD},\unicode[STIX]{x1D703}_{t})=p(s_{t}\mid v_{t},\unicode[STIX]{x1D6FD},u).\end{eqnarray}$$
Here, the exact realization of the threshold does not matter as long as the set of parties with vote share at or above the threshold remains identical. Accordingly, suppose there are
 $n_{t}$
distinct parties with vote shares
 $v_{t,i_{1}},\ldots ,v_{t,i_{n_{t}}}$
that are less than or equal to the upper bound of the realized threshold
 $\bar{v}_{t}$
. We index these by
 $z_{t}=1,\ldots ,n_{t}$
in increasing order and define
 $u_{t,z_{t}}:=v_{t,i_{z_{t}}}$
,
 $z_{t}=1,\ldots ,n_{t}$
, so that
 $$\begin{eqnarray}u_{t,1}=v_{t,i_{1}}<u_{t,2}=v_{t,i_{2}}<\cdots <u_{t,n_{t}-1}=v_{t,i_{n_{t}-1}}<u_{t,n_{t}}=v_{t,i_{n_{t}}}=\bar{v}_{t}.\end{eqnarray}$$
Similarly, we can define for each
 $z_{t}=1,\ldots ,n_{t}$
a corresponding lower bound
 $$\begin{eqnarray}\ell _{t,z_{t}}:=\left\{\begin{array}{@{}ll@{}}u_{t,z_{t}-1} & \text{if }z_{t}>1\\ -\infty & \text{if }z_{t}=1.\end{array}\right.\end{eqnarray}$$
We may now view
 $z_{t}$
as the realization of a random variable
 $Z_{t}$
with support
 $\{1,\ldots ,n_{t}\}$
, with the interpretation that
 $z_{t}$
denotes the interval
 $(\ell _{t,z_{t}},u_{t,z_{t}} ]$
within which the latent threshold is realized. Clearly, the probability that
 $\unicode[STIX]{x1D703}_{t}^{\ast }\in (\ell _{t,z_{t}},u_{t,z_{t}} ]$
is
 $$\begin{eqnarray}p(z_{t}\mid v_{t},\unicode[STIX]{x1D703},\unicode[STIX]{x1D70E})=P(Z_{t}=z_{t}\mid v_{t},\unicode[STIX]{x1D703},\unicode[STIX]{x1D70E})=\int _{\ell _{t,z_{t}}}^{u_{t,z_{t}}}f(\unicode[STIX]{x1D703}_{t}^{\ast }\mid \unicode[STIX]{x1D703},\unicode[STIX]{x1D70E})\,d\unicode[STIX]{x1D703}_{t}^{\ast }.\end{eqnarray}$$
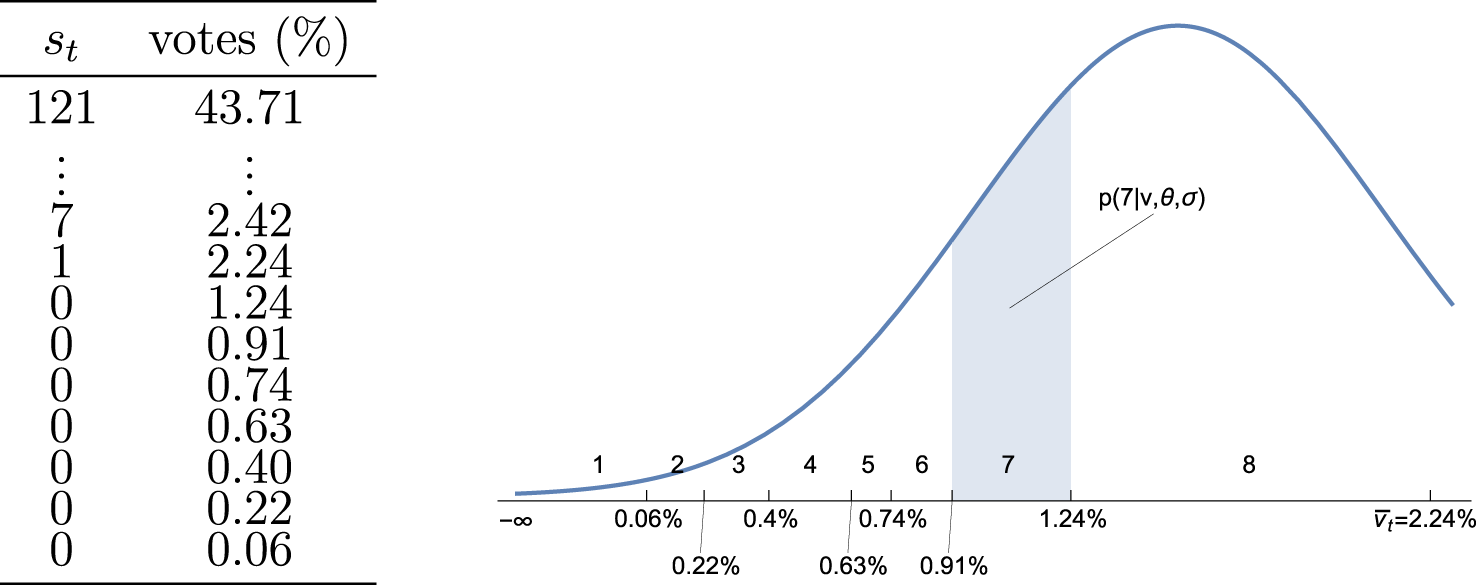
To illustrate using an example, in Figure 1, we use the seat allocation in the Portuguese elections of 1979, where each row in the table corresponds to the seats and percentage of votes received by a party. Note that in this election the smallest party that gained seats received 2.24% of the votes and so
 $\overline{v}_{t}=2.24\%$
. Moreover, the number of parties whose vote shares are less than or equal to that upper bound for the threshold is eight
 $(n_{t}=8)$
. The threshold must then be in one of the intervals defined by the vote shares of these eight parties and the random variable
 $Z_{t}$
can take value
 $1,2,3,\ldots ,8$
, each corresponding to one of these intervals. The first of these intervals is
 $(-\infty ,0.06\%]$
. The second is
 $(0.06\%,0.22\%]$
, all the way up to
 $(1.24\%,2.24\%]$
. The probability calculation in (5) is represented by the shaded area in Figure 1 for the case
 $z_{t}=7$
.
Threshold location (Portugal 1979).

Using (1), (4), and (5), we can now write a log-likelihood as
 $$\begin{eqnarray}L(\unicode[STIX]{x1D703},\unicode[STIX]{x1D70E},\unicode[STIX]{x1D6FD}\mid X)=\mathop{\sum }_{t=1}^{T}\log \left(\mathop{\sum }_{z_{t}=1}^{n_{t}}p(z_{t}\mid v_{t},\unicode[STIX]{x1D703},\unicode[STIX]{x1D70E})p(s_{t}\mid v_{t},\unicode[STIX]{x1D6FD},u_{t,z_{t}})\right).\end{eqnarray}$$
It now becomes evident that, even though the a priori probability (5) may suggest otherwise, the estimates of threshold and proportionality parameters
 $\unicode[STIX]{x1D703},\unicode[STIX]{x1D70E}$
and
 $\unicode[STIX]{x1D6FD}$
, respectively, interact heavily with each other. Values of
 $\unicode[STIX]{x1D703},\unicode[STIX]{x1D70E}$
that place high probability on low realizations of threshold interval
 $Z_{t}$
tend to suggest more disproportionality (higher
 $\unicode[STIX]{x1D6FD}$
) because more parties exceeding the threshold receive no seats. Conversely, the value of the proportionality parameter
 $\unicode[STIX]{x1D6FD}$
provides sharper (compared to the logical bound
 $\bar{v}_{t}$
) information about the likely realization of the random variable
 $Z_{t}$
and the threshold. Returning to the 1979 Portuguese elections example of Figure 1, if we were to also observe a very proportional pattern of seat allocation for parties at or above
 $\bar{v}_{t}=2.42\%$
(we actually do not), then we would update an appreciably higher probability that
 $Z_{t}=8$
and the threshold
 $\unicode[STIX]{x1D703}_{t}\in (1.24,2.42]$
, for we would otherwise expect a party with
 $1.24\%$
of the vote to also receive seats.
The summations inside the log function make this problem a textbook candidate for the application of an EM-type algorithm (Dempster, Laird, and Rubin Reference Dempster, Laird and Rubin1977), where we “augment” the data with the realization of the unobserved variable
 $Z_{t}$
that designates the interval within which the threshold in election
 $t$
was realized. Even though the EM-algorithm is better suited to implement MLE in this problem, it is still plagued by numerical instability and slow convergence problems. There are three main instances where such problems occur:
-
∙ Cases when
$\unicode[STIX]{x1D70E}\rightarrow 0$
: These are possible singularities in the likelihood, and motivate the MAP-EM estimator of Fraley and Raftery (Reference Fraley and Raftery2007). -
∙ Cases when
$\bar{\unicode[STIX]{x1D703}}(\unicode[STIX]{x1D703},\unicode[STIX]{x1D70E})\rightarrow 0$
, with
$\unicode[STIX]{x1D703}<0$
and relatively small
$\unicode[STIX]{x1D70E}>0$
: The likelihood is practically flat with respect to
$\unicode[STIX]{x1D703},\unicode[STIX]{x1D70E}$
for machine precision purposes. -
∙ Electoral systems for which we have very few data, both when it comes to the number of elections and the number of parties.


There is very little that can be done in the last case, except possibly to exclude these systems from the analysis, as any estimator applied to such data should be taken with caution. We choose to include them in the analysis, but expect estimates of uncertainty in the estimated quantities to regulate how much credence to place to the resulting estimates. Our practical solution for the first two problems is to regularize the likelihood by introducing a prior and execute maximum a posteriori estimation (MAP-EM).
We therefore proceed to introducing a prior to regularize the likelihood with respect to the expected threshold parameter
 $\unicode[STIX]{x1D703}$
and the nuisance parameter
 $\unicode[STIX]{x1D70E}$
. We use a conjugate inverse-gamma-normal prior, as do Fraley and Raftery (Reference Fraley and Raftery2007). Specifically, we assume that
 $\unicode[STIX]{x1D70E}^{2}\sim \text{InverseGamma}(\frac{\unicode[STIX]{x1D708}}{2},\frac{s^{2}}{2})$
and that conditional on
 $\unicode[STIX]{x1D70E}$
,
 $\unicode[STIX]{x1D703}\sim N(\unicode[STIX]{x1D707},\frac{\unicode[STIX]{x1D70E}^{2}}{\unicode[STIX]{x1D705}})$
. We denote the log of this prior by
 $p(\unicode[STIX]{x1D703},\unicode[STIX]{x1D70E},\unicode[STIX]{x1D6FD})$
, which is equal to (excluding the normalizing constant)Footnote
11
 $$\begin{eqnarray}p(\unicode[STIX]{x1D703},\unicode[STIX]{x1D70E},\unicode[STIX]{x1D6FD})=-(\unicode[STIX]{x1D708}+3)\log (\unicode[STIX]{x1D70E})-\frac{s^{2}+\unicode[STIX]{x1D705}(\unicode[STIX]{x1D703}-\unicode[STIX]{x1D707})^{2}}{2\unicode[STIX]{x1D70E}^{2}}.\end{eqnarray}$$
Here,
 $\unicode[STIX]{x1D707}$
is the prior mean of the mean,
 $\unicode[STIX]{x1D703}$
, of the latent threshold. Parameter
 $\unicode[STIX]{x1D705}$
regulates the dispersion of this prior: The smaller this parameter is, the smaller the impact of the prior on the location of
 $\unicode[STIX]{x1D703}$
. In Online Appendix K, we further discuss the prior specification,Footnote
12
and introduce three additional alternatives in order to probe the sensitivity of our estimator to the prior as well as in order to compare our MAP-EM estimates to EM. The broad conclusion of this analysis is that the effect of the prior is present when the amount of data is small (few elections and/or few parties with positive vote shares), but it dissipates quickly with more data, especially for the main quantities of interest, disproportionality
 $\unicode[STIX]{x1D6FD}$
and expected threshold
 $\bar{\unicode[STIX]{x1D703}}(\unicode[STIX]{x1D703},\unicode[STIX]{x1D6FD})$
. The comparison of EM with MAP-EM can be summarized in the words of Fraley and Raftery (Reference Fraley and Raftery2007, p. 177) “… the method did eliminate singularities and degeneracies observed in maximum likelihood methods, while having little effect on stable results. When the number of observations is small, the choice of prior can influence the modeling outcome even when no singularities are observed.”
With this regularization in place, we proceed to specifying the EM steps. As is standard, we start by augmenting the data in order to write a (log)likelihood conditional on the data augmented by the (unobserved) component
 $Z=\{z_{t}\}_{t=1}^{T}$
, and the unobserved latent variables that determine the election thresholds
 $\unicode[STIX]{x1D6E9}^{\ast }=\{\unicode[STIX]{x1D703}_{t}^{\ast }\}_{t=1}^{T}$
. Given
 $z_{t}$
, the latent variable
 $\unicode[STIX]{x1D703}_{t}^{\ast }$
is now distributed according to the normal distribution truncated in
 $(\ell _{t,z_{t}},u_{t,z_{t}}]$
:
 $$\begin{eqnarray}\frac{\mathbb{I}_{(\ell _{t,z_{t}},u_{t,z_{t}}]}(\unicode[STIX]{x1D703}_{t}^{\ast })f(\unicode[STIX]{x1D703}_{t}^{\ast }\mid \unicode[STIX]{x1D703},\unicode[STIX]{x1D70E})}{p(z_{t}\mid v_{t},\unicode[STIX]{x1D703},\unicode[STIX]{x1D70E})}.\end{eqnarray}$$
With a bit of algebra, we can now write a log-likelihood for the complete data as
 $$\begin{eqnarray}L(\unicode[STIX]{x1D703},\unicode[STIX]{x1D70E},\unicode[STIX]{x1D6FD}\mid X,Z,\unicode[STIX]{x1D6E9}^{\ast })=\mathop{\sum }_{t=1}^{T}\log (f(\unicode[STIX]{x1D703}_{t}^{\ast }\mid \unicode[STIX]{x1D703},\unicode[STIX]{x1D70E}))+\log (p(s_{t}\mid v_{t},\unicode[STIX]{x1D6FD},u_{t,z_{t}})).\end{eqnarray}$$
This constitutes a considerable simplification over (6), as we have now avoided taking logs of any summation terms. The MAP-EM estimator amounts to an iterative procedure that starts by setting some initial guess for the parameter values
 $(\unicode[STIX]{x1D703}_{0},\unicode[STIX]{x1D70E}_{0},\unicode[STIX]{x1D6FD}_{0})$
and at the (
 $m+1$
)th iteration computing:
-
(1) Expectation (E-step):
$$\begin{eqnarray}Q(\unicode[STIX]{x1D703},\unicode[STIX]{x1D70E},\unicode[STIX]{x1D6FD};\unicode[STIX]{x1D703}_{m},\unicode[STIX]{x1D70E}_{m},\unicode[STIX]{x1D6FD}_{m})=\mathbb{E}_{Z,\unicode[STIX]{x1D6E9}^{\ast }}[L(\unicode[STIX]{x1D703},\unicode[STIX]{x1D70E},\unicode[STIX]{x1D6FD}\mid X,Z,\unicode[STIX]{x1D6E9}^{\ast })\mid X,\unicode[STIX]{x1D703}_{m},\unicode[STIX]{x1D70E}_{m},\unicode[STIX]{x1D6FD}_{m}].\end{eqnarray}$$
-
(2) Maximization (M-step):
$$\begin{eqnarray}(\unicode[STIX]{x1D703}_{m+1},\unicode[STIX]{x1D70E}_{m+1},\unicode[STIX]{x1D6FD}_{m+1})=\underset{(\unicode[STIX]{x1D703},\unicode[STIX]{x1D70E},\unicode[STIX]{x1D6FD})}{\text{arg}\,\text{max}}\{Q(\unicode[STIX]{x1D703},\unicode[STIX]{x1D70E},\unicode[STIX]{x1D6FD};\unicode[STIX]{x1D703}_{m},\unicode[STIX]{x1D70E}_{m},\unicode[STIX]{x1D6FD}_{m})+p(\unicode[STIX]{x1D703},\unicode[STIX]{x1D70E},\unicode[STIX]{x1D6FD})\}.\end{eqnarray}$$


Using the first-order conditions, we execute the Maximization step by setting
 $$\begin{eqnarray}\displaystyle & \displaystyle \unicode[STIX]{x1D703}_{m+1}=\frac{1}{T+\unicode[STIX]{x1D705}}\mathop{\sum }_{t=1}^{T}\mathop{\sum }_{k=n_{t}}^{N}\frac{p(s_{t}\mid v_{t},\unicode[STIX]{x1D6FD}_{m},u_{t,z_{t}})}{h(X_{t}\mid \unicode[STIX]{x1D703}_{m},\unicode[STIX]{x1D70E}_{m},\unicode[STIX]{x1D6FD}_{m})}\mathbb{E}_{z_{t}}[\unicode[STIX]{x1D703}_{t}^{\ast }\mid \unicode[STIX]{x1D703}_{m},\unicode[STIX]{x1D70E}_{m}]+\frac{\unicode[STIX]{x1D705}\unicode[STIX]{x1D707}}{T+\unicode[STIX]{x1D705}},\quad \text{and} & \displaystyle\end{eqnarray}$$
 $$\begin{eqnarray}\displaystyle & \displaystyle \unicode[STIX]{x1D70E}_{m+1}=\sqrt{\frac{s^{2}+\mathop{\sum }_{t=1}^{T}\mathop{\sum }_{k=n_{t}}^{N}\frac{p(s_{t}\mid v_{t},\unicode[STIX]{x1D6FD}_{m},u_{t,z_{t}})}{h(X_{t}\mid \unicode[STIX]{x1D703}_{m},\unicode[STIX]{x1D70E}_{m},\unicode[STIX]{x1D6FD}_{m})}\mathbb{E}_{z_{t}}[{\unicode[STIX]{x1D703}^{\ast }}_{t}^{2}\mid \unicode[STIX]{x1D703}_{m},\unicode[STIX]{x1D70E}_{m}]-(T+\unicode[STIX]{x1D705})\unicode[STIX]{x1D703}_{m+1}^{2}+\unicode[STIX]{x1D705}\unicode[STIX]{x1D707}^{2}}{T+\unicode[STIX]{x1D708}+3}}. & \displaystyle\end{eqnarray}$$
It is not possible to solve analytically for
 $\unicode[STIX]{x1D6FD}_{m+1}$
, but due to the separation of the likelihood into terms involving bias
 $\unicode[STIX]{x1D6FD}$
and threshold parameters
 $\unicode[STIX]{x1D703},\unicode[STIX]{x1D70E}$
, we can obtain
 $\unicode[STIX]{x1D6FD}_{m+1}$
numerically by solving a single nonlinear equation. We efficiently implement these computations, including the derivation of standard errors, at speeds comparable to conventional ML-estimators by taking full advantage of analytical derivations. More details and derivations for this estimator and the computation of standard errors appear in Online Appendices B and C.
3 Data and Results
We implement our estimator on electoral returns data from elections to the lower house in
 $36$
European democracies for all elections held after the Second World War, or since democratization, until 2010 (inclusive).Footnote
13
We have compiled our electoral returns data from various printed sources including Mackie and Rose (Reference Mackie and Rose1991), Caramani (Reference Caramani2000), Nohlen and Stöver (Reference Nohlen and Stöver2010) and online resources such as Alvarez-Rivera (Reference Alvarez-Rivera2011), Carr (Reference Carr2011), the Inter-Parliamentary Union (2011), and the Norwegian Social Science Data Services (2011). We relied on official web pages of national parliaments, election commissions, each country’s Ministry of Interior, and so on to iron out any inconsistencies in these sources and to obtain electoral results for smaller parties, which are usually lumped as “others” in electoral statistics.Footnote
14
In addition to electoral returns, using these and additional sources (e.g., Carstairs Reference Carstairs1980; Lijphart Reference Lijphart1994; Renwick Reference Renwick2010), we also coded the electoral institutions in effect for each election at a fine level of detail. Specifically, for each election, we recorded the number of seats allocated, the different tiers of allocation, the number of districts in each tier, the allocation formula, the nature of allocation in upper tiers as a function of lower tier allocation, the presence of bonus seat provisions for the (national) plurality or majority party, as well as details for various types of electoral thresholds in effect at each tier of allocation. Details of our institutional coding appear in Online Appendix M.
These institutional data are necessary in order to identify distinct electoral systems in use across time within countries. For the purposes of this analysis, we identify changes in electoral systems within countries if either a change in the allocation formula (across tiers) occurs or when another recorded institutional provision (e.g., number of allocated seats, number of districts) changes by more than 5% of that system’s average. The 5% cutoff is admittedly arbitrary. One of the advantages of our approach is that we can bring standard statistical inference principles to bear on the question of what constitutes a significant change in electoral institutions. We develop a test procedure for that purpose in Section 4.1 and find support (though not universal) for our cutoff rule.
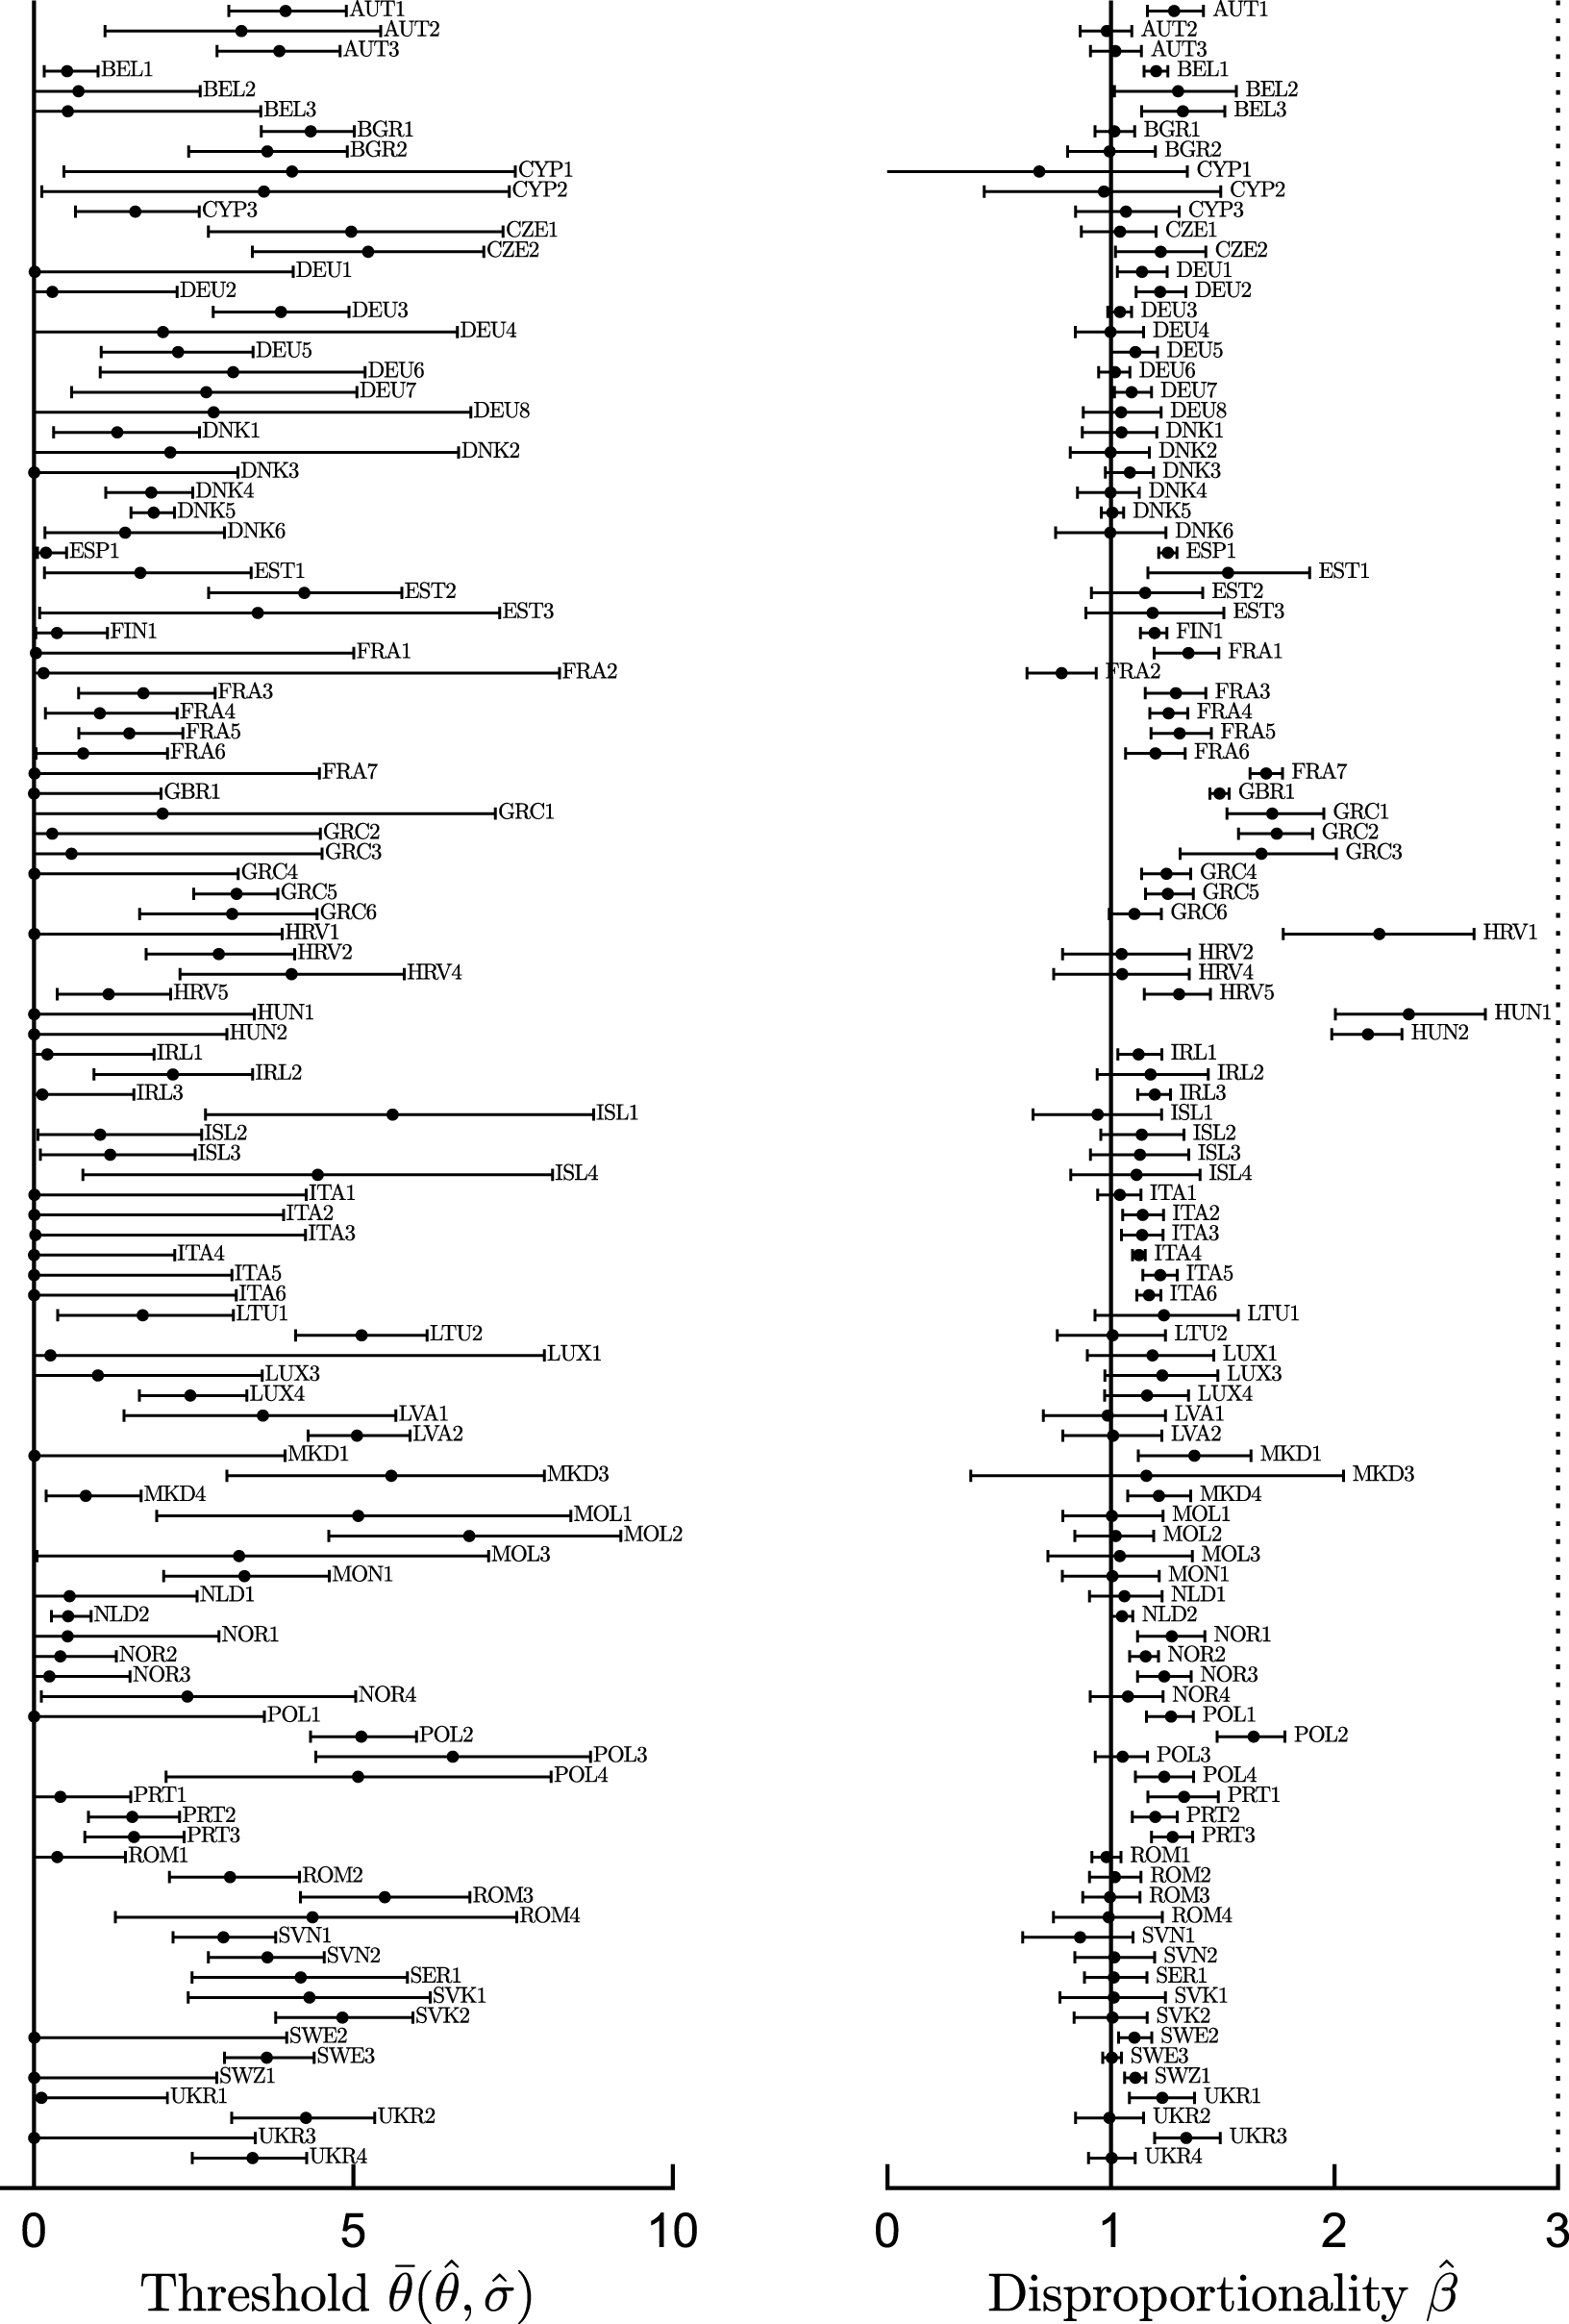
Threshold and disproportionality estimates. Estimates of thresholds
 $\bar{\unicode[STIX]{x1D703}}(\hat{\unicode[STIX]{x1D703}},\hat{\unicode[STIX]{x1D70E}})$
and disproportionality
 $\hat{\unicode[STIX]{x1D6FD}}$
along with 95% confidence intervals. Based on point estimates reported in Online Appendix I.

Figure 2 presents the estimated expected national electoral threshold on the left, proportionality estimates on the right, and their 95% confidence intervals.Footnote
15
The figure excludes systems with very large 95% confidence intervals to increase visibility, but a full set of estimates is included in Online Appendix I.Footnote
16
The threshold estimates vary significantly with values ranging from
 $6.81\%$
for the second Moldavian system (MOL2) to virtually zero in systems like GBR1, ITA4–ITA6, and HUN2, among others. The median threshold estimate is
 $1.58\%$
, which is close to the third system in Cyprus (CYP3 with
 $1.59\%$
) and the third Portuguese system (PRT3 with
 $1.56\%$
).
A sign that our threshold estimates perform quite well is the notable success of the estimator at recovering the level of national legal thresholds when these are unequivocally set by the electoral law. Examples include the second Croatian system (HRV2) and the last two Greek systems GRC5 and GRC6, all with national legal thresholds of
 $3\%$
. In other cases, the electoral system prescribes a national electoral threshold but qualifying provisions allow small parties to gain seats below the nominal threshold. For example, in most of the German systems, a national
 $5\%$
threshold applies unless parties win a seat in one of the single-member districts of the majoritarian partition. In those cases, the statistical estimates we recover generally indicate an average of the legal threshold attenuated according to the probability that alternative qualifying conditions for representation are met.
Next we turn to the estimates of the electoral proportionality. We see that a majority of systems have estimated proportionality parameters that are greater than one. Overall, there are only 18 systems for which the estimated proportionality parameter is below one, and in many of these cases, the difference is in the third decimal point. Among these 18, it is only for the notoriously aberrant second French system (FRA2, with proportionality
 $0.78$
) that we can reject the hypothesis that allocation above the threshold is perfectly proportional (in expectation). Conversely, in 56 out of 116 electoral systems, we find the proportionality parameter to be significantly larger than one, that is, we find statistically significant evidence of disproportional allocations favoring larger parties.
The highest proportionality parameters are found in the third Croatian system (HRV3 with
 $7.83$
), the first Maltese system (MLT1 with
 $2.84$
), and the first Hungarian system (HUN1 with
 $2.33$
). Only HRV3 is a plurality system, while MLT1 is a Single Transferable Vote (STV) system with low district magnitude, and HUN1 is an elaborate fusion of majoritarian and PR provisions. Both HRV3 and MLT1 have a proportionality parameter that is consistent with the “Cube Law,”Footnote
17
that is, these are the two cases when we fail to reject the null of
 $\unicode[STIX]{x1D6FD}$
being equal to three (3).Footnote
18
The median proportionality parameter across all systems is
 $1.13$
and the next largest point estimates following the above three are all statistically different from 3. Even among majoritarian systems, the Cube Law finds little empirical support.Footnote
19
To provide a summary of the results, we classify the systems according to whether or not they have high thresholds and disproportionality. When a system has high thresholds, a model that considers thresholds explicitly should fit the systems’ observed seat allocation better than a model that assumes no threshold exists. This reasoning suggests that a test that compares the fit of our model with one that assumes no threshold, which we will call the restricted model, could give us an indication of which systems have high barriers of entry for small parties.Footnote 20 We devise a statistical test to compare the model with and without thresholds in the next subsection. It suffices to say for now that the test’s null hypothesis is that the observed seats data are generated from the estimated restricted model. We find that in 49 out of 116 systems, the comparison test rejects the restricted model.Footnote 21 Importantly, the average estimated threshold for those 49 systems is 3.67% while that of those systems for which the restricted model is not rejected is 0.8%.
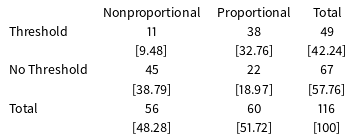
Thresholds and disproportionality (counts).

Threshold denotes the count of systems for which the comparison test rejects the null that the observed seats data are generated from a model with no threshold and No Threshold denotes all other systems at 5% level of significance. Nonproportional denotes the count of systems for which the disproportionality estimate is larger than one at the 5% level of significance (one-tailed test) and Proportional denotes all other systems. Percentages in brackets.
Table 1 shows that out of the 49 systems for which the comparison tests reject the restricted model, 11 also have disproportionality parameters larger than one. These are the systems that provide the most advantages for larger parties. Among them, the ones with larger disproportionality parameters are the second Polish system, the third Portuguese, and the fifth Greek system (POL2, PRT3, and GRC5). POL2 also has one of the highest thresholds (
 $5.12\%$
) and none use a majoritarian allocation formula in that group. On the other extreme, there are 22 systems that offer the most opportunities to small parties with perfect proportionality and low thresholds. The third Danish and first Italian systems—DNK3 and ITA1, both PR systems with some form of compensatory upper tier—fall into that category. But the most populated categories are in the off-diagonal entries of Table 1, which include systems that provide for thresholds (those for which the restricted model is rejected) but proportional allocation for parties exceeding the threshold (38 out of 116 systems) and systems for which a comparison test does not reject the restricted model but with disproportionality favoring larger parties (45 out of 116 systems).
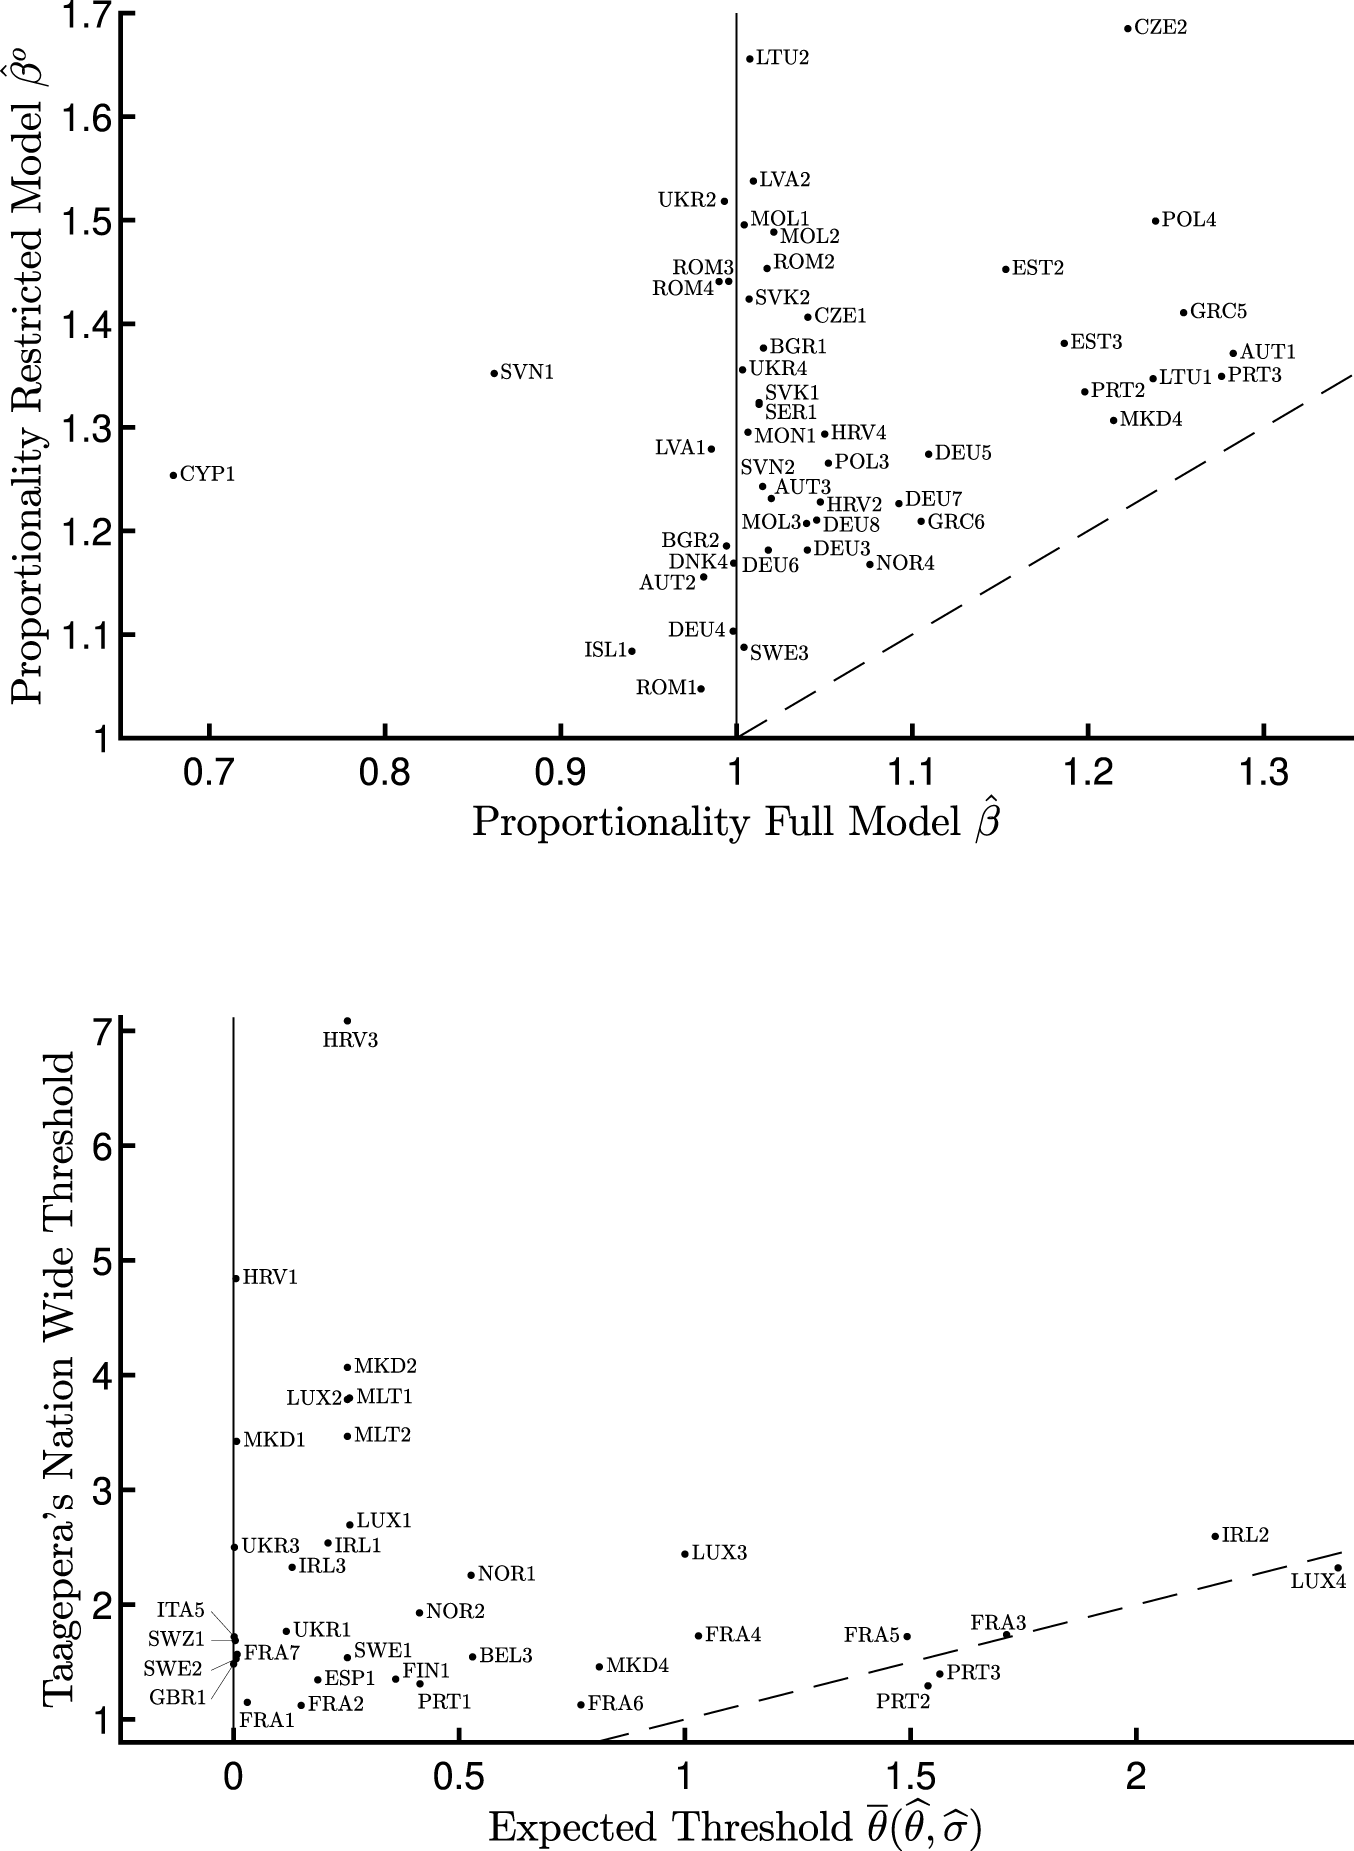
MAP-EM estimates versus alternative proportionality and threshold measures. The first plot illustrates overestimation of the proportionality parameter in the model without thresholds, in systems in which this restricted model is rejected. The second plot illustrates the exaggeration, compared to the MAP-EM estimates, of national electoral thresholds by Taagepera’s (Reference Taagepera2002) formula in the most comparable subset of electoral systems without upper tiers or legal thresholds. The 45 degree line is dotted. Based on results reported in Appendix I.

How different are our estimated measures from existing measures in the literature? When it comes to the proportionality parameter,
 $\unicode[STIX]{x1D6FD}$
, one obvious comparison is with the same parameter estimated with the restricted model (as in, for example, King and Browning (Reference King and Browning1987), King (Reference King1990), but without a partisan bias component). In Figure 3, we present the proportionality estimates of the full and restricted models for those systems for which the above test indicates significant differences in fit across the models.Footnote
22
If a system falls on the dotted line, this indicates that the unrestricted model’s disproportionality estimate is the same as that of the restricted model. As expected, ignoring the threshold brings an overestimation of disproportionality, indicated by the fact that most systems in the figure are above the dotted line. In particular, there is a group of systems that according to our estimates are close to being perfectly proportional for parties above the threshold for which the restricted model would overstate the advantages given to large parties—those near the vertical line at one (e.g., ROM1, SWE3, AUT2, DNK4).
Turning to the estimated thresholds, while there is no estimated alternative in the literature, there are a number of formulas that impute an electoral threshold from provisions of the electoral law (for example, Taagepera and Shugart (Reference Taagepera and Shugart1989), Lijphart (Reference Lijphart1994), Taagepera (Reference Taagepera2002), Ruiz-Rufino (Reference Ruiz-Rufino2007)). We now explore the differences between our estimated expected thresholds and the national thresholds of representation proposed by Taagepera (Reference Taagepera2002), which is a prominent alternative to our method. For this comparison, we compute Taagepera’s nationwide threshold using formula 8 in his paper according to our baseline electoral system definition.Footnote 23 We compare systems with no upper tiers and those without legal thresholds of any kind, as the formula is more likely to approximate the true threshold with noncomplex allocation rules (Taagepera Reference Taagepera2002, p. 394). The second panel in Figure 3 shows that for the majority of the systems considered, the formula-based threshold overstates the percentage of national vote required in order to win any seats. For a group of majoritarian systems for which Taagepera’s formula gives positive thresholds, our approach suggests thresholds close to zero (e.g., GBR1, HRV1, MKD1, UKR3). This highlights the ability of our estimator to flexibly account for the emergence of successful small seat-winning parties with geographically concentrated support. Even in nonmajoritarian systems the differences can be quite large. For example, while Taagepera’s formula would give an average threshold of 2.7% to the system in place in Luxembourg in 1945 (LUX1), our estimated threshold is 0.25%. Overall, there are only few systems where Taagepera’s approach gives results close to the MAP-EM estimates (IRL2, LUX4, FRA3, FRA5, FRA6, PRT2, PRT3).Footnote 24
4 Inference
We perform all inferences using the conventional approach that relies on model predictions at the point estimates and not the entire posterior, but a proper Bayesian execution of these tests is also possible and the reader can consult Online Appendix H for details. We start by discussing methods to evaluate the fit of the model. First, we devise a test of the hypothesis that the data are generated according to the estimated model. The test is based on a Pearson chi-square type of statistic as a weighted sum of squared deviations between actual and model predicted seat allocations,
 $$\begin{eqnarray}P(\{s_{t}\}_{t=1}^{T},\widehat{\unicode[STIX]{x1D703}},\widehat{\unicode[STIX]{x1D70E}},\widehat{\unicode[STIX]{x1D6FD}}):=\mathop{\sum }_{t=1}^{T}\mathop{\sum }_{i=1}^{N}\frac{(s_{i,t}-\overline{s}_{i,t}(\widehat{\unicode[STIX]{x1D703}},\widehat{\unicode[STIX]{x1D70E}},\widehat{\unicode[STIX]{x1D6FD}}))^{2}}{\overline{s}_{i,t}(\widehat{\unicode[STIX]{x1D703}},\widehat{\unicode[STIX]{x1D70E}},\widehat{\unicode[STIX]{x1D6FD}})},\end{eqnarray}$$
where
 $\overline{s}_{i,t}(\widehat{\unicode[STIX]{x1D703}},\widehat{\unicode[STIX]{x1D70E}},\widehat{\unicode[STIX]{x1D6FD}}):=S_{t}\sum _{z_{t}=1}^{N}q_{i,t}(v_{t},\widehat{\unicode[STIX]{x1D6FD}},u_{t,z_{t}})p(z_{t}\,\mid \,v_{t},\widehat{\unicode[STIX]{x1D703}},\widehat{\unicode[STIX]{x1D70E}})$
denotes party
 $i$
’s expected seats according to the estimated model. The intuition of the test is standard: If the observed allocation is close to the model’s prediction, then the value of the statistic will be small, whereas large values of the statistic would cast doubt on the ability of the model to account for the variation in the data. We compute empirical
 $p$
-values of the test via Monte Carlo simulations.Footnote
25
We find that the test rejects the null of the observed seat allocation being consistent with the model’s prediction for only 5 systems out of 116 (FRA2-4, FRA6, and MKD2) at the 5% significance level.Footnote
26
These results suggest that the model performs well accounting for variation in the data for the bulk of the estimated electoral systems.
We also assess the performance of the model relative to the restricted one (which restricts the national threshold to be zero), a common assumption in the literature heretofore. As an initial comparison, we perform a goodness-of-fit test for the restricted model that is analogous to the one described above. This time, the test rejects the null that the observed seats data are generated from the restricted model in 18 systems, a larger fraction relative to the case of the model allowing thresholds. A more systematic comparison is given by a statistical test of differences of fit between the two estimated models. The test statistic takes difference in sums of squared deviations between predicted and realized seats, and the rejection region is determined under the null that the data are generated from the estimated restricted model. Under that null hypothesis, large values of the statistic provide evidence in favor of the alternative model with thresholds. As mentioned earlier in 49 cases, the empirical
 $p$
-value of the test is below the 5% significance level. Overall, we see that the full model does a good job accounting for the variation in the data. These test results suggest that accounting for the threshold is warranted both statistically, and certainly politically, for a large fraction of systems.
4.1 Electoral System Change
We have conducted our analysis assuming an electoral system persists if (i) there are no changes in the allocation formula and (ii) the numerical legal thresholds, number of districts, or number of seats remain within 5% of that system’s average. While practical, this definition is arbitrary and highlights a more general problem in the literature, namely, the lack of a systematic way to identify whether formal changes in the electoral law—or, even changes not codified in the electoral law (for example, new districting practices)—translate to substantial changes in the resulting pattern of seat allocation. We build on the inferential approach developed in the previous subsection to propose a statistical test to detect changes in electoral systems. This test is meant to provide an objective way to evaluate whether hypothesized changes in electoral systems are statistically significant or not.
In a nutshell, the test compares the fit of the estimated model under a coarser definition with that of the combined models estimated applying a finer definition of the electoral system, which partitions the elections included in estimating the coarser system parameters. The test statistic is of a similar pedigree as previous tests in this section computing differences in sums of squared deviations between actual and predicted seats for the coarse and finer definitions. Under the null hypothesis of no change, the resulting test statistic should be small and we reject the null when the mass of the distribution of the statistic under the null that exceeds the computed value is less than the chosen significance level.
To illustrate this test, we perform two sets of comparisons between our default definition of electoral system and possible alternatives. One alternative is coarser and identifies a new electoral system only when the allocation formula changes (that is, ignoring any changes in seats, number of districts, or legal thresholds). The second alternative is finer and identifies a new electoral system whenever any change occurs in recorded institutions or when a change in electoral law not codified in our institutional variables is reported in our sources. When comparing the coarser definition against our default
 $5\%$
cutoff, we reject the null of no change for 10 of 20 of the tests at the
 $5\%$
significance level, that is, we find evidence against the coarser definition in 10 out of 20 of the cases when the two definitions classify elections into different systems. When comparing our default definition with the finer definition, we reject the null in 2 out of 24 tests at the
 $5\%$
level of significance. These tests are reported in Table 2 of Online Appendix J. These comparisons are not meant to be definitive in this context; they provide mild evidence in favor of a coarser definition, but also suggest that if one has to rely on an ad hoc rule, our 5% cutoff rule is not unreasonable.Footnote
27
At the same time, our test procedure also provides a data-driven alternative to the application of an ad hoc rule.
5 Conclusions
We have developed a new statistical model to summarize the translation of votes into seats. This model yields empirical estimates of national electoral thresholds of representation and of disproportionality of seat allocation for parties exceeding thresholds. These measures quantify conceptually distinct and politically relevant dimensions of the electoral system; they are comparable across systems and time, and they come with a gauge of uncertainty in the confidence we can place in them in the form of standard errors. We also developed a battery of inference procedures tailored to this model that allow us to evaluate model fit, compare estimated models, and evaluate changes in electoral systems over time.
Our statistical summary of the electoral system reflects the combined forces of party and voter incentives under the electoral law to produce the estimated pattern of seat distribution. In future work, we aim to use these estimates to understand better these equilibrium forces. Key to that undertaking is the development of procedures to separately identify the contribution of the “supply” (parties) and “demand” (voters) side of this interaction. Relatedly, one can also study how specific electoral institutional features translate into thresholds and advantages to large parties among those getting seats. Such an analysis would contribute to the study of the consequences of alternative electoral reform proposals and of institutional provisions that affect the representation of small groups in society.
Acknowledgments
We would like to thank the editor and two anonymous referees of this journal and the audience of the 2012 MPSA conference.
Supplementary material
For supplementary material accompanying this paper, please visit https://doi.org/10.1017/pan.2020.15.