Introduction
The link between eating habits, physical activity and body weight is well described in the literature (WHO, 2000), and numerous public health campaigns integrating these factors have been created and are still being used (Schmitz et al., Reference Schmitz, Jacobs, Leon, Schreiner and Sternfeld2000; Katz et al., Reference Katz, O'Connell, Yeh, Nawaz, Njike and Anderson2005; Lau et al., Reference Lau, Douketis, Morrison, Hramiak, Sharma and Ur2007). Unfortunately, according to recent reports from Statistics Canada, it appears that the recommendations promoted by these campaigns have not been completely effective as the prevalence of obesity is still on the rise among the adult population (Katzmarzyk, Reference Katzmarzyk2002; Tjepkema, Reference Tjepkema2005; CIHI, 2006).
In 2004, it was estimated that 23.1% of Canadian adults were obese and the combined proportion of both overweight and obese individuals represented 59.1% of the population (Tjepkema, Reference Tjepkema2005). In the province of Quebec, the proportions of overweight and obese individuals were estimated to be 33% and 14%, respectively, in 2003, which represents a net increase since 1987 (Mongeau et al., Reference Mongeau, Audet, Aubin and Baraldi2005). The proportion of individuals with excess weight has increased despite a lower reported fat intake and a stable energy intake since 1970–1972 (Garriguet, Reference Garriguet2006). The proportion of active individuals in Canada has been estimated to be 20% or 37%, depending on the definition of ‘active individual’. This proportion has increased by 10% since 1994–1995 (Craig & Cameron, Reference Craig and Cameron2004; Cameron et al., Reference Cameron, Craig and Paolin2005; Nolin & Hamel, Reference Nolin, Hamel, Venne and Robitaille2005). Therefore, even though improvements have been seen for some determinants of body weight, the overall energy balance still seems to be positive. This suggests that the relationship between eating habits, physical activity and body weight must be integrated into more complex health behaviour models that include eating habit and physical activity psychosocial determinants that affect weight control (Daveluy et al., Reference Daveluy, Pica, Audet, Courtemanche, Lapointe and Autres2000; Ledoux & Rivard, Reference Ledoux and Rivard2000; WHO, 2000; Wetter et al., Reference Wetter, Goldberg, King, Sigman-Grant, Baer and Crayton2001; Seefeldt et al., Reference Seefeldt, Malina and Clark2002; Spence & Lee, Reference Spence and Lee2003; Katz et al., Reference Katz, O'Connell, Yeh, Nawaz, Njike and Anderson2005; Kremers et al., Reference Kremers, Visscher, Seidell, van Mechelen and Brug2005). Therefore, to better understand body weight management in a psychosocial context, the objective of this study was to investigate the associations between specific body weight psychosocial correlates and body mass index (BMI) among four groups of adults in the Quebec population.
Methods
This secondary data analysis was completed using the Quebec Social and Health 1998 Survey (QSHS98), accessible from the Institut de la Statistique du Québec (ISQ). The QSHS98 was a cross-sectional survey conducted to collect information on the health status and well-being of the Quebec population among 30,000 individuals in 1998. Data were collected using two questionnaires: one interviewer-administrated (IAQ) and one self-administrated (SAQ). Aside from one variable (estimating lack of food variety due to financial restriction from the IAQ), all other data used for this study were taken from the SAQ, which included 20,773 individuals recruited from 15,330 private households (Daveluy et al., Reference Daveluy, Pica, Audet, Courtemanche, Lapointe, Côté and Baulne2001).
The following questions were used for the analysis:
• In general, compared with other people, how would you say your eating habits are?
• Are you eating the same food items many times during the month due to lack of money?
• During your leisure time in the past 3 months, how often have you engaged in a physical activity for up to 20 or 30 minutes at a time?
• How many times have you engaged in each of the following activities in the past 12 months: cycling or walking as a means of transportation?
• Which of the following sentences best describes your usual work habits or activities: usually sitting, stand or walk quite a lot, carry loads or climb stairs?
• Are you currently trying to lose weight?
• Would you like to change your weight?
• For you, how easy would engaging in a regular physical activity for 20–30 minutes at a time during your leisure time in the coming year be?
• How often have you felt a lack of self-confidence during the past month?
• Do any of your children under 18 years of age live with you?
• At the present time, do you work at a paid job?
• In general, compared with other people your age, how would you say your health is?
• Please indicate the highest level of education you have completed.
• How do you perceive your financial situation compared with other people your own age?
In addition, a composite index constructed by the QSHS98 was used. The psychological distress index is based on questions covering aspects like feeling lonely, being discouraged, under pressure, losing temper or getting angry over things that were not too important. The social support index included questions on socializing, time being alone, having friends and satisfaction with social life. Intellectual demand and time constraints related to work were used to construct the psychological demand related to work.
The validity of the questions used to depict characteristics of the Quebec (Canada) population is explained in detail in the methodology manuals (Levasseur, Reference Levasseur2000; Audet, Reference Audet2001; Audet et al., Reference Audet, Lemieux and Cardin2001; Daveluy et al., Reference Daveluy, Pica, Audet, Courtemanche, Lapointe, Côté and Baulne2001; Institut de la statistique du Québec, 2001). Briefly, the questions reflected results from validation studies or accepted measures used since the initial Santé Quebéc surveys in 1987.
A demographic description of the population sample has previously been reported by Daveluy et al. (Reference Daveluy, Pica, Audet, Courtemanche, Lapointe and Autres2000). Briefly, for individuals aged between 20 and 64 years, the proportions of underweight, normal, overweight and obese individuals were 8.9%, 62.3%, 16.3% and 12.7%, respectively. The proportion of obese individuals decreased with higher levels of education, but no clear trend was observed with income (Ledoux & Rivard, Reference Ledoux and Rivard2000). Regarding their perception of eating habits, 39.4% considered them as very good or excellent, 45.3% as good and 15.3% as fair or poor (Dubois et al., Reference Dubois, Beauchesne, Girard, Bertrand and Hamelin2000). In the 15 years and older group, 48% of individuals reported practising leisure time physical activity (LTPA) 20–30 minutes each session less than once a week, 26% one or two times per week and 26% three times or more per week (Nolin et al., Reference Nolin, Godin and Prud'homme2000). At the time of the survey, 34% of individuals over 15 years of age were smokers (Bernier et al., Reference Bernier, Brochu and Rivard2000). In the same age group, 37% of individuals reported no alcohol intake during the week, 37.7% had 1–6 drinks, 15.3% had 7–13 drinks and 10% had more than 14 drinks (Chevalier & Lemoine, Reference Chevalier and Lemoine2000). Most (89%) of the individuals reported that they considered their health to be excellent, very good or good (Levasseur, Reference Levasseur2000).
Since age and sex are well documented correlates of BMI (King et al., Reference King, Fitzhugh, Bassett, McLaughlin, Strath, Swartz and Thompson2001; Kouvonen et al., Reference Kouvonen, Kivimaki, Cox, Cox and Vahtera2005) analysis was done in four age–sex groups. Sample sizes for specific groups of men were 3882 for the 25- to 44-year-olds and 4395 for the 45- to 64-year-olds. For women, the sample sizes were 3066 and 3295, respectively. These age groups were chosen according to database restrictions and represent the average adult population. Other age groups were available, such as the 15- to 24-year-old and 65+ groups, but the sample size of those groups did not allow detailed analysis as for the selected groups. Therefore, these age groups were not used in the present study.
Potential body weight correlates were selected from the database and classified according to the systemic model (Clarkson & Pica, Reference Clarkson and Pica1995) used by Daveluy et al. (Reference Daveluy, Pica, Audet, Courtemanche, Lapointe and Autres2000) in the initial report. According to the Clarkson and Pica model, the systemic model includes five levels: the individuals' characteristics, living environment, social network, social conditions and physical environment and finally, norms and cultural beliefs. The model was primarily used to classify the independent variables and not to validate its ability to explain body weight variations. Some variables may originate from different health behaviour models but were still classified in the present model.
The BMI was calculated based on reported weight and height by study participants. The BMI categories used in the analysis correspond to the guidelines published by Health Canada and used in previous social and health surveys (Daveluy et al., Reference Daveluy, Pica, Audet, Courtemanche, Lapointe, Côté and Baulne2001; Santé Canada, 2003). The categories underweight and normal weight were re-grouped since, when used as separate categories, valid statistical analysis was not possible due to the sample size being too small.
Statistical analyses
The methodology used to estimate the proportions was based on the guidelines provided by Santé Québec (Daveluy et al., Reference Daveluy, Pica, Audet, Courtemanche, Lapointe, Côté and Baulne2001). It is specific to the survey and takes into account the complex survey design. Therefore, the analyses considered study design, population weight, strata code, primary sampling unit and final sampling unit effects.
The quality level of the estimated proportions presented is based on coefficients of variation issued from the sampling variability tables and reflects the study design and sampling techniques employed. Overall, the quality level of estimates fell into one of the following categories: estimates with coefficients of variation (CV) less than 15%, which do not need any comment; estimates with CV between 15% and 25%, which were considered as tolerable and should be interpreted with caution; and finally, estimates with CV above 25%, which were presented only for reference and that should be interpreted with extreme caution.
Chi-squared analyses were generated using the SAS program version 8.02 (SAS Institute, Cary, NC) and weighted with the suggested variables. The sampling effect was also incorporated in the analysis when appropriate.
Since education, perceived financial situation, smoking and perceived health status were variables already identified as correlates of BMI in this population (Daveluy et al., Reference Daveluy, Pica, Audet, Courtemanche, Lapointe and Autres2000), they were included in the logistic regression even if chi-squared analysis was not done. Statistical analyses have been conducted at a threshold of α=0.05. Logistic regression analyses were done using the software Sudaan (version 9.0.1, Research Triangle Institute, NC). Since Sudaan does not include a function to automatically select variables that would be significant in a logistic model, all the variables that were significantly associated according to the chi-squared analysis were included.
The estimates presented in the chi-squared analysis are valid estimates for the Quebec population. Since sub-groups of individuals were used in the regression analysis, association found may not represent this entire population.
Results
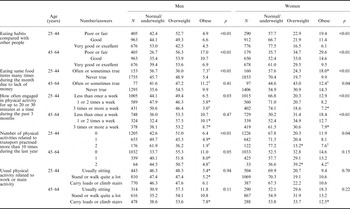
The results from the chi-squared analysis are presented in Tables 1–4. Most of the eating and physical activity habits were associated with BMI in at least one age-group (Table 1). Inverse associations were found between the perceived eating habits and BMI in all groups. Eating the same food items many times during the month due to lack of money was associated with a higher BMI in the 25- to 44-year-old groups and 45- to 64-year-old women. In the 25- to 44-year-old men and women of 25–44 and 45–64 years, BMI decreased as individuals engaged in physical activity for up to 20 or 30 minutes more frequently during the last 3 months. Body mass index also decreased as the number of transport-related physical activities (TPAs) increased in most groups, with the exception of the 44- to 65-year-old women where the trend did not reach significance. No association or trend was found between the usual physical activity related to work or main activity and BMI.
Estimated proportion (%) of overweight/obese individuals according to eating and physical activity habits

* Coefficient of variation between 15% and 25%; interpretation should be looked at cautiously.
† Coefficient of variation >25%; imprecise estimate, data presented as references only.
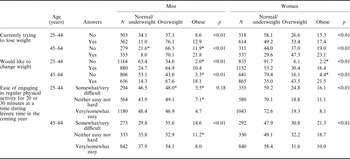
Estimated proportion (%) of overweight/obese individuals according to attitude toward body weight and the perceived behavioural control face to LTPA practice

* Coefficient of variation between 15% and 25%; interpretation should be looked at cautiously.
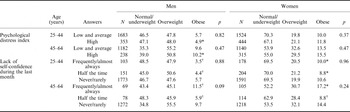
Estimated proportion (%) of overweight/obese individuals according to individuals psychological correlates

* Coefficient of variation between 15% and 25%; interpretation should be looked at cautiously.
† Coefficient of variation > 25%; imprecise estimate, data presented as references only.
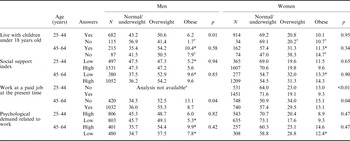
Estimated proportion (%) of overweight/obese individuals according to social network and environment correlates

* Coefficient of variation between 15% and 25%; interpretation should be looked at cautiously.
† Coefficient of variation >25%; imprecise estimate, data presented as references only.
a The analysis was not available since the sample size for each category did not meet required standards.
Significant associations were found between the attitude toward body weight, the ‘perceived behavioural control’ face to LTPA practice, often defined as the easiness of engaging in regular physical activity, and BMI (Table 2). In all groups, the proportion of individuals reporting higher BMI values increased in individuals who would like to change weight or who are currently trying to lose weight. However, the proportion of individuals reporting higher BMI decreased when they reported it would be somewhat or very easy to practise physical activity in the coming year. The association was significant in all groups except the 25- to 44-year-old men.
None of the psychosocial variables identified as possible correlates of body weight was found to be associated with BMI (Table 3).
Associations between social network or environment correlates and BMI are presented in Table 4. Living with children under 18 years of age was associated with higher BMI only in the 24- to 44-year-old men. No trend was found in the other age groups. No association was found between the social support index and psychological demand and BMI. In all groups where the analysis was available, reported BMI decreased with reported working at a paid job at the present time.
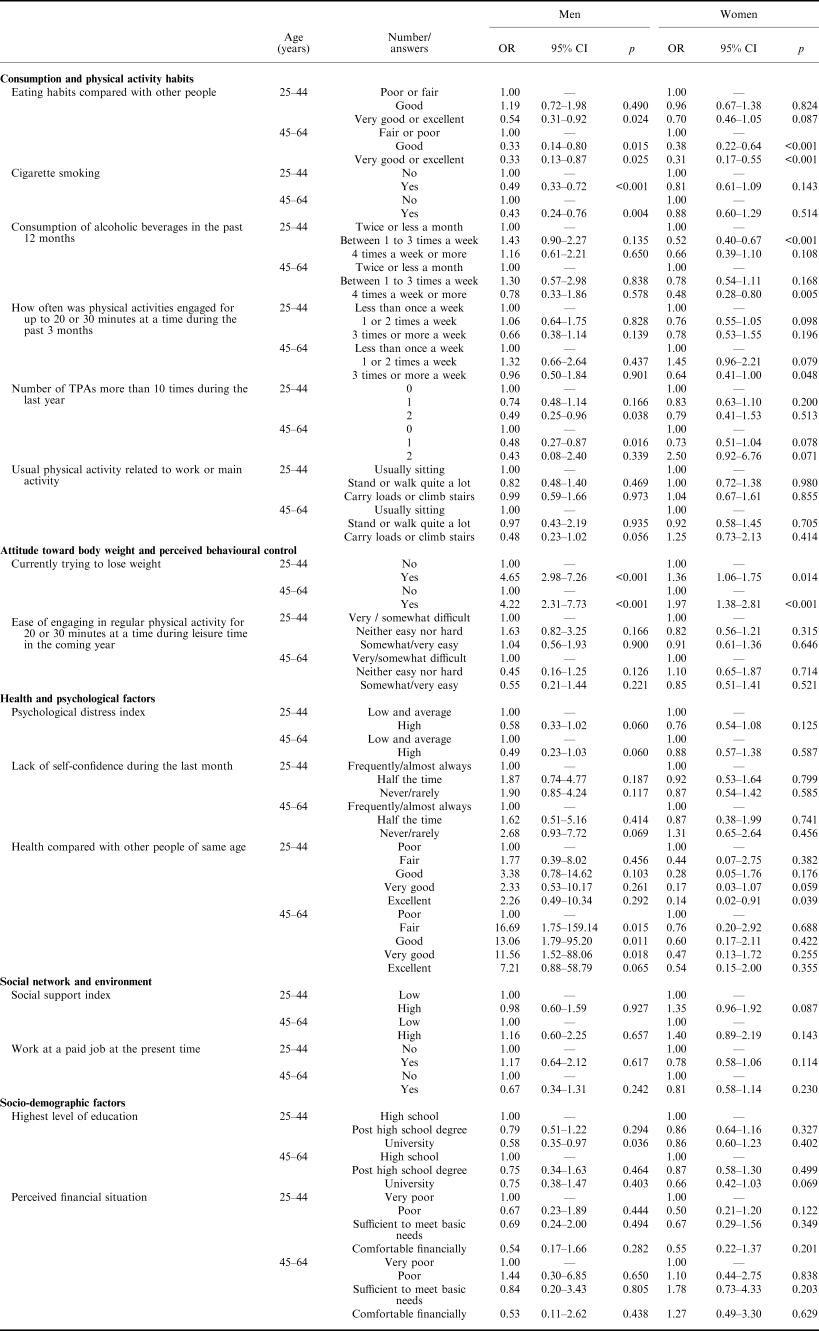
Predictors of reporting having an excess weight (overweight or obese) according to the logistic regression are presented in Table 5. Many variables identified, such as food and alcohol consumption and physical activity habits, were retained as significantpredictors of reporting an excess weight. Eating habits were a significant predictor of an excess weight in most groups with the exception of the 25- to 44-year-old women where the trend was not significant. In younger men, when compared with individuals reporting poor or fair eating habits, the odds of reporting an excess weight decreased when individuals reported very good or excellent eating habits. For both 45- to 64-year-old men and women, the odds of reporting higher BMI decreased when reporting good, very good or excellent eating habits. Most of the individuals reporting smoking cigarettes had lower odds of reporting an excess weight, but the associations were significant only in men. In women, more frequent alcohol consumption was associated with lower odds of reporting an excess weight. In the 25- to 44-year-old women, the association was significant when they reported consuming alcoholic beverages between one and three times a week. In the 45- to 64-year-old women, the association was significant when they reported consuming alcohol four times a week or more. Leisure time physical activity (LTPA) was a predictor of body weight only in the 45- to 64-year-old women. Higher number of TPAs was associated with lower odds of reporting an excess weight in men but not in women.
Odds ratio (OR) of reporting an excess weighta according to variables identified as possible predictors of body weight
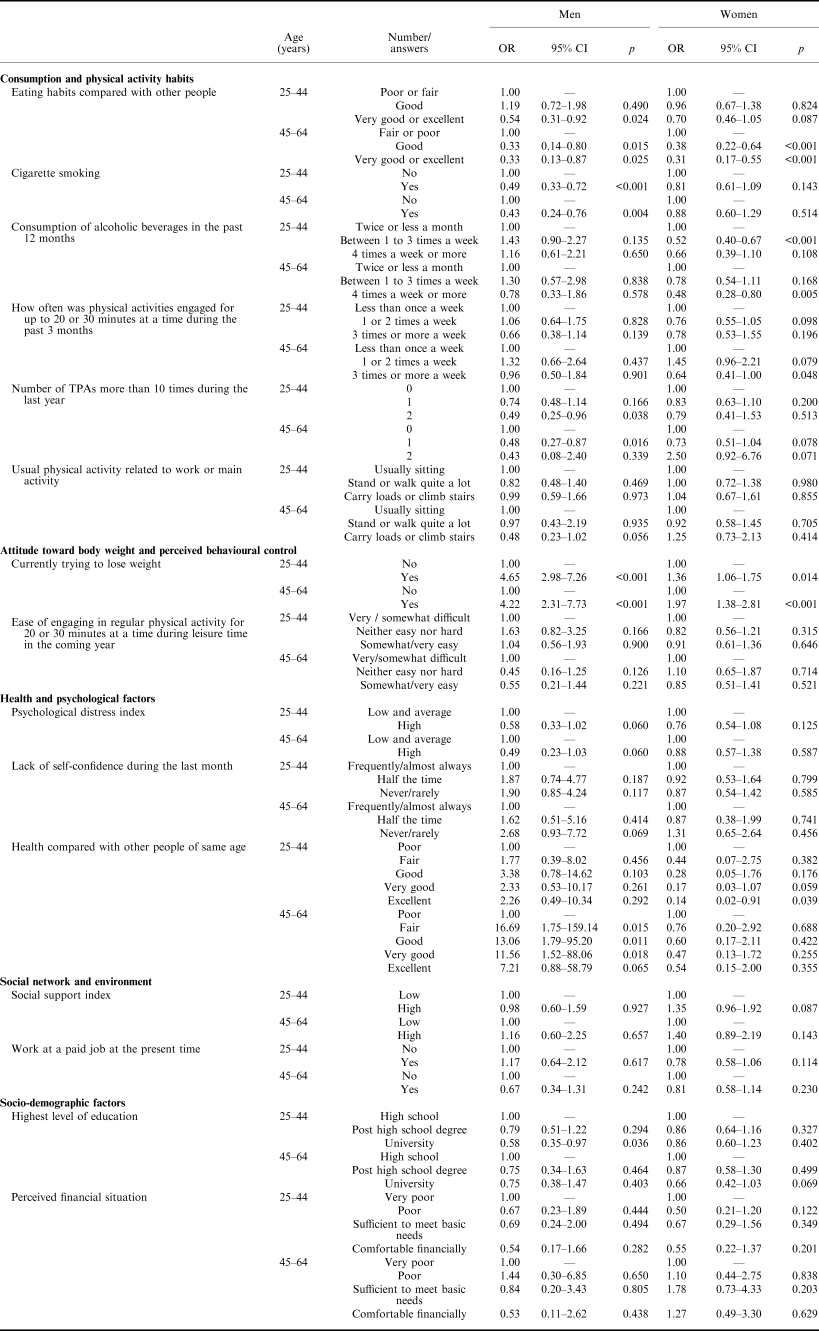
25- to 44-year-old males: N=1214; R 2=0.15.
25- to 44-year-old females: N=1830; R 2=0.09.
45- to 64-year-old males: N=915; R 2=0.13.
45- to 64-year-old females: N=1120; R 2=0.11.
a Odds ratios of reporting a BMI ≥25 compared with reporting a BMI <25.
The variable ‘currently trying to lose weight’ was retained as a significant predictor of reporting an excess weight; as the individuals reported currently trying to lose weight, the odds of reporting an excess weight increased.
Trends were observed between the variables classified as psychological determinant of body weight. In both men groups, reporting higher distress decreased the odds of reporting an excess weight, but the trend did not reach a significant level. Similarly, never or rarely lacking in self-confidence tended to increase the odds of reporting an excess weight in the 45- to 64-year-old men, but it did not reach a significant level. Perceived health status was found to be a significant predictor of BMI in some age groups but opposite associations were observed between genders. In the 45- to 64-year-old men, better perceived health increased the odds of reporting an excess weight. However, the odds of reporting an excess weight decreased with better perceived health in 25- to 44-year-old women.
In 25- to 44-year-old men, the odds of reporting an excess weight decreased as the highest level of education increased. Similar trend was observed in the other groups but the association did not reach a significant level.
Discussion
The objective of the present work was to study the associations between body weight psycho-social correlates and BMI in the Quebec population. The results provide new insights for programme planning and suggest that each group studied has specific characteristics that need to be taken into account.
According to the chi-squared analysis, often or sometimes eating the same food items many times during the month due to lack of money was associated with higher BMI. It is possible that individuals with lower income perceive food items high in calories or pre-prepared food as less expensive, therefore consuming food with higher energy content which negatively influences body weight (McCrory et al., Reference McCrory, Fuss, McCallum, Yao, Vinken, Hays and Roberts1999). This hypothesis might explain the increase in proportion of obese individuals that report lower variety due to lack of money, as seen in all groups except the 45- to 64-year-old men. Unfortunately, the inclusion of this variable in the logistic models extensively reduced the number of subjects used for the analysis due to combined non-response. This would have had the effect of restricting the inclusion of many other variables and reducing the chance of studying a representative sample of the Quebec population. Thus, it was decided to exclude it from the multivariate analysis. The exclusion of this variable could have precluded controlling for the effect of financial situation. On the other hand, a proxy of financial situation was added in the logistic regression in effort to control the effect of a lack of money. Therefore, it was estimated that the financial situation dimension was taken into account.
Excess weight has been found to be negatively correlated with physical activity in many studies, even after controlling for confounding factors such as age, sex, education, recent weight change, social class, marital status, country of origin and smoking (Brownson et al., Reference Brownson, Eyler, King, Brown, Shyu and Sallis2000; Burton & Turrell, Reference Burton and Turrell2000; Kromhout et al., Reference Kromhout, Bloemberg, Seidell, Nissinen and Menotti2001; Lahti-Koski et al., Reference Lahti-Koski, Pietinen, Heliovaara and Vartiainen2002; Trost et al., Reference Trost, Owen, Bauman, Sallis and Brown2002; Mack et al., Reference Mack, Anderson, Galuska, Zablotsky, Holtzman and Ahluwalia2004). Thus, the inverse association between reporting being active and BMI in 45- to 64-year-old women was expected. The association between TPA and BMI in the chi-squared analysis was confirmed only in men by the logistic regression. The lack of significant associations in some groups may be due to the high variability of some estimates. For example, the coefficient of variation for the proportion of obese individuals that reported practising two TPAs are all considered as imprecise estimates and they should be used for reference only. It is also possible that women are not travelling long or fast enough to influence the overall energy balance or body weight. In an additional analysis not presented in this article, practising light physical activity such as gardening or golf was not associated with BMI. This may support the hypothesis that sufficient physical activity needs to be done to influence body weight, as proposed by Fogelhom (Reference Fogelholm2005). Thus associations suggested by the chi-squared analysis may provide an indication that including TPA may play a role in weight management but more studies are needed to obtain confirmation of the role of TPA in weight management in this population.
In the chi-squared analysis, the perceived behavioural control face to LTPA practice estimated with the ease of engaging in physical activity in the coming year was associated with a lower BMI in most age groups. Similar results have been observed by other authors (Roach et al., Reference Roach, Yadrick, Johnson, Boudreaux, Forsythe and Billon2003; Martin et al., Reference Martin, Dutton and Brantley2004; Spencer et al., Reference Spencer, Adams, Malone, Roy and Yost2006). However, the variable was not retained in the logistic model. Since the intention of practising physical activity and the perceived behavioural control face to LTPA practice are usually correlated (Trost et al., Reference Trost, Owen, Bauman, Sallis and Brown2002), it is surprising not to observe a significant association in the logistic models. The absence of association may indicate an effect of confounding variables in the initial analysis. This may also suggest that individuals with excess body weight are not considering physical activity as an easy method for weight control. Therefore, programmes promoting normal weight may have to focus not only on explaining the advantages of engaging in physical activity but also suggest avenues for easily incorporating physical activity into daily activities.
Results from Christakis & Fowler (Reference Christakis and Fowler2007) support the role of social interaction in obesity. They observed that the risk of becoming obese increased when the individual had also a friend who was obese. One hypothesis that may support this association could be that individuals with greater social support may have more opportunities to be socialized. If socialization is paired with eating opportunities, it is possible that the individuals may consume more energy than required. In the present analysis, even if the odd ratios increased in women, high social support was not significantly associated with higher odds of reporting excess weight. Therefore, it was not possible to confirm the above hypothesis using the present sample.
In the present study, living with children was significantly associated with higher BMI in 25- to 44-year-old men according to the chi-squared analysis. Since this variable was not included in the logistic models, it was not possible to rule out potential confounding effects of these variables. Still, similar to the present results, Anderson et al. (Reference Anderson, Marshall and Lea2004) observed an increased BMI in couples that begin to cohabitate. They suggested changes in eating habits to explain their results. An evaluation of potential associations between living with children and eating habits or physical activity is needed to clarify how this variable could impact weight control.
Demographics or health indicators often reported to be correlates of body weight were included in the logistic models in an attempt to control for potential confounders.
The lack of association between the perceived financial situation and BMI is not consistent with other studies' results presented for the same population (Ledoux & Rivard, Reference Ledoux and Rivard2000; Mongeau et al., Reference Mongeau, Audet, Aubin and Baraldi2005). The logistic regressions analyses presented included many variables in an effort to control for their possible effects on BMI. Thus, the effect of financial situation on BMI may be mediated via one or many of the other variables included in the regression. According to subsequent work, it was observed that financial situation was associated with perceived eating habits. In the present article, eating habits were associated with BMI. Therefore, it could be proposed that the effect of financial situation on BMI is mediated via eating habits. The lack of association between perceived financial situation and BMI may also be due to the validity of the proxy used. Individuals are biased towards not choosing the extremities of the scale presented, thus avoiding reporting being very poor or comfortable financially.
Perceived health status was a significant predictor of BMI in 24- to 44-year-old women and 45- to 64-year-old men. Different authors have reported similar associations between perceived health and obesity (Osler et al., Reference Osler, Heitmann, Hoidrup, Jorgensen and Schroll2001; Anderson et al., Reference Anderson, Eyler, Galuska, Brown and Brownson2002; Lahti-Koski et al., Reference Lahti-Koski, Pietinen, Heliovaara and Vartiainen2002; Mack et al., Reference Mack, Anderson, Galuska, Zablotsky, Holtzman and Ahluwalia2004). Important differences are seen between the associations found in men and those found in women. In 45- to 64-year-old men, the positive association observed leads to the suggestion that individuals do not see excess weigh as having an impact on their health at this point in time, or that the excess weight had no impact on their health yet, which is the opposite of what is seen in women. Thus, in older men, weight management programmes should focus on early identification of the present and future health impact of obesity on their health status.
To increase the chances of influencing the habits of the groups studied, both the form and the content of the approach should be adapted. For example, older men could be influence by an intervention that would allow them to self-assess their BMI and link it to possible health problems already experienced. On the other hand, since women are already aware of the health issues related to high BMI, intervention could focus on facilitating healthy behaviours that are impeded by logistic barriers.
Several limitations were outlined throughout the discussion when addressing each variable. Overall, many of them were linked to the ‘proxy’ nature of the variables used. Thus, it is possible that the variables chosen may not adequately represent the psychosocial characteristic targeted. In addition, the validity of the answer may be affected by the self-reported nature of the study. The cross-sectional design is an important limitation of the present study. Due to the nature of this design, it was not possible to qualify the direction of the relation between variables found to be associated. Thus, it is suggested that the associations found in the present study be studied using a longitudinal design. Finally, due to the complexity of any environmental/biological phenomena such as weight management, it is more than possible that other variables such as genetics and biological factors, not included in the study, may be confounding the results presented.
Conclusion
Usually weight management programmes consider adults to be a homogenous group. However, the present study outlines differences at different ages. Therefore, weight management programmes should approach each group differently to increase individual commitment. Addressing specific correlates of each age group would make better use of available resources and may increase the chance of achieving weight control.
Acknowledgment
The authors declare that there are no conflicts of interest, and that this study did not benefit from any grant from a funding agency or commercial or not-for-profit organization.