




Understanding the prescription trends and costs of psychotropic medications is essential in today’s healthcare landscape, where mental health conditions are highly prevalent, 1,2 and treatment options continue to expand. Reference Bozzatello, Novelli, Schisano, Brasso, Rocca and Bellino3 Psychotropic medications – including antidepressants, antipsychotics, anxiolytics and mood stabilisers – are widely prescribed across health systems, with sustained increases observed in several high-income and low- and middle-income countries. Reference Alabaku, Yang, Tharmarajah, Suda, Vigod and Tadrous4,Reference Brauer, Alfageh, Blais, Chan, Chui and Hayes5 Monitoring prescribing patterns provides insight into population-level treatment practices, Reference Khawagi, Steinke, Carr, Wright, Ashcroft and Avery6 potential inappropriate use, Reference Khawagi, Steinke, Carr, Wright, Ashcroft and Avery6 polypharmacy Reference Mojtabai and Olfson7 and inequities in access to mental healthcare. Reference Jones, Petersen, Walters, Bhanu, Manthorpe and Raine8 Concurrently, high costs of psychotropic medications contribute substantially to overall pharmaceutical spending, posing challenges for health system sustainability and affordability. Reference Kesselheim, Avorn and Sarpatwari9,Reference Todesco, Ostuzzi and Barbui10 Together, analysing trends in both utilisation and costs is important for informing evidence-based policy, optimising resource allocation and improving quality and access to mental healthcare.
However, up-to-date evidence on prescription trends and associated costs over an extended period for a comprehensive range of mental disorders at a country level is limited. Existing studies on prescription trends focus on the global trend, Reference Alabaku, Yang, Tharmarajah, Suda, Vigod and Tadrous4,Reference Brauer, Alfageh, Blais, Chan, Chui and Hayes5,Reference Huang, Yang, Wei, Yan, Lee and Leung11 or are confined to certain types of psychotropic drugs. Reference Hálfdánarson, Zoëga, Aagaard, Bernardo, Brandt and Fusté12–Reference Rabeea, Merchant, Khan, Kow and Hasan15 Studies that examine prescription costs for mental disorders over time are even scarcer, and provide inconsistent findings. 16–Reference Mark, Levit, Buck, Coffey and Vandivort-Warren20 Furthermore, the potential effect of the COVID-19 pandemic on these prescription trends and costs remains unclear, despite a documented rise in the prevalence of mental disorders globally and in the UK during the pandemic. 2,Reference Pierce, Hope, Ford, Hatch, Hotopf and John21 Monitoring the pandemic impact on prescriptions and costs reflects how the healthcare system responded to shifts in demand and supply, and can enhance preparedness for future public crises affecting mental health. This study adds to the existing knowledge on psychotropic medications by examining trends in their annual prescription volume and associated costs from 2013 to 2023 in the UK. Additionally, we assessed changes in the prescriptions after the onset of the COVID-19 pandemic.
Method
Study design
We conducted a longitudinal study of the prescriptions and costs of psychotropic drugs from the four Prescription Cost Analysis (PCA) databases over 10 financial years from April 2013 to March 2023. Reference Tsai and Nguyen22
Data sources
The PCA databases collect prescribing and dispensing data at the community level when prescriptions are sent to the National Health Service (NHS) for reimbursement. The PCA databases contain prescribing and dispensing information for England, 23,24 Northern Ireland, 25 Scotland 26,27 and Wales. 28 Prescriptions in the PCA databases are organised following the British National Formulary (BNF) therapeutic classification system, 29 whereby prescriptions are clustered under the BNF chapters, sections and subsections based on their therapeutic functions. Data from the PCA databases are collected on a financial year basis and are publicly available online. A financial year is from April to March of the following year.
Drug classes and costs
The PCA databases contain data on the BNF therapeutic classification, the number of prescription items and the costs of individual drugs. A prescription item refers to a therapeutic drug listed on a prescription form, regardless of tablets, capsules or injections. The cost is defined as the basic price of a drug before discounts are applied and does not include dispensing fees. All costs are in British pounds.
Data extraction and preparation
We selected six drug classes from the therapeutic chapter ‘Central Nervous System’, including hypnotics and anxiolytics, drugs used in psychoses and related disorders, antidepressant drugs, central nervous system stimulants and drugs used for attention-deficit hyperactivity disorder, drugs used in substance dependence and drugs for dementia. Reference Tsai and Nguyen22
Using BNF subsections, we categorised the drug class ‘hypnotics and anxiolytics’ into two drug subclasses, ‘hypnotics’ and ‘anxiolytics.’ We grouped antidepressant drugs into four subclasses: ‘tricyclic and related antidepressants (TCAs)’, ‘monoamine oxidase inhibitors (MAOIs)’, ‘selective serotonin reuptake inhibitors (SSRIs)’ and ‘other antidepressants’. Other antidepressants contained antidepressant drugs that did not belong to the former three drug subclasses, including serotonin and noradrenaline reuptake inhibitors and atypical antidepressants, such as mirtazapine.
We classified antipsychotic drugs into typical or atypical to capture the differences in their side-effects, Reference Tandon and Jibson30 which is a common measure in drug utilisation studies. Reference Brauer, Alfageh, Blais, Chan, Chui and Hayes5,Reference Hálfdánarson, Zoëga, Aagaard, Bernardo, Brandt and Fusté12,Reference Iaru, Bucsa, Farcas, Pop, Cristina and Armean31 If drug subsections were not identifiable in the datasets (<0.001% of prescriptions for all psychotropic drugs), we excluded them from the analysis by drug subclasses.
We coded the variable ‘year’ sequentially from 1 to 10, starting with the financial year 2013/14 as 1. We defined the onset of the COVID-19 pandemic as March 2020, when the World Health Organization declared the outbreak of a pandemic and the UK introduced a nationwide lockdown. 32 All drugs dispensed after March 2020 were treated as prescriptions following the onset of the pandemic. Accordingly, we generated a binary variable ‘COVID-19 pandemic’ by coding the financial years 2020/21, 2021/22 and 2022/23 as 1 to reflect the pandemic years and the other years as 0 to reflect the pre-pandemic years. Reference Tsai and Nguyen22
Data analysis
First, we conducted descriptive analyses to derive the annual prescription counts, annual prescription costs and average costs per drug, which were disaggregated by the six drug classes and eight subclasses for the entire study period between 2013 and 2023. We computed the average cost per drug by dividing the annual prescription cost of one specific drug class and subclass by the corresponding annual prescription count for a given financial year. Reference Tsai and Nguyen22 We adjusted all costs before 2022/23 for inflation based on the annual inflation rates for pharmaceutical products in the UK, 33 using 2023 as the base year.
Second, to examine temporal trends in psychotropic prescriptions between 2013 and 2023, we fitted a simple linear regression model (model 1) with annual prescription counts as the dependent variable and financial year (coded sequentially from 1 to 10) as the independent variable. The regression coefficient represents the mean annual change in prescription volume, with mean annual percentage change calculated by dividing the coefficient by the baseline prescription count in 2013/14. Reference Tsai and Nguyen22
Third, to assess whether prescription volume changed during the COVID-19 pandemic years relative to the underlying temporal trend, we fitted a multiple linear regression model (model 2) with annual prescription counts as the dependent variable and two independent variables (financial year and COVID-19 pandemic). The coefficient for financial year estimates the secular trend in prescription volume, whereas the pandemic coefficient estimates the mean annual deviation in prescription volume during the pandemic years relative to the expected volume based on the underlying trend. This deviation was additionally expressed as a percentage change of the mean annual prescription volume during the pre-pandemic period. Both models considered a two-sided p < 0.05 to be statistically significant.
Finally, given the small number of yearly observations (n = 10) in model 1, we also analysed monthly data, which was available for Northern Ireland (n = 108), as a sensitivity analysis, relying on a more extensive sample. The results of the sensitivity analysis on monthly data in Northern Ireland are presented in the Supplementary Material available at https://doi.org/10.1192/bjo.2026.12141.
Ethical considerations
As the PCA data-sets contain no personally identifiable information and are publicly available, the study was not submitted to an ethical review board.
Results
Annual prescriptions and costs
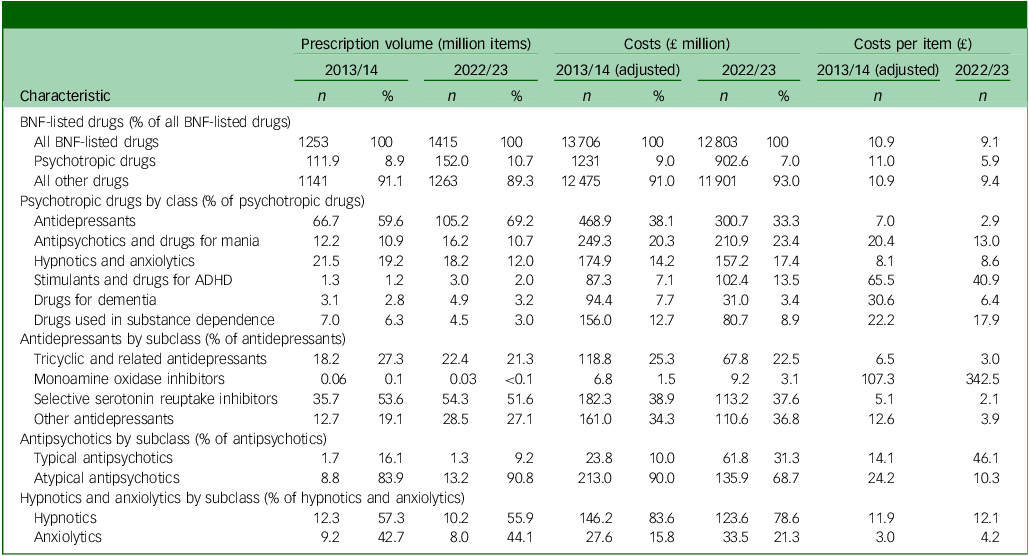
Prescription counts for most drug classes and subclasses increased from 2013/14 to 2022/23. The number of all psychotropic prescription drugs rose from 111.9 million in 2013/14 to 152 million in 2022/23, accounting for a higher proportion of all BNF-listed drugs at 10.7% in 2022/23, compared with 8.9% in 2013/14. The prescription counts for all BNF-listed drugs other than psychotropic drugs increased from 1.1 billion to 1.3 billion in the same period. Although most classes of psychotropic drugs, including antidepressants, antipsychotics, stimulants and anti-dementia drugs, experienced an increase in prescription counts, prescriptions for hypnotics and anxiolytics and drugs used for substance dependence showed a decline. Disaggregated by drug subclasses, we identified variations within the same drug class. MAOIs were less dispensed, in contrast to the other three antidepressant subclasses. For antipsychotics, more atypical but fewer typical antipsychotics were dispensed.
In contrast to the increase in prescriptions, the annual prescription costs of psychotropic drugs declined from £1.2 billion (after adjusting for inflation) in 2013/2024 to £902.6 million in 2022/2023. By 2022/23, they accounted for a smaller proportion of total prescription costs of all BNF-listed drugs, equivalent to 7%, down from 9% in 2013/14. The average cost per drug went down to £5.9 in 2022/2023 from £11 in 2013/2014 (after adjusting for inflation). Although the costs of all BNF-listed drugs other than psychotropic drugs also fell during the study period, their average cost per drug dropped from £10.9 to £9.4 (after adjusting for inflation), much less than that of psychotropic drugs. All drug classes except stimulants saw a decline in annual prescription costs, and all classes except hypnotics and anxiolytics saw a decrease in average costs per drug. Of eight drug subclasses, MAOIs and typical antipsychotics were the two subclasses whose average costs per drug tripled by 2022/23. A detailed description of the annual prescription counts, costs and average costs per drug, disaggregated by drug classes and subclasses, is shown in Table 1 for the beginning and last study years (2013/14 and 2022/23), and in Supplementary Tables 1–3, Supplementary Figs 1–3 for all 10 financial years.
Annual prescription volume and costs of psychotropic drugs in the UK in 2013/14 and 2022/23

Table 1 Long description
The table presents data on the prescription volume, costs, and costs per item of various psychotropic drugs in the UK for the years 2013/14 and 2022/23. It includes columns for prescription volume in million items, costs in million pounds, and costs per item in pounds. The table is divided into sections for BNF-listed drugs, psychotropic drugs, and other drugs, with further breakdowns by drug class and subclass. Each row provides specific data for different categories of drugs, showing the changes over the specified years. Notable trends include a decrease in the average cost per drug for most categories, with some exceptions such as MAOIs and typical antipsychotics.
Percentages may not add to 100% because of rounding and/or drugs that were not classified into subclasses. BNF, British National Formulary; ADHD, attention-deficit hyperactivity disorder.
Figure 1 depicts the changes in annual prescription volumes and annual prescription costs of commonly prescribed drug classes from 2013 to 2023. Even though all prescriptions increased, costs declined over time. Antidepressants were the most dispensed and costliest drug class. Notably, antidepressant prescription costs spiked shortly after the COVID-19 pandemic began. In 2020/21, antidepressant costs increased by 55.2% from the previous year, reaching £520.5 million (after adjusting for inflation).
Development of annual prescriptions and total costs of major classes and all psychotropic drugs from 2013/14 to 2022/23.

Prescription trends
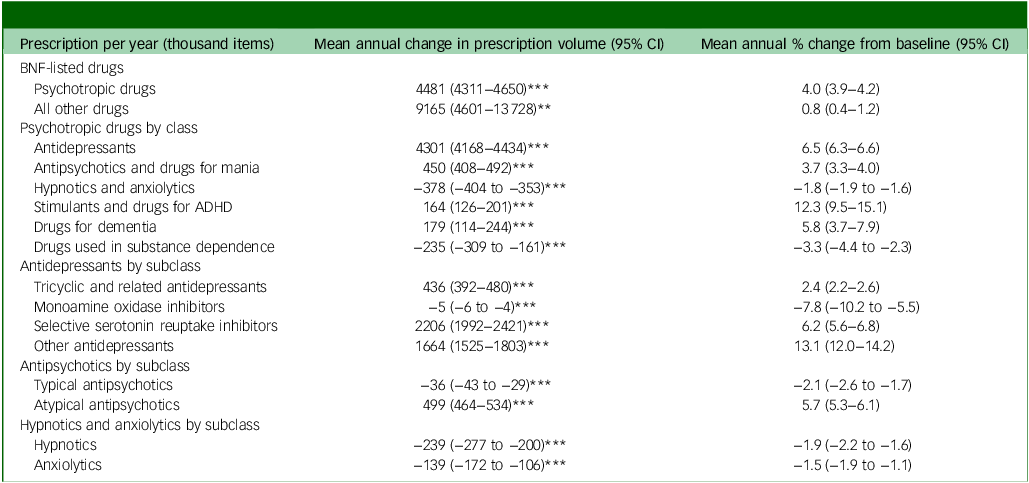
The psychotropic drug prescriptions in the UK increased by over 4 million annually between 2013 and 2023, corresponding to a 4% growth (95% CI 3.9–4.2) per year, which was much higher than other BNF-listed drugs in the same period (0.8%, 95% CI 0.4 –1.2). The prescription trends by some drug classes and subclasses deviated from the overall increase observed for psychotropic drugs above (Table 2). We observed statistically significant prescription increases in four of the six drug classes, including antidepressants, antipsychotics, stimulants and anti-dementia drugs. Stimulants had the largest prescription increase of 12.3% (95% CI 9.5–15.1) per year, followed by antidepressants, anti-dementia drugs and antipsychotics, with 6.5% (95% CI 6.3–6.6), 5.8% (95% CI 3.7–7.9) and 3.7% (95% CI 3.3–4.0), respectively. In contrast, prescriptions of hypnotics and anxiolytics and of drugs used in substance dependence decreased significantly by 1.8% (95% CI 1.6–1.9) and 3.3% (95% CI 2.3–4.4) per year, respectively. Furthermore, confirming the descriptive findings, we found discrepancies among four subclasses of antidepressants. Other antidepressants saw the highest annual prescription growth (13.1%, 95% CI 12.0–14.2), followed by SSRIs (6.2%, 95% CI 5.6–6.8) and TCAs (2.4%, 95% CI 2.2–2.6). Despite overall growth in antidepressant prescriptions, MAOI prescriptions declined significantly by 7.8% (95% CI 5.5–10.2) per year. Although atypical antipsychotic prescriptions grew by 5.7% (95% CI 5.3–6.1) annually, typical antipsychotics declined by 2.1% (95% CI 1.7–2.6) per year.
Prescription trends of psychotropic drugs from 2013/14 to 2022/23

Table 2 Long description
The table presents data on the prescription trends of psychotropic drugs in the UK from 2013 to 2023. It includes three main columns: Prescription per year (thousand items), Mean annual change in prescription volume (95% CI), and Mean annual % change from baseline (95% CI). The table is divided into several rows, each representing different categories and subclasses of psychotropic drugs. Row 1: BNF-listed drugs, Psychotropic drugs, 4481 (4311-4650), 4.0 (3.9-4.2). Row 2: BNF-listed drugs, All other drugs, 9165 (4601-13728), 0.8 (0.4-1.2). Row 3: Psychotropic drugs by class, Antidepressants, 4301 (4168-4434), 6.5 (6.3-6.6). Row 4: Psychotropic drugs by class, Antipsychotics, 450 (408-492), 3.7 (3.3-4.0). Row 5: Psychotropic drugs by class, Hypnotics and anxiolytics, -378 (-404 to -353), -1.8 (-1.9 to -1.6). Row 6: Psychotropic drugs by class, Stimulants and drugs for ADHD, 164 (126-201), 12.3 (9.5-15.1). Row 7: Psychotropic drugs by class, Drugs for dementia, 179 (114-244), 5.8 (3.7-7.9). Row 8: Psychotropic drugs by class, Drugs used in substance dependence, -235 (-309 to -161), -3.3 (-4.4 to -2.3). Row 9: Antidepressants by subclass, Tricyclic and related antidepressants, 436 (392-480), 2.4 (2.2-2.6). Row 10: Antidepressants by subclass, Monoamine oxidase inhibitors, -5 (-6 to -4), -7.8 (-10.2 to -5.5). Row 11: Antidepressants by subclass, Selective serotonin reuptake inhibitors, 2206 (1992-2421), 6.2 (5.6-6.8). Row 12: Antidepressants by subclass, Other antidepressants, 1664 (1525-1803), 13.1 (12.0-14.2). Row 13: Antipsychotics by subclass, Typical antipsychotics, -36 (-43 to -29), -2.1 (-2.6 to -1.7). Row 14: Antipsychotics by subclass, Atypical antipsychotics, 499 (464-534), 5.7 (5.3-6.1).
BNF, British National Formulary; ADHD, attention-deficit hyperactivity disorder.
**p < 0.01, ***p < 0.001.
Changes in prescriptions during the pandemic
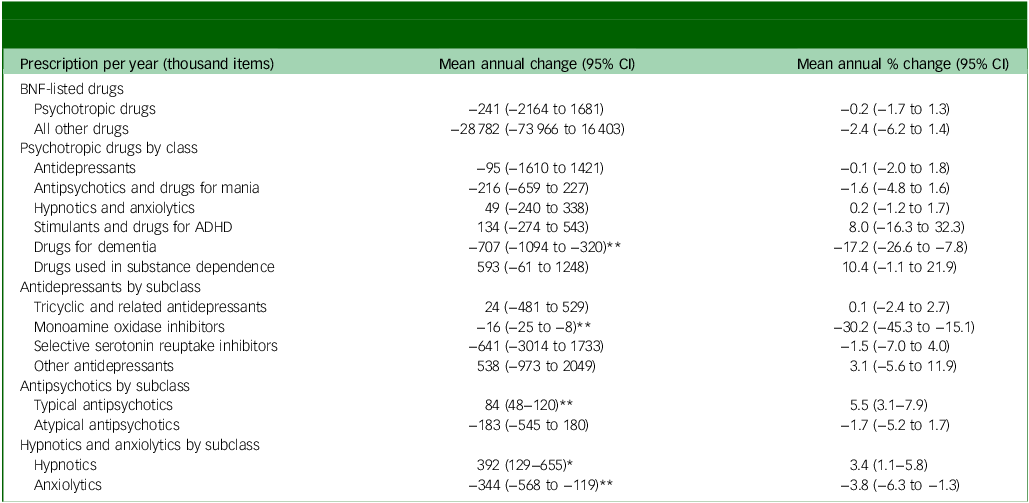
After adjustment for the underlying upward trend in prescription volume between 2013 and 2023, there were an estimated 240 000 fewer psychotropic prescriptions annually during the pandemic year than expected. However, this reduction did not reach statistical significance.
Similarly, prescriptions for all non-psychotropic drugs listed in the BNF showed a non-significant decline following the onset of the COVID-19 pandemic after accounting for the underlying upward trend. Changes in prescription volumes during the pandemic years varied across psychotropic drug classes and subclasses. Anti-dementia drugs were the only class to show a significant reduction, with annual prescription volume 17.2% (95% CI 7.8–26.6) lower than expected based on the underlying upward trend. Relative to the underlying prescription trends, prescriptions for MAOIs and anxiolytics declined further during the COVID-19 pandemic years. In contrast, despite their underlying downward trends, prescriptions for typical antipsychotics and hypnotics were higher than expected during the pandemic. Estimated changes in prescription volumes during the pandemic, after adjustment for underlying temporal trends, are presented for all drug classes and subclasses in Table 3.
Changes in psychotropic prescription volume in the pandemic years (2020/21 to 2022/23) relative to the underlying prescription trends (2013–2023)

Table 3 Long description
A table comparing changes in psychotropic prescription volumes during the pandemic years (2020/21 to 2022/23) relative to underlying trends (2013–2023). The table has 12 rows and 3 columns. Column headers are ‘Prescription per year (thousand items)’, ‘Mean annual change (95% CI)’, and ‘Mean annual % change (95% CI)’. Row labels include categories like ‘BNF-listed drugs’, ‘Psychotropic drugs by class’, ‘Antidepressants’, ‘Antipsychotics’, ‘Hypnotics and anxiolytics’, and their subclasses. Each row provides specific data on the mean annual change and mean annual percentage change for different drug categories. Notable trends include a significant reduction in anti-dementia drugs and variations in prescription volumes across different psychotropic drug classes and subclasses.
BNF, British National Formulary; ADHD, attention-deficit hyperactivity disorder.
*p < 0.05, **p < 0.01.
Monthly psychotropic drug prescription numbers in Northern Ireland (n = 120) aligned with the trends identified in the UK primary analysis on annual data (Supplementary Table 4). This sensitivity analysis confirmed increasing prescriptions for all psychotropic drugs and four drug classes: antidepressants, antipsychotics, stimulants and anti-dementia drugs.
Discussion
To our knowledge, this is one of the few comprehensive studies Reference Ilyas and Moncrieff18,Reference Stedman, Davies, Levy, Ingram, Taylor and Heald34 that uses high-quality national register data to examine prescriptions and drug costs for a wide range of common mental disorders. Our study revealed a 4% increase in annual prescriptions for all psychotropic drugs between 2013 and 2023 in the UK. We detected no significant prescription changes after the onset of the pandemic, except for anti-dementia drugs. In contrast to the rising prescription trend, we found a significant decline both in the total prescription costs of all psychotropic drugs and in the average cost per psychotropic drug.
Prescription trends of psychotropic drugs
First, the overall increase in psychotropic drug prescriptions over the study period aligns with global trends. Reference Brauer, Alfageh, Blais, Chan, Chui and Hayes5,Reference Huang, Yang, Wei, Yan, Lee and Leung11,Reference Ilyas and Moncrieff18,Reference Iaru, Bucsa, Farcas, Pop, Cristina and Armean31 Notably, a study of 65 countries that used pharmaceutical sales data reported an overall increase in the consumption of psychotropic drugs from 2008 to 2019. Reference Brauer, Alfageh, Blais, Chan, Chui and Hayes5 The psychotropic prescription increase observed in our study is likely to be the result of multiple interacting factors. On the one hand, it possibly results from efforts geared to improve the availability of psychotropic drugs 35 and a more positive attitude toward seeking professional help and receiving medication. Reference Angermeyer, van der Auwera, Carta and Schomerus36 On the other hand, this increase may indicate the increased population living with mental disorders. 2 Consistent with this interpretation, the Adult Psychiatric Morbidity Surveys reported that the prevalence of common mental health conditions among adults aged 16–64 years in England increased from 18.9% in 2014 to 22.6% in 2023/24. Reference Morris, Hill, Brugha, Tromans, Morgan and Appleby37 Nevertheless, our ecological analyses cannot determine the relative contribution of these factors to the observed prescription trends.
Our observation of rising antidepressant and antipsychotic prescriptions, but no increase in hypnotics, aligns with the international study by Brauer et al. Reference Brauer, Alfageh, Blais, Chan, Chui and Hayes5 Moreover, our study investigated variations in prescription trends of different subclasses within the same drug class. Among antidepressants, TCAs, SSRIs and other antidepressants were more frequently prescribed and dispensed over time, but MAOIs were not. Among antipsychotic drugs, we found a shift toward atypical antipsychotics, which represented more than 83% of antipsychotic prescriptions in 2013/14, and further increased to about 91% in 2022/23. The shift in prescribing practices toward the newer generations of antidepressants and antipsychotics is in line with prior literature, particularly from high-income countries. Reference Brauer, Alfageh, Blais, Chan, Chui and Hayes5,Reference Hálfdánarson, Zoëga, Aagaard, Bernardo, Brandt and Fusté12,Reference Gualano, Bert, Mannocci, La Torre, Zeppegno and Siliquini13,Reference Iaru, Bucsa, Farcas, Pop, Cristina and Armean31 This shift is possibly because of concerns about higher risks of serious side-effects from the former generation of drugs, such as extrapyramidal symptoms caused by typical antipsychotics. Reference Tandon and Jibson30
Costs of psychotropic drugs
Second, we detected a substantial decline over time both in the annual prescription costs and in the average cost per drug. Existing literature has provided contradictory evidence on this development. Although some studies identified increasing psychotropic drug costs in high-income countries, Reference Ilyas and Moncrieff18–Reference Mark, Levit, Buck, Coffey and Vandivort-Warren20 recent reports found a reduction in pharmaceutical costs for mental disorders. 16,Reference Fronstin and Roebuck17 This cost reduction may be driven by fewer prescriptions or lower drug prices, as the total cost is a product of the total number of prescriptions and the average drug cost. Fronstin and Roebuck concluded that the cost reduction was driven by lower drug prices. Reference Fronstin and Roebuck17 Once brand-name drugs fall out of their patent period, generic drugs become competitive alternatives. Lower drug prices were also identified in the study by Hodgkin et al, which used national data on pharmaceutical spending to project a slowdown in the growth of expenditures on psychotropic drugs between 2012 and 2020 compared with the 2002–2012 period in the USA. Reference Hodgkin, Thomas, O’Brien, Levit, Richardson and Mark38 Given that more mental health drug patents expired in the study period from 2013 to 2023, the lower average cost per drug in our study may be the result of patent expiration. It is worth noting that pharmaceutical shortages can lead to significant fluctuations in the price of generic drugs. The surge in both the costs and average cost per prescription of antidepressants we observed in 2020/21 implies drug shortages during the early months of the COVID-19 pandemic. Reference Rabeea, Merchant, Khan, Kow and Hasan15 Attention should be paid to price stability to ensure the accessibility of essential drugs, especially in preparedness for future public crises that potentially deteriorate mental health, and consequently burgeoning demand for psychotropic drugs.
Changes in prescriptions during the pandemic
Third, in line with prior research from both England and Sweden, Reference Frazer and Frazer39,Reference Wolfschlag, Grudet and Håkansson40 our findings revealed no changes in psychotropic prescription volume in the pandemic years, except for one drug class and some drug subclasses. Reduced access to mental health services during the COVID-19 pandemic 2,Reference Mansfield, Mathur, Tazare, Henderson, Mulick and Carreira41 could explain why our analysis did not find an increase in antidepressant prescriptions, despite the fact that the literature reported a deterioration of depressive symptoms during the pandemic. 2,Reference Pierce, Hope, Ford, Hatch, Hotopf and John21 National lockdowns and social restriction measures were likely to hinder one’s capacity to utilise healthcare services, including mental healthcare services. 2,Reference Mansfield, Mathur, Tazare, Henderson, Mulick and Carreira41 Looking at the specific drug subclasses, it is surprising to see the increase in typical antipsychotic prescriptions relative to what would be expected from the overall prescription trend. However, causes of this change are yet to be determined. In line with findings by Frazer and Frazer, Reference Frazer and Frazer39 our study found that anti-dementia prescriptions deviated from their upward trend in the pandemic years. On the one hand, this deviation might have been a result of to pandemic restrictions that impeded both older people and their caregivers’ mobility to seek care. Reference Barry and Hughes42 On the other hand, it may be explained through reduced dementia diagnoses, 43 partly because of the higher mortality rate among the older population during the pandemic.
Implications for policy and practice
Our observed increase in psychotropic prescription volume alongside declining average costs has important implications for public mental health policy and practice. Reduced costs, likely driven by greater use of generic medicines and improved procurement, may enhance affordability and expand access to pharmacological treatment for mental health conditions. However, rising prescription volumes also heighten concerns regarding prescribing quality, including potential overuse, Reference McLaren, Zito, Fegert and Barnett44 prolonged use Reference Kurko, Saastamoinen, Tähkäpää, Tuulio-Henriksson, Taiminen and Tiihonen45 and psychotropic polypharmacy. Reference Mojtabai and Olfson7 These findings highlight the need for policies that couple access with appropriate use, such as strengthened prescribing guidelines, routine medication review and monitoring systems to identify inappropriate or inequitable prescribing patterns. Ongoing surveillance of psychotropic medication utilisation and expenditure is therefore essential to ensure that cost reductions support safe, effective and equitable mental healthcare rather than unintended increases in low-value or inappropriate treatment.
Detailed information on the average drug costs can be used to calculate costs of psychotropic drug utilisation and inform economic evaluations of mental health interventions. By combining the average costs with the quantity of medication use, for example, collected from the Client Service Receipt Inventory questionnaire, Reference Beecham, Knapp and Thornicroft46 researchers can estimate psychotropic drug costs and potential economic benefit associated with mental health interventions. Our findings of the average costs per drug of various drug classes enable the calculation of drug costs without the need for detailed drug names. In addition, drug costs derived from national statistics are a reliable source that is valuable not only in the UK, but also in similar contexts where this information is unavailable.
Strengths and limitations
This study analysed high-quality national data to describe 10-year trends in the prescription volume and costs of psychotropic prescriptions overall and by major drug classes and subclasses. However, several limitations should be acknowledged.
First, the data-sets did not distinguish between single-drug and multi-drug prescriptions and lacked patient-level information on clinical indications and socioeconomic characteristics (e.g. income, education or area-level deprivation). Consequently, we could not assess the prevalence of polypharmacy or socioeconomic inequalities in psychotropic prescribing. Future studies linking prescribing and patient-level data are needed to address these questions.
Second, although the prescriptions were categorised under the BNF classification based on their primary therapeutic indications, they may have been used for conditions beyond their indications. Lacking clinical information, this study could not distinguish inappropriate use from prescriptions for approved mental health conditions. This differentiation is of particular importance given various concerns of psychotropic drugs, including adverse effects, Reference Coupland, Dhiman, Morriss, Arthur, Barton and Hippisley-Cox47 withdrawal symptoms Reference Cosci and Chouinard48 and overprescribing. Reference McLaren, Zito, Fegert and Barnett44 Future research is needed to assess to what extent psychotropic drugs are prescribed for approved indications at the correct dose and for the proper duration.
Third, we might have underestimated the actual number of prescriptions, as the data do not capture prescriptions dispensed in hospitals or issued by private practitioners. Moreover, prescription items were not included if the supplier was not listed on the prescribed order, or if patients failed to present prescriptions to a dispenser.
Finally, our models only assessed the associations between prescriptions and time, but could not draw causal inferences about the pandemic impact on the deviations in annual prescription trends. Future studies using quasi-experimental designs could provide stronger evidence on the effects of the pandemic on psychotropic prescribing and access to treatment.
In conclusion, our findings of rising psychotropic prescriptions in the UK align with evidence from other high-income countries. Furthermore, we demonstrated a decline in both annual prescription costs of psychotropic drugs and the average cost per drug, which could have been due to increased use of generic medications. Newer generations of antidepressants and antipsychotics were more frequently dispensed. Prescription volumes of most classes of psychotropic drugs did not deviate from their overall prescription trends following the onset of the COVID-19 pandemic.
Supplementary material
The supplementary material is available online at https://doi.org/10.1192/bjo.2026.12141
Data availability
The data that support the findings of this study are openly available in Business Services Organisation (https://bso.hscni.net/), NHS Business Services Authority (https://www.nhsbsa.nhs.uk), Public Health Scotland (https://publichealthscotland.scot/) and Welsh Government (https://www.gov.wales/). All data generated or analysed during this study are included in the manuscript and its Supplementary Material. The analytic codes that support the findings of this study are available from the corresponding author, H.T.N., on reasonable request.
Acknowledgements
The authors would like to thank the teaching unit at the Heidelberg Institute of Global Health for the administrative support and overall guidance in preparing the unpublished Master’s thesis that served as the core part of the manuscript. This work is derived from Y.-R.T.’s unpublished Master’s thesis, which was completed under the academic supervision of H.T.N. as part of the Master’s programme at the Heidelberg Institute of Global Health, Heidelberg University Hospital, Heidelberg University. The original analysis of the Master’s thesis was extended to March 2023 for a more up-to-date analysis. Reference to the unpublished Master’s thesis was indicated in the relevant sections of the manuscript. During the preparation of this manuscript, the authors used ChatGPT (OpenAI) to improve the language and readability of the manuscript. The authors critically reviewed and edited all AI-assisted outputs and take full responsibility for the content, accuracy and integrity of the final manuscript.
Author contributions
Y.-R.T. contributed to study conceptualisation, data curation, formal analysis, interpretation of results, writing the original draft and review and revision of the manuscript. M.D.A. contributed to study conceptualisation, methodology, formal analysis, interpretation of results and critical review and editing of the manuscript. S.D.F., S.K., M.S. and U.R. contributed to study conceptualisation, formal analysis, presentation of results and critical review and editing of the manuscript. H.T.N. contributed to study conceptualisation, data curation, formal analysis, methodology, supervision and critical review and editing of the manuscript.
Funding
This work was supported by a career grant (grant number OLM-03-02-2023) awarded to H.T.N. by the Olympia Morata Program of Heidelberg University (March 2023–February 2025).
Declaration of interest
None.



 Open access


eLetters
No eLetters have been published for this article.