


Introduction
The test site Rofental in the Central Alps of Tyrol, Austria, was surveyed by the three-frequency polarimetric AIRSAR of the Jet Propulsion Laboratory (JPL) aboard the NASA DC-8 on 18 August 1989, and on 25 June 1991. The test site elevations range between 1900 m and 3700 m a.s.l. The area is partly covered by glaciers, the largest of which (Gepatschferner) extends over an area of 17 km2. The SAR data are the basis for studies on the use of multi-parameter SAR in the fields of glaciology and snow hydrology and on radargrammetric methods for complex terrain. Field activities during the SAR surveys included observations of snow dielectrical and structural properties and the deployment of corner reflectors.
On 24 August 1989, six days after the AIRSAR overflight, a Landsat Thematic Mapper (TM) image was acquired over the test site, and on 25 August a SPOT image in multispectral (XS) mode, which has a spatial resolution of 20 × 20 m2. The AIRSAR data, as well as the Landsat TM and the SPOT images, were geocoded including terrain correction based on a digital elevation model of 12.5 × 12.5 m2 grid spacing (Reference Almer, Buchroithner, Strobl and RaggamAlmer and others, 1991). Figure 1 shows part of the SPOT image over the central part of the test site. Between the SPOT and the AIRSAR overflights there was little change in the snow extent. The snowline on the glaciers was located at altitudes between 2900 and 3100 m, depending on the orientation and the slope of the surface. On the large glaciers (Gepatschferner, Hintereisferner, Langtauferer-ferner) polluted firn from previous years appeared on the surface at the altitude zone below the higher reflecting snow of the previous winter. The ice-free areas were almost completely free of snow.
Rectified SPOT multispectral (XS) image of the test site Rofental, ötztal, acquired on 25 August 1989, with the XS channel 3 displayed in red, 2 in green, 1 in blue. Size of the shown area: 13 × 10 km2. The main glaciers: GPF, Gepatschferner; HEF, Hintereisferner; KWF, Kesselwandferner; LTF, Langtaufererferner.

Rectified AIRSAR image of the test site Rofental, ötztal, acquired on 18 August 1989, in color representation: P-band (red), L-band (green), C-band (blue), HH polarizations. Radar-look direction from the top, same projection as Figure 1.

The SAR Surveys
The AIRSAR operates in polarimetric mode at the frequencies 440 MHz (P-band), 1.25 GHz (L-band) and 5.3 GHz (C-band). The SAR data have been made available by JPL in the compressed Stokes matrix format (Reference Zebker, van Zyl, Durden and NorikaneZebker and others, 1991) with range resolution of 6.66 m and azimuth pixel spacing of 12.1 m. The 1989 data were processed to four azimuth looks. After an improved SAR processor became available at JPL, the 1991 data were processed to 16 looks.
In 1989 a single swath of about 12 km width was aquired along an east-to-west flight line on 18 August at 1345 h GMT (1430 h local solar time). The flight altitude was 8200 m a.s.l. The survey took place during a warm and humid period. Rainfall, partly mixed with graupel, was observed several hours before and during the overflight at altitudes up to 3300 m; wet snow fell above this altitude.
Figure 2 shows a contrast-enhanced color composite of the AIRSAR image of the 1989 survey. After geometric rectification the data are in the same projection as Figure 1. Fore-slopes in the near range (at the top of the figure) appear blurred after geocoding, because these foreshortened areas, containing only a few pixels in range, have been stretched considerably to correspond to the map projection. Red stripes in the far range (bottom of the figure) are due to noise from radio transmitters in the P-band. Compared to other surface types, the snow-covered areas show relatively high backscattering intensities in the P-band, and low intensities in the L and C-band. For this reason the snow-covered areas appear in red. The bluish tone of the ice areas indicates increased C-band reflectivity in comparison to the snow areas.
The direction of illumination by the radar beam in Figure 2 is almost opposite to the solar illumination in Figure 1. In both cases the brightness variations due to topography cause problems for the discrimination of the various surface types. While zones in the shadow of the radar beam contain no information, in optical imagery the shadowed areas are weakly illuminated by the diffuse solar radiation.
On 25 June 1991, between 0930 and 1000hGMT, three image swaths were acquired by the AIRSAR from a flight altitude of 10 500 m a.s.l. Two of the flight lines (Nr. 270-1 and Nr. 270-2) were aligned in east-west direction, shifted by 4 km in latitude, to provide the basis for radar stereo investigations and for studies of incidence angle effects. Another swath (Nr. 90-1) was collected from a west-east flight line, resulting in an opposite look direction. Figure 3 shows swath Nr. 270-2, the northern of the two parallel swaths, over Kesselwandferner, Gepatschferner and the terminus of Hintereisferner. The look angle of the radar beam varies over the section shown in Figure 3 from 50° at the top of the figure to 65° at the bottom. Due to the slanting incidence, steep south-looking slopes are in the shadow of the radar beam. After an extended period of snowfall in the mountains, which ended on 19 June 1991, significant parts of the ice-free areas above 2800 m were covered by snow during the AIRSAR survey. The glaciers were almost completely snow-covered. Bare ice appeared only on small areas at the tongues of the large glaciers.
As in the AIRSAR image of 1989, the snow surfaces on the glaciers in Figure 3 appear in red due to the comparatively high backscattering intensities at P-band. The snow cover in the ice-free areas has a slightly greenish tone, because the ratio of L-band to P-band reflectivity is slightly higher than on the glaciers. A small area of glacier ice at the terminal part of Hintereisferner appears bluish, indicating comparatively high backscattering at C-band. This is also characteristic for the ice and snow-free surfaces, which are made up by moraines, rock and alpine grassland.
AIRSAR image of the test site Rofental, Ötztal, swath Nr. 270-2, acquired on 25 June 1991. P-, L-, C-band, HH polarizations, color coded as in Figure 2. The arrow points to the roughness test field on Kesselwandferner.

Signature Studies
Calibration of the AIRSAR data
The AIRSAR records the amplitude and relative phase of the backscattered wave at the four linear polarizations HH, VV, HV, VH. Targets with known backscattering behaviour are needed to calibrate the phase relationships, crosstalk, and imbalances of the horizontally and vertically polarized channels and to derive absolute backscattering intensities (Reference Zebker, van Zyl, Durden and NorikaneZebker and others, 1991). In 1989 we deployed ten, and in 1991, 15 trihedral corner reflectors with leg lengths between 0.7 and 1.8 m on the firn areas of Kesselwandferner and Hintereisferner. These reflectors can be seen clearly in the SAR images, due to the low background signal of the wet snow areas.
The absolute calibration is most accurate for the C-band data, because the signal-to-clutter ratio of the reflectors decreases with increasing wavelength. The C-band calibration factors of the 1991 data, derived from eight corner reflectors on Kesselwandferner, showed a standard deviation of 0.9 dB. The small reflectors were not used for calibration at L-band. The standard deviation of the L-band calibration factor of the five large reflectors was 1.2 dB. For P-band the calibration factor provided by JPL was used. For phase calibration the POLCAL software of JPL was applied (Reference Zyl, van, Burnette, Zebker, Freeman and HoltZyl and others, 1990). The factors for absolute calibration were calculated separately for each site, accounting for the effects of the local incidence angle of the radar beam and of the range variations due to topography. The accuracy of the backscattering coefficients σ ° was highest for the sites in the vicinity of the corner reflectors, where also the majority of field measurements on snow properties were carried out. The good agreement of the signatures derived from the two parallel swaths 270–1 and 270–2 confirms the usefulness of the calibration procedure.
At C- and L-band the signatures derived from the 1989 and 1991 surveys are very similar for a given target type. However, the 1989 P-band data showed high values of the HH/VV backscattering ratio for all targets (Reference RottRott, 1991). This feature, which was not in accordance with the expected behaviour and which was not observed in the 1991 data, may have been caused by external disturbances due to radio interferences or by insufficient compensation of HH/VV channel imbalances. For this reason we refrain from analyzing the 1989 P-band data.
The cross-polarized backscattering coefficients σ° of wet snow are very low. Nevertheless, at P- and L-band these values were clearly above the noise level. The 1991 C-band data showed a decrease of noise equivalent σ° from −35 dB in the center of the swath to −30 dB at the far range. For this reason we did not derive cross-polarized σ° for snow surfaces at high radar look angles.
Snowpack properties
Measurements on snow cover properties were made on the days previous to and the day of the AIRSAR overflight at altitudes between 2800 and 3050 m on Hintereisferner and between 3100 and 3300 m on Kesselwandferner. In Table 1 mean values of the density, liquid water content, and grain-size are listed. Because of adverse weather during the 1989 survey, only a few measurements of snow liquid water content could be made close to the time of the overflight. While the rainfall up to high altitudes implies rather homogeneous wetness conditions, different snow textures may have caused small differences in drainage rates and therefore liquid water contents.
Over four days previous to the overflight on 25 June 1991, the mean daily temperature at 3000 m was a few degrees above 0°C, causing melt metamorphosis of the snowpack. The snowpack was more homogeneous and showed less horizontal layering than at the time of the 1989 survey. Profiles of wetness were measured in 5 cm intervals with a dielectric wetness meter operating at 20 MHz with a flat-plate sensor (Reference DenothDenoth, 1989). The liquid water content of the top snow layers was similar during both AIRSAR surveys. The snow layers below 1 m depth, which are within the reach of P-band penetration, had lower moisture in 1991. The vertical profiles of wetness showed distinct peaks above layers with high density, in particular above internal crusts and ice lenses. At an elevation of 2900 m on Hintereisferner and of 3200 m on Kesselwandferner the ice surfaces were covered by about 2 m of snow during the 1991 survey. The corresponding snow depths in 1989 were 0.5 and 1 m.
Surface roughness measurements were carried out at about 25 sites. In 1991 a laser profiler was used, scanning the surface in steps of 0.5 mm for a base length of 1.5 m. The roughness data of 1989 were digitized from surface contours on paper sheets, which had been inserted in the snow folded over a metal sheet and sprayed with paint. The measurements of both years show similar values for the mean correlation length lr, but the standard deviation of surface roughness was higher in 1989 with a mean value of 1.8 cm versus 0.8 cm in 1991. There was a fair amount of spatial variation of the roughness properties, depending on the exposure of the snow surface to wind and sun, as well as on altitude.
Mean properlies of the top 20 cm of snow and surface roughness during the AIRSAR surveys 1989 and 1991

Snow dielectric properties for wet snow with density 500 kg m−3 and liquid water content W = 0.06 at the AIRSAR frequencies (GHz)
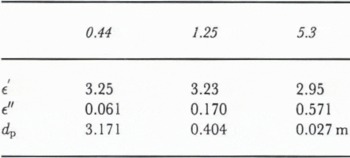
In Table 2 the dielectric constants and penetration depths at the AIRSAR frequencies are listed for a snowpack with density of 500 kg m −3 and with liquid water content W of 0.06 volume fraction. The dielectric constant ∊ for the frequency ƒ was derived according to the mixing formula of Reference MatzlerMätzler (1987):

where ƒ0 is the relaxation frequency of wet snow (10 GHz) and ∊d is the dielectric constant of dry snow. The penetration depth dp was obtained by

For the 1991 AIRSAR survey, a roughness test field of 60 × 35 m2 size was created by making ski tracks in the soft snow parallel to the flight line. Figure 4 shows a profile of surface height perpendicular to the flight line, measured by the laser profiler. The standard deviation of surface height SD(h) of the test field was 1.9 cm, which is similar to SD (h) of the undisturbed snow in 1989, but the correlation length of the test field was significantly smaller.
Profile of the surface height of the roughness test field on Kesselwandferner (exaggerated in the vertical).

Backscatter response of a snow area on Kesselwandferner as a function of transmit wave polarization at three frequencies from 1991 AIRSAR data. Incidence angle at the surface Θ = 46°, left: co-polarized, right: cross-polarized.

Polarimetric signatures
The polarization state of a plane wave with the transverse components Eh and Ev of the electrical field can be described by the Stokes vector F:

where ' represents the complex conjugation and Re and Im indicate the real and imaginary part, respectively.
Figures 5–7 show variations of the received power (normalized to the maximum power) as functions of the orientation angle ψ and ellipticity χ of the transmitted wave (Reference Zebker and van ZylZebker and Zyl, 1991). We derived the back-scattering signatures for windows ≥ 100 pixels to reduce statistical variations of backscattering intensity if the target fields were large enough. In cases of the roughness test field and the crevasse the windows were 3 × 3 and 3 × 2 pixels, respectively.
Figure 5 shows the C-, L- and P-band co- and cross-polarized signatures of a snow-covered area on Kesselwandferner, imaged under an incidence angle Θ = 46° at the surface. Typically, the highest σ° values of the wet snow areas are observed at VV polarizations (χ = 0°, ψ = 90° for transmitted and received wave) at all three frequencies if Θ is larger than about 40° (see also Table 3). The differences between HH (χ = 0°, ψ = 0° or 180°) and VV polarized σ° are less pronounced at L-band than at the other frequencies. The co- and cross-polarized C-and L-band signatures are consistent with model calculations for backscattering of slightly rough surfaces overlying a half-space of random scatterers (Reference Kuga, Whitt, McDonald, Ulaby, Ulaby and ElachiKuga and others, 1990). For the surface scattering contribution a decrease of the differences between σ°VV and σ°HH has to be expected with increasing wavelength, as observed between C- and L-band. At P-band the sub-surface contribution becomes more important.
The height of the pedestal, which represents the diffuse-scattering contribution, increases with increasing wavelength. This is due to the significant increase of penetration depth and of the sub-surface volume contributing to reflection and scattering from C- to P-band (Table 2). At P-band a larger number of internal reflecting boundaries and scattering elements, such as internal crusts, ice lenses, and ice trunks, was encountered than at the higher frequencies. The first ice layers and ice lenses below the surface were observed at depths of about 15–20 cm, which is beyond the sensing depth of C-band for wet snow. At C-band the volume scattering contribution originates from the top 2–4 cm layer of ice grains.
Polarimetric backscattering properties for characteristic targets derived from AIRSAR data of the test site Ötztal, 25 June 1991. N, system noise level too high; Θ, incidence angle at the surface; ΦHH-VV, phase difference; ƒ, fractional polarization

Co-polarized backscatter response for: (left) glacier ice on Hintereisferner (Θ = 60°), (right) a crevasse on Gepatschferner (Θ = 45°) ; from 1991 AIRSAR data.

Figure 6 shows the co-polarized signatures of a large crevasse under the radar look angle of 45° in the firn area of Gepatschferner and of an ice area at the terminus of Hintereisferner. At C- and L-band the crevasse signatures come close to the ideal behaviour of a trihedral corner reflector (Reference Zebker, van Zyl, Durden and NorikaneZebker and others, 1991). The same signature is obtained from specular reflection of facets normal to the radar beam. This is very likely the mechanism to explain the signatures of the crevasse, because the snow surface in the upper parts of the large crevasses were partly facing the radar antenna. At P-band a diffuse component due to the volume contribution is added. The extended icefall at the tongue of Gepatschferner shows a signature similar to the single crevasse, with a somewhat larger pedestal.
Co-polarized backscatter response of the roughness test field on Kesselwandferner, at the incidence angle Θ = 47° (left) and Θ = 59° (right); from 1991 AIRSAR data.

The glacier ice signatures (Θ = 60°) correspond to the behaviour of slightly-to-medium rough surfaces at all three frequencies. Because ice surfaces on glaciers include various scales of roughness, from small cryoconite holes in the mm-cm scale to undulations with wavelengths of meters and to drainage channels, the surface appears rough over a wide range of wavelengths. The ice signatures in Figure 6 are derived from AIRSAR data of the terminal part of Hintereisferner, where the ice surface is partly polluted by sand and small rocks. Analysis of the 1989 AIRSAR data and of C- and X-band SAR data acquired in July 1990 (Reference RottRott, 1991) shows some variations of the signatures across the ice areas, which may be explained by variations in surface roughness. At C-band the differences between HH and VV polarized σ° of the ice surfaces are in general smaller than for the snow surfaces, and the unpolarized component is higher.
The co-polarized signatures of the roughness test field are plotted in Figure 7. The site was viewed under the incidence angle Θ = 47° (swath Nr. 270-1) and under Θ = 59° (swath Nr. 270-2). At C- and L-band the unpolarized components are low, indicating the dominating effects of the reflecting facets. In contrast to the undisturbed snow, at C-band the HH polarized σ° clearly dominates. In this case the incident wave is polarized parallel to the ski tracks. For swath 270–1 σ° (HH) at C-band is + 1 dB, which is 24 dB above the undisturbed snow, at VV polarizations the difference is 16 dB (Table 3). The L-band shows the maximum (−1.9dB) at VV polarizations (swath 270–1), which is 19dB above the undisturbed background. Even at P-band the parallel polarized σ° values of the roughness test field are increased by 2–4 dB in comparison to the background. At both L- and P-band the VV-HH differences are increasing with increasing incidence angle.
In Table 3, absolute σ° at VV polarizations, co-polarized and cross-polarized σ° ratios, phase differences between HH and VV polarized signals and the fractional polarizations ƒ are listed, ƒ is defined as

where the maximum (Pmax) and the minimum (Pmin) return power are calculated by synthetically varying the polarization state (Reference Zebker, van Zyl and HeldZebker and others, 1987). With decreasing ƒ the unpolarized component of the back-scattered power increases.
In case of the snow signatures in Table 3 the numbers represent mean values of several sites on Kesselwandferner with the same locations for swaths Nr. 270-1 and Nr. 270-2. The backscattering behaviour at both incidence angles (46° and 59°) is similar, with slightly reduced σ° at 59°. In 1989, when the snow surface was slightly rougher, σ° (VV) was −18 dB at C-band and −21 dB at L-band over the same locations of Kesselwandferner with Θ = 50°.
According to Table 3 the maximum differences in σ° between the various target types such as snow, glacier ice, and moraines are observed at C-band. However, as a result of variations of σ° with incidence angle, classification procedures for mountain areas cannot be based on σ° of a single channel without additional information. A laborious way to overcome these problems, at least partly, is the matching of real and simulated radar images (Reference RottRott, 1990). More desirable are characteristic radiometric or polarimetrie quantities with little dependence on the incidence angle. At C-band the cross polarized to parallel polarized power ratio and the fractional polarization hold some potential for separating snow areas from other targets. For discriminating two specific targets the polarization filter offers good possibilites (Shi and others, 1991). If dual- or multi-frequency SAR measurements are available, the frequency dependence of back-scattering appears to be most promising for target discrimination.
Conclusion
Our studies on frequency dependence and polarization behaviour of backscattering, based on airborne SAR surveys over temperate glaciers during summer, indicate characteristic frequency dependence and polarization behaviour of backscattering for the main target types. Surface roughness, volume inhomogeneities, and liquid water content are the main parameters influencing the backscattering of melting snow. Because of the increasing penetration depth, the backscattering contribution of the volume increases clearly from C- to P-band for wet snow on glaciers. Internal boundaries of snow and ice layers, ice lenses and ice trunks are effective reflectors and scatterers also at large wavelengths. Improved theoretical models have been developed for volume scattering, including dense medium radiative transfer for spherical scatterers (Reference Wen, Tsang, Winebrenner and IshimaruWen and others, 1990) and first- and second-order solutions of the vector radiative-transfer theory for random, non-spherical scatterers (Reference Tsang and DingTsang and Ding, 1991). The application of these models for backscattering from snow areas on glaciers requires the proper characterization of the scattering medium, which is a heterogeneous mixture of the components air-ice-water and includes scattering elements ranging from sizes of about 1 mm to several centimeters.
As the roughness experiment indicates, surface roughness plays a role for backscattering of wet snow even at C-and L-band. Over P- to C-band frequencies bare glacier ice shows polarimetric signatures characteristic of slightly rough to medium rough surfaces. This can be explained by the various roughness scales of glacier ice. Compared to snow, the backscattering intensities of glacier ice are significantly increased at C- and X-band, as known also from the C- and X-band airborne SAR survey of the test site in July 1990 (Reference RottRott, 1991; Reference Rott and DavisRott and Davis, 1991).
Polarimetric quantities, such as the HH/VV-polarized power ratios and the ratios of unpolarized to polarized scattering components, show some variations with the incidence angle, which are less pronounced than for absolute backscattering intensities. This variability complicates the application of automatic classification procedures and the extraction of physical properties of the targets. Other difficulties for thematic mapping arise from the spatial variations of target properties due to meteorological and topographic influences. Compared to single frequency SAR, multifrequency backscattering data offer significant improvements for separating snow, glacier ice, and ice-free surfaces. In order to utilize the large potential of SAR for snow and glacier applications, it is desirable to develop generally applicable procedures for the inversion of multi-parameter SAR measurements in regard to snow and ice properties, based on SAR data from different regions and seasons.
Acknowledgements
This work has been supported by the Austrian Academy of Sciences, National Space Research Program and by NASA, Grant LP-24-90. We are grateful to NASA and JPL for conducting the AIRSAR surveys in 1989 and 1991. We thank Mr Dieter Strobl of Joanneum Research, Graz, for geocoding the AIRSAR and SPOT data.



