1. Introduction
Controlling cell growth is a key aspect of the technology required to properly regulate bioreactors for food and medicine. A quantitative understanding of cell growth is essential to describe such ecosystems, as well as some of the associated environmental problems. Cell growth is regulated by intracellular metabolism, which is strongly affected by nutrient uptake by cells. Therefore, to predict cell growth the nutrient uptake of cells must be well described.
The nutrient uptake of a solitary swimming micro-organism was investigated by Magar, Goto & Pedley (Reference Magar, Goto and Pedley2003) using a theoretical approach. They simplified the original model of Lighthill (Reference Lighthill1952) and Blake (Reference Blake1971), and assumed a swimming micro-organism as a steady spherical squirmer. They showed that the Sherwood number (
 $Sh$
), indicating the ratio of the total rate of mass transfer to the rate of diffusive mass transfer, increases with the square root of the Péclet number (
 $Pe$
), indicating the ratio of advection to diffusion, in the high-
 $Pe$
regime, as opposed to with the cube root for a rigid sphere. Michelin & Lauga (Reference Michelin and Lauga2011) investigated the optimal feeding stroke of a steady squirmer. They showed that the optimal feeding stroke is independent of
 $Pe$
, although the rate of feeding depends strongly on
 $Pe$
. Doostmohammadi, Stocker & Ardekani (Reference Doostmohammadi, Stocker and Ardekani2012) investigated the effects of density stratification on the nutrient uptake of a steady squirmer. They concluded that the additional investment required for motility in a stratified fluid provides diminishing returns in terms of nutrient uptake. Furthermore, Magar & Pedley (Reference Magar and Pedley2005) extended their steady squirmer model to consider an unsteady squirmer. They showed that the unsteady squirming velocity significantly affects nutrient uptake. Michelin & Lauga (Reference Michelin and Lauga2013) also investigated the optimal feeding stroke of an unsteady squirmer. Short et al. (Reference Short, Solari, Ganguly, Powers, Kessler and Goldstein2006) used Volvox to investigate the effects of flagella-driven flow on nutrient uptake, and discussed the evolutionary transition to multicellularity and germ–soma differentiation in volvocalean green algae. These findings form the basis of nutrient uptake by a swimming micro-organism in the dilute limit (Guasto, Rusconi & Stocker Reference Guasto, Rusconi and Stocker2012).
In the non-dilute regime, nutrient uptake by a swimming micro-organism has received little attention, except for Lambert et al. (Reference Lambert, Picano, Breugem and Brandt2013). However, mixing of chemicals and tracers in non-dilute suspensions of cells has been reported by many researchers (Pedley & Kessler Reference Pedley and Kessler1992; Hill & Pedley Reference Hill and Pedley2005; Ishikawa Reference Ishikawa2009; Ishikawa, Locsei & Pedley Reference Ishikawa, Locsei and Pedley2010; Koch & Subramanian Reference Koch and Subramanian2011; Kurtuldu et al. Reference Kurtuldu, Guasto, Johnson and Gollub2011; Stocker Reference Stocker2012; Molina & Yamamoto Reference Molina and Yamamoto2014; Wagner, Young & Lauga Reference Wagner, Young and Lauga2014; Goldstein Reference Goldstein2015). In particular, enhanced diffusion of tracers in a dense bacterial bath has been extensively investigated. Wu & Libchaber (Reference Wu and Libchaber2000) first showed enhanced diffusion of tracer particles in a suspension of Escherichia coli. Similar phenomena were also reported for a suspension of Bacillus subtilis (Sokolov et al. Reference Sokolov, Aranson, Kessler and Goldstein2007, Reference Sokolov, Goldstein, Feldchtein and Aranson2009). The effect of turbulent-like flow structures generated by bacteria on the fluid mixing was investigated in detail in suspensions of E. coli (Ishikawa et al. Reference Ishikawa, Yoshida, Ueno, Wiedeman, Imai and Yamaguchi2011; Jepson et al. Reference Jepson, Martinez, Schwarz-Linek, Morozov and Poon2013) and B. subtilis (Dunkel et al. Reference Dunkel2013). At low bacterial concentrations, Mino et al. (Reference Mino, Dunstan, Rousselet, Clément and Soto2013) investigated tracer diffusion both theoretically and experimentally. Enhanced diffusion was also numerically investigated in the concentrated regime. Some research groups employed continuum models (Saintillan & Shelley Reference Saintillan and Shelley2008a ,Reference Saintillan and Shelley b ), while others employed discrete models (Hernandez-Ortiz, Stoltz & Graham Reference Hernandez-Ortiz, Stoltz and Graham2005; Saintillan & Shelley Reference Saintillan and Shelley2007, Reference Saintillan and Shelley2011; Underhill, Hernandez-Ortiz & Graham Reference Underhill, Hernandez-Ortiz and Graham2008; Kasyap, Koch & Wu Reference Kasyap, Koch and Wu2014). Despite these extensive studies of mass transport in non-dilute suspensions, there remains much that is unknown about nutrient uptake by cells.
Recently, Lambert et al. (Reference Lambert, Picano, Breugem and Brandt2013) investigated nutrient uptake by steady squirmers in a dense suspension in a thin film. At the cell surface, they imposed a nutrient flux proportional to the local concentration with a coefficient that indicated the ratio of the uptake rate to the viscous time scale. Their results showed that the mean nutrient uptake decreased as the swimming speed increased, when the uptake rate was sufficiently small. This finding was predicted by Magar et al. (Reference Magar, Goto and Pedley2003) imposing a boundary condition for nutrient uptake that takes into account both the absorption of nutrients and the nutrient diffusion inside of the cell. Lambert et al. (Reference Lambert, Picano, Breugem and Brandt2013) also found that, as the volume fraction of squirmers increased, the squirmers consumed less nutrients and required more power for the same swimming motion. These findings are important in understanding nutrient uptake in a confined environment. The results of Lambert et al. (Reference Lambert, Picano, Breugem and Brandt2013), however, were restricted to a film flow, and the vertical motion of squirmers was limited. To construct a more general understanding of nutrient uptake in the non-dilute regime, a three-dimensional (3D) suspension must be investigated.
Here we numerically investigate nutrient uptake in an infinite 3D suspension of steady squirmers. The concentration field is expressed discretely by calculating the motion of individual nutrient particles that advect with the background flow and diffuse due to Brownian motion. The velocity field in the suspension is calculated using the boundary element method (BEM). A constant concentration is assumed at the cell surface, although another boundary condition with limited mass flux at the cell surface is also examined in appendix B. The motion of squirmers is calculated using the Stokesian dynamics method. Details of the numerical methods are described in § 2. In § 3, we compare our numerical results with those of Magar et al. (Reference Magar, Goto and Pedley2003) in the dilute limit; we then discuss the effects of the volume fraction of squirmers on the nutrient uptake and swimming energy of individual cells. Section 4 concludes the paper.
2. Basic equations and numerical methods
2.1. Motion of individual squirmers
The model used here to describe micro-organisms is the same as that described by Magar et al. (Reference Magar, Goto and Pedley2003); i.e. a spherical steady squirmer. The squirmer has radius
 $a$
, and is assumed to be neutrally buoyant and non-Brownian. The surface of the sphere moves purely tangentially with respect to the cell body, and this tangential motion is axisymmetric and time independent. The tangential surface velocity is given by
 $$\begin{eqnarray}\boldsymbol{u}_{s}=\mathop{\sum }_{n=1}^{2}\frac{2}{n(n+1)}B_{n}\left(\frac{\boldsymbol{e}\boldsymbol{\cdot }\boldsymbol{r}}{r}\frac{\boldsymbol{r}}{r}-\boldsymbol{e}\right)P_{n}^{\prime }(\boldsymbol{e}\boldsymbol{\cdot }\boldsymbol{r}/r),\end{eqnarray}$$
where
 $P_{n}$
is the
 $n$
th Legendre polynomial,
 $\boldsymbol{e}$
is the unit orientation vector of the squirmer,
 $\boldsymbol{r}$
is the position vector and
 $r=|\boldsymbol{r}|$
. A solitary squirmer swims at speed
 $U_{sol}=2B_{1}/3$
. We follow Ishikawa, Locsei & Pedley (Reference Ishikawa, Locsei and Pedley2008) and omit squirming modes higher than the second (i.e.
 $B_{n}=0$
when
 $n\geqslant 3$
). We denote the ratio of second-mode squirming to first mode as
 ${\it\beta}$
, so that we have
 ${\it\beta}=B_{2}/B_{1}$
. A squirmer with
 ${\it\beta}>0$
is a puller, whereas a squirmer with
 ${\it\beta}<0$
is a pusher.
The Stokesian dynamics for computing the hydrodynamic interactions among an infinite suspension of squirmers was developed by Ishikawa et al. (Reference Ishikawa, Locsei and Pedley2008). We use the same method to calculate the motion of individual squirmers. At negligible particle Reynolds number, motions of
 $M$
squirmers periodically replicated in three-dimensional space can be given as (Ishikawa et al.
Reference Ishikawa, Locsei and Pedley2008)
 $$\begin{eqnarray}\displaystyle \left(\begin{array}{@{}c@{}}\boldsymbol{F}\\ \boldsymbol{ L}\\ \unicode[STIX]{x1D64E}\end{array}\right) & = & \displaystyle [\unicode[STIX]{x1D64D}^{\,far}-\unicode[STIX]{x1D64D}_{2B}^{\,far}+\unicode[STIX]{x1D64D}_{2B}^{\,near}]\left(\begin{array}{@{}c@{}}\boldsymbol{U}-\langle \boldsymbol{u}\rangle \\ {\it\bf\Omega}-\langle {\bf\omega}\rangle \\ \unicode[STIX]{x1D7EC}\end{array}\right)\nonumber\\ \displaystyle & & \displaystyle +\,[\unicode[STIX]{x1D64D}^{\,far}-\unicode[STIX]{x1D64D}_{2B}^{\,far}]\left(\begin{array}{@{}c@{}}-\frac{2}{3}B_{1}\boldsymbol{e}+\boldsymbol{Q}_{sq}\\ \pmb{{\it 0}}\\ -\frac{1}{5}B_{2}\left(3\boldsymbol{e}\boldsymbol{e}-\unicode[STIX]{x1D644}\right)\end{array}\right)+\left(\begin{array}{@{}c@{}}\boldsymbol{F}_{sq}^{\,near}\\ \boldsymbol{ L}_{sq}^{near}\\ \unicode[STIX]{x1D64E}_{sq}^{\,near}\end{array}\right),\end{eqnarray}$$
where
 $\boldsymbol{F}$
,
 $\boldsymbol{L}$
and
 $\unicode[STIX]{x1D64E}$
are the force, torque and stresslet that a squirmer exerts on the fluid, respectively;
 $\boldsymbol{U}$
and
 ${\it\bf\Omega}$
are the translational and rotational velocities of the squirmer;
 $\langle \boldsymbol{u}\rangle$
and
 $\langle {\bf\omega}\rangle$
are those of the bulk suspension;
 $\unicode[STIX]{x1D644}$
is the unit tensor;
 $\boldsymbol{Q}_{sq}$
is the far-field contribution of the irreducible quadrupole due to the squirming motion; and
 $\unicode[STIX]{x1D64D}^{\,far}$
is the far-field contribution to the grand resistance matrix, which is the inverse of the far-field contribution to the grand mobility matrix, i.e.
 $\unicode[STIX]{x1D64D}^{\,far}=\{\unicode[STIX]{x1D648}^{\,far}\}^{-1}$
.
 $\unicode[STIX]{x1D648}^{\,far}$
is derived from the Faxén laws for the force, torque and stresslet of a squirmer, in which the disturbed flow field is expressed in terms of the multipole expansion of other squirmers. The infinite extent of the suspension is taken into account using Ewald summation (Beenakker Reference Beenakker1986). To include the near-field interactions, we follow the method of Durlofsky, Brady & Bossis (Reference Durlofsky, Brady and Bossis1987), and add near-field multipoles in a pairwise-additive fashion, so that
 $\unicode[STIX]{x1D64D}_{2B}^{\,far}$
is the far-field two-body resistance matrix and
 $\unicode[STIX]{x1D64D}_{2B}^{\,near}$
is the near-field two-body resistance matrix (see, for example, Kim & Karrila Reference Kim and Karrila1992). The terms
 $\boldsymbol{F}_{sq}^{\,near},\boldsymbol{L}_{sq}^{near}$
and
 $\unicode[STIX]{x1D64E}_{sq}^{\,near}$
are the force, torque and stresslet generated by squirmer–squirmer interactions in the near fluid, respectively. We have previously compiled a database of pairwise interactions of squirmers (Ishikawa, Simmonds & Pedley Reference Ishikawa, Simmonds and Pedley2006), and we use this database in constructing these multipoles. The first matrix multiplication on the right-hand side of (2.2) indicates the contribution from two inert spheres with translational and rotational velocities, which is equivalent to the expression derived by Brady et al. (Reference Brady, Phillips, Lester and Bossis1988). The second matrix multiplication describes the far-field contribution from the squirming motion, and the final term describes the near-field contribution from the squirming motion.
A non-hydrodynamic short-range repulsive force between squirmers,
 $\boldsymbol{F}_{rep}$
, is added to the system to avoid excessively small time steps and overcome the problem of overlapping squirmers. We follow Brady & Bossis (Reference Brady and Bossis1985) and Ishikawa et al. (Reference Ishikawa, Locsei and Pedley2008) and use the following function:
 $$\begin{eqnarray}\boldsymbol{F}_{rep}={\it\alpha}_{1}\frac{{\it\alpha}_{2}\exp (-{\it\alpha}_{2}{\it\varepsilon})}{1-\exp (-{\it\alpha}_{2}{\it\varepsilon})}\frac{\boldsymbol{r}}{r},\end{eqnarray}$$
where
 ${\it\alpha}_{1}$
and
 ${\it\alpha}_{2}$
are dimensional coefficients and
 ${\it\varepsilon}$
is the minimum separation between the surfaces of squirmers normalized by the radius. The coefficients used here are
 ${\it\alpha}_{1}=0.1$
and
 ${\it\alpha}_{2}=10^{3}$
. The minimum separation obtained with these parameters is approximately
 $10^{-3}a$
.
2.2. Motion of nutrient particles
The concentration field of nutrients is expressed discretely by using a large number of nutrient particles. We calculate the motion of individual nutrient particles that advect with the flow generated by squirmers and diffuse due to the Brownian motion. The position of nutrient particle
 $i$
at time
 $t+{\rm\Delta}t$
is given by
 $$\begin{eqnarray}\boldsymbol{r}_{i}(t+{\rm\Delta}t)=\boldsymbol{r}_{i}(t)+\int _{t}^{t+{\rm\Delta}t}\boldsymbol{u}_{i}(t^{\prime })\,\text{d}t^{\prime }+\boldsymbol{r}_{i}^{B}({\rm\Delta}t),\end{eqnarray}$$
where
 $\boldsymbol{u}_{i}$
is the velocity at
 $\boldsymbol{r}_{i}$
that is generated by squirmers and
 $\boldsymbol{r}_{i}^{B}$
is the displacement due to Brownian motion. The Brownian displacement
 $\boldsymbol{r}_{i}^{B}$
has a zero mean, with correlations governed by the fluctuation–dissipation theorem (Ermak & McCammon Reference Ermak and McCammon1978); i.e.
 $$\begin{eqnarray}\langle \boldsymbol{r}^{B}({\rm\Delta}t)\boldsymbol{r}^{B}({\rm\Delta}t)\rangle =2{\rm\Delta}t\unicode[STIX]{x1D63F},\end{eqnarray}$$
where
 $\unicode[STIX]{x1D63F}$
is the diffusion tensor of a nutrient particle and
 $\langle ~\rangle$
indicates the ensemble average. We assume isotropic diffusion of nutrient particles, so that
 $\unicode[STIX]{x1D63F}$
can be simplified to
 $\unicode[STIX]{x1D63F}=D\unicode[STIX]{x1D644}$
.
In Ishikawa et al. (Reference Ishikawa, Locsei and Pedley2010), we developed an accurate numerical method to calculate
 $\boldsymbol{u}_{i}$
in a semidilute suspension of squirmers. In a concentrated suspension of squirmers, however, the methodology may not be sufficiently accurate, especially when many squirmers exist near a nutrient particle. This is because moments larger than the stresslet are not explicitly calculated in the Stokesian dynamics, but they are important in the velocity field near the squirmers. We therefore use the BEM to calculate
 $\boldsymbol{u}_{i}$
.
When
 $M$
squirmers are periodically replicated in a 3D space, the governing equation of the flow field
 $\boldsymbol{u}$
external to the squirmers can be given in integral form as (Pozrikidis Reference Pozrikidis1992)
 $$\begin{eqnarray}\boldsymbol{u}(\boldsymbol{x})=-\frac{1}{8{\rm\pi}{\it\mu}}\mathop{\sum }_{m=1}^{M}\int _{A_{m}}\unicode[STIX]{x1D645}(\boldsymbol{x}-\boldsymbol{y})\boldsymbol{q}(\boldsymbol{y})\,\text{d}A_{y},\end{eqnarray}$$
where
 $\boldsymbol{q}$
is the single-layer potential and
 $A_{m}$
is the surface of squirmer
 $m$
.
 $\unicode[STIX]{x1D645}$
is the Green function for a triply periodic lattice (Beenakker Reference Beenakker1986). On the squirmers’ surface, the following boundary condition has to be satisfied:
 $$\begin{eqnarray}\boldsymbol{u}(\boldsymbol{x})=\boldsymbol{U}_{m}+{\it\bf\Omega}_{m}\wedge \left(\boldsymbol{x}-\boldsymbol{x}_{m}\right)+\boldsymbol{u}_{s,m},\quad \boldsymbol{x}\in A_{m},\end{eqnarray}$$
where
 $\boldsymbol{U}_{m}$
and
 ${\it\bf\Omega}_{m}$
are the translational and rotational velocities of squirmer
 $m$
,
 $\boldsymbol{x}_{m}$
is the centre of squirmer
 $m$
and
 $\boldsymbol{u}_{s,m}$
is the squirming velocity of squirmer
 $m$
.
In Ishikawa et al. (Reference Ishikawa, Simmonds and Pedley2006), we solved (2.6) and (2.7) combined with the force and torque conditions of squirmers using the BEM. The difference between this work and Ishikawa et al. (Reference Ishikawa, Simmonds and Pedley2006) is whether
 $\boldsymbol{U}_{m}$
and
 ${\it\bf\Omega}_{m}$
are known or unknown. Here
 $\boldsymbol{U}_{m}$
and
 ${\it\bf\Omega}_{m}$
are provided from the Stokesian dynamics simulation; however, this was part of the problem in Ishikawa et al. (Reference Ishikawa, Simmonds and Pedley2006). In Ishikawa et al. (Reference Ishikawa, Simmonds and Pedley2006), the final linear algebraic equations for the problem contained zero diagonal components in the coefficient matrix. Thus, we could not solve it simply by an iterative method, but used a direct method or preconditioning of the matrix, which took a long computational time in the case of the dense matrix. The linear equations constructed in the BEM here, on the other hand, have non-zero diagonal components, which enables us to employ an iterative method to solve the linear equations. This small modification results in considerable acceleration of the calculation compared with the direct method employed in Ishikawa et al. (Reference Ishikawa, Simmonds and Pedley2006).
The nutrient particles are assumed to be taken up by squirmers when they come into contact with the surface of the squirmers. This boundary condition is equivalent to imposing a zero nutrient concentration at the cell surface, as was employed by Magar et al. (Reference Magar, Goto and Pedley2003). Another boundary condition for the concentration field, which is equivalent to imposing a maximum nutrient flux at the cell surface, is examined in appendix B. In the vicinity of a squirmer, the streamlines never penetrate the surface of the squirmer because of the purely tangential motion of the fluid to the surface of the squirmer (cf. (2.1)). Nutrient particles thus never touch the surface in the absence of the Brownian motion; however, using the BEM, it is difficult to calculate the velocity of the nutrient particles very close to the surface. To avoid penetration of streamlines at the surface, we calculate the velocity at locations closer than
 $0.1a$
to the surface of the squirmer by interpolating the boundary value given by (2.7) and the velocity of the fluid
 $0.1a$
from the surface.
2.3. Numerical method
We calculate the motion of squirmers and nutrient particles in a fluid that is otherwise at rest. The motion of the squirmers is calculated using the same method as Ishikawa et al. (Reference Ishikawa, Locsei and Pedley2008). The simulation domain is cubic, and the interactions among an infinite number of squirmers are calculated using Ewald summation. The initial position and orientation of the squirmers are generated randomly. The subsequent motion is calculated using the fourth-order Adams–Bashforth scheme with a time step of
 $10^{-3}a/U_{sol}$
. The number of squirmers in the unit domain is
 $M=32$
throughout this study. We confirm that the dependence of
 $Sh$
on
 $M$
is weak when
 $M\geqslant 32$
, which is discussed explicitly in appendix A. Since the number of squirmers is fixed at 32, the unit-domain size increases as the volume fraction of squirmers
 ${\it\phi}$
decreases.
The motion of nutrient particles is calculated using the BEM. The surface of each squirmer is discretized into 320 triangular elements, and the surface integral of
 $\boldsymbol{u}_{i}$
is calculated using 28-point Gaussian polynomials. The singularity in the integration at
 $\boldsymbol{x}=\boldsymbol{y}$
is removed by transforming to a polar coordinate system (Pozrikidis Reference Pozrikidis1992). The nutrient particles are initially randomly distributed, and their motion is calculated using the explicit Euler method with a time step of
 $10^{-2}a/U_{sol}$
. The number
 $N_{0}$
of nutrient particles initially distributed in the unit domain is varied to satisfy
 $N_{0}{\it\phi}\approx 260$
; i.e. when
 ${\it\phi}=0.01$
,
 $N_{0}=26\,000$
, whereas when
 ${\it\phi}=0.33$
,
 $N_{0}=788$
.
 $N_{0}{\it\phi}\approx 260$
is determined so that the computational expense is reasonable while maintaining accuracy in the calculation of
 $Sh$
.
The calculation terminates when the number of nutrient particles
 $N$
decreases to approximately
 $N=0.002N_{0}$
. The relaxation time of the average concentration of the suspension of nutrients depends strongly on
 ${\it\phi}$
. When
 ${\it\phi}=0.33$
, the average concentration decreases to
 $1/\text{e}$
in approximately
 $4a/U_{sol}$
, whereas when
 ${\it\phi}=0.01$
the concentration decreases to
 $1/\text{e}$
in approximately
 $250a/U_{sol}$
. We have previously (Ishikawa et al.
Reference Ishikawa, Locsei and Pedley2008) reported that collective motion of squirmers can develop in a dense suspension after a sufficiently long time. However, the time scale needed to develop collective motion is approximately two orders of magnitude longer than the relaxation time of the nutrient-concentration field. Because most nutrient particles are taken up before collective motion develops, we do not discuss the effect of collective motion.
Hereafter, all equations are made dimensionless using the radius
 $a$
, the characteristic velocity
 $U_{sol}$
, the fluid viscosity
 ${\it\mu}$
and the isotropic diffusivity of nutrient particles
 $D$
, unless it is explicitly mentioned. There are two important dimensionless parameters, in addition to
 ${\it\beta}$
and
 ${\it\phi}$
: the Péclet number
 $(Pe)$
, which is defined as
 $Pe=aU_{sol}/D$
, and describes the ratio of advection to diffusion of nutrient particles, and the Sherwood number
 $(Sh)$
, which is defined as
 $Sh=ah_{c}/D$
, where
 $h_{c}$
is the mass-transfer coefficient.
 $Sh$
describes the ratio of the total rate of mass transfer to the rate of diffusive mass transfer. The term
 $h_{c}$
is given in dimensional form by
 $h_{c}={\rm\Delta}NV/(4{\rm\pi}a^{2}MN)$
, where
 ${\rm\Delta}N$
is the number of particles that are taken up by
 $M$
squirmers in unit time and
 $V$
is the volume of the unit cubic domain. The following parameter range was examined in the simulations:
 $0.001\leqslant {\it\phi}\leqslant 0.33$
,
 $-3\leqslant {\it\beta}\leqslant 3$
and
 $1\leqslant Pe\leqslant 100$
. The volume fraction of cells in nature is typically less than 0.33, even in a dense suspension of bacteria (estimated from the number density of cells; see Dombrowski et al. (Reference Dombrowski, Cisneros, Chatkaew, Goldstein and Kessler2004) and Ishikawa et al. (Reference Ishikawa, Yoshida, Ueno, Wiedeman, Imai and Yamaguchi2011)). The value of
 $|{\it\beta}|$
for ciliates such as Volvox (Short et al.
Reference Short, Solari, Ganguly, Powers, Kessler and Goldstein2006), Paramecium (Ishikawa & Hota Reference Ishikawa and Hota2006) and Tetrahymena (Ferracci et al.
Reference Ferracci, Ueno, Numayama-Tsuruta, Imai, Yamaguchi and Ishikawa2013) is typically less than 0.3. With flagellates,
 $|{\it\beta}|$
is often larger than that of ciliates; however,
 $-3\leqslant {\it\beta}\leqslant 3$
covers a variety of flagellates, including Chlamydomonas (Pedley & Kessler Reference Pedley and Kessler1992). The value of
 $Pe$
depends on the size of the nutrient molecules.
 $Pe$
is the product of the Reynolds number (
 $Re$
) and the Schmidt number (
 $Sc$
). With swimming micro-organisms,
 $Re$
is in the range
 $10^{-5}{-}10^{-1}$
. With small molecules like oxygen,
 $Sc$
is in the order of
 $10^{3}$
. Therefore,
 $Pe$
will be in the range
 $10^{-2}{-}10^{2}$
. Since the results for
 $Pe$
 ${\leqslant}1$
were not significantly affected by the surface squirming velocity, we used the parameter range
 $1\leqslant Pe\leqslant 100$
. All simulations were carried out with five different sets of initial conditions, and the results were averaged over the five scenarios.
3. Results and discussion
3.1. Dilute limit
First, we calculated nutrient uptake of squirmers in the dilute regime, i.e.
 ${\it\phi}=0.001$
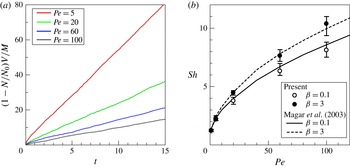
. Figure 1(a) shows the time change of the number of nutrient particles taken up by a squirmer, i.e.
 $(1-N/N_{0})V/M$
. The slope of figure 1(a) is proportional to the mass-transfer coefficient
 $h_{c}$
. We see that the slope converges quickly in time, and the effect of the initial condition is not significant when
 $t$
is sufficiently large.
Nutrient uptake in the dilute limit (
 ${\it\phi}=0.001$
). (a) Time change of number of nutrient particles taken up by a squirmer (
 ${\it\beta}=3$
). (b) Comparison of
 $Sh$
between the present study and Magar et al. (Reference Magar, Goto and Pedley2003) with
 ${\it\beta}=0.1$
and 3.

We compared the present results with Magar et al. (Reference Magar, Goto and Pedley2003), in which
 $Sh$
of a solitary squirmer was calculated with the same boundary conditions. In comparing the two results,
 $Sh$
in the present study was calculated using the slope in figure 1(a) after the uptake rate reached the steady state. We can see from figure 1(b) that
 $Sh$
increased as
 $Pe$
or
 ${\it\beta}$
increased. When
 ${\it\beta}$
increased from 0.1 to 3, the maximum surface velocity of a squirmer also increased considerably. The large surface velocity refreshed the cell’s surrounding fluid quickly, and attracted many nutrient particles far away from the cell. As shown in figure 1(b), the two datasets were in good agreement, which indicates that our method is reliable in the dilute regime.
Our results, as well as those of Magar et al. (Reference Magar, Goto and Pedley2003), indicate that nutrient uptake is enhanced by increasing the swimming velocity of the squirmer. In contrast, Lambert et al. (Reference Lambert, Picano, Breugem and Brandt2013) reported that nutrient uptake was suppressed by increasing the swimming velocity. We believe that the discrepancy between these studies comes from the difference in the boundary conditions: a zero nutrient concentration at the cell surface was imposed in our work and by Magar et al. (Reference Magar, Goto and Pedley2003), whereas a nutrientflux proportional to the local concentration with a coefficient that indicated the ratio of the uptake rate to the viscous time scale was used by Lambert et al. (Reference Lambert, Picano, Breugem and Brandt2013).
3.2. Sherwood number
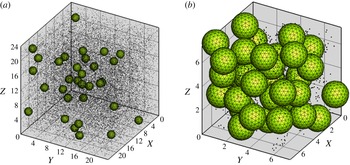
Figure 2 shows snapshots of the initial distribution of squirmers and nutrient particles in a unit domain with
 ${\it\phi}=0.01$
and 0.33. The number of nutrient particles
 $N$
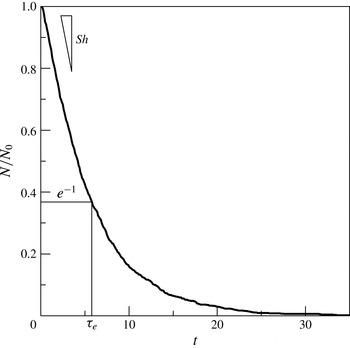
decreased with time because the nutrient particles that came into contact with the surface of the squirmers were taken up by cells. Figure 3 shows
 $N$
normalized to
 $N_{0}$
as a function of time. We can see an approximately exponential decay of the average concentration of nutrient particles. Because the nutrient particles were homogeneously distributed at
 $t=0$
,
 $Sh$
can be calculated from the time derivative of the concentration at
 $t=0$
(i.e. the initial gradient), as shown schematically in figure 3. We calculated
 $Sh$
using
 $h_{c}$
averaged over the range
 $N_{0}\geqslant N\geqslant 0.8N_{0}$
.
Sample snapshots of initial distribution of squirmers and nutrient particles in a unit domain with
 ${\it\phi}=0.01$
(a) and 0.33 (b).

The time change of the number of nutrient particles
 $N$
normalized by the initial number
 $N_{0}$
(
 ${\it\phi}=0.26,Pe=60,{\it\beta}=3$
). The definition of
 ${\it\tau}_{e}$
is shown schematically.
 $Sh$
can be calculated from the initial gradient.

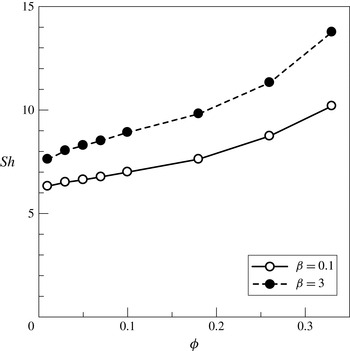
Figure 4 shows
 $Sh$
as a function of the volume fraction of squirmers
 ${\it\phi}$
.
 $Sh$
increased approximately linearly as
 ${\it\phi}$
increased for both values of
 ${\it\beta}$
for small values of
 ${\it\phi}$
; however, the increase became almost quadratic for larger values of
 ${\it\phi}$
. The figure indicates that the cell–cell interactions enhanced the nutrient uptake.
 $Sh$
increases with the nutrient uptake rate, and the uptake rate increases with increasing fluid velocity, i.e. an advection effect in the mass transport. By increasing
 ${\it\phi}$
, the ratio of the squirming surface area to the fluid volume increased, which enhanced the advection effect and eventually increased
 $Sh$
.
 $Sh$
was slightly larger for
 ${\it\beta}=3$
than with
 ${\it\beta}=0.1$
, as in the dilute limit (cf. figure 1). The results indicate that a larger squirming velocity at the cell surface resulted in increased nutrient uptake.
 $Sh$
as a function of the volume fraction
 ${\it\phi}$
(
 ${\it\beta}=0.1$
and 3,
 $Pe=60$
).

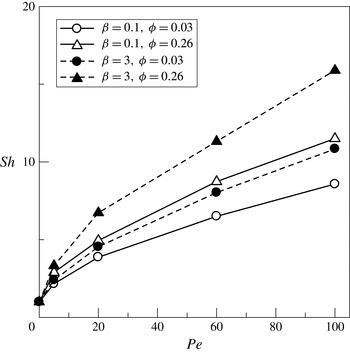
Figure 5 shows
 $Sh$
as a function of
 $Pe$
. As
 $Pe$
increased, so did
 $Sh$
. The curves are convex upward, and these trends were observed regardless of the value of
 ${\it\phi}$
or
 ${\it\beta}$
, which suggests that the effect of
 ${\it\phi}$
on
 $Sh$
can be described by a common function regardless of
 $Pe$
or
 ${\it\beta}$
; this will be discussed further in the following section.
 $Sh$
as a function of
 $Pe$
with various values of
 ${\it\phi}$
and
 ${\it\beta}$
.

3.3. Relaxation time
In this section, we discuss the decay process of the average nutrient concentration in the suspension. We define the relaxation time
 ${\it\tau}_{e}$
as the time scale for the nutrient concentration to reduce to
 $1/\text{e}$
, as shown in figure 3. We note that, in the case of a suspension of squirmers, an exponential decay of nutrient particles is not guaranteed, given that the mass-transfer coefficient
 $h_{c}$
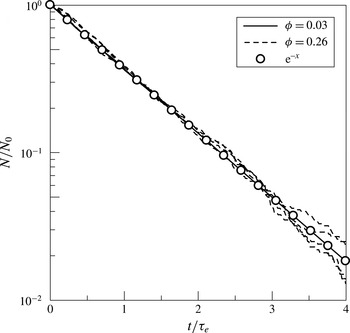
is dependent on the concentration distribution around a squirmer. To check whether the concentration field follows an exponential decay, in figure 6 we plot
 $N/N_{0}$
as a function of time for various
 ${\it\phi}$
and
 ${\it\beta}$
conditions (
 $Pe=60$
), where the horizontal axis is normalized by
 ${\it\tau}_{e}$
. The function
 $\exp (t/{\it\tau}_{e})$
is also plotted for comparison. The data were well fitted to exponential decay in all cases. Similar exponential decay was also observed for other values of
 $Pe$
(data not shown). Thus, in the parameter range used here, the nutrient uptake rate of cells also decreased exponentially, regardless of
 ${\it\phi}$
,
 ${\it\beta}$
and
 $Pe$
.
The time dependence of the number of nutrient particles with various
 ${\it\beta}$
and
 ${\it\phi}\,(Pe=60)$
. The four curves with
 ${\it\beta}=3$
, 0.1,
 $-0.1$
and
 $-3$
are plotted for
 ${\it\phi}=0.03$
and 0.26, although all converge to a similar line. The function
 $\text{e}^{-x}$
is shown by the circles for comparison.

In order to understand the decay process in the simulations in more detail, we analytically derive
 ${\it\tau}_{e}$
under a simplified condition. The time change of
 $N$
can be expressed in dimensional form by the following differential equation:
 $$\begin{eqnarray}\frac{\text{d}N}{\text{d}t}=-4{\rm\pi}a^{2}{\it\phi}_{M}h_{c}N,\end{eqnarray}$$
where
 ${\it\phi}_{M}$
is the number density of squirmers, defined by
 $M/V$
. Equation (3.1) provides the following correlation between
 $Sh$
and
 ${\it\tau}_{e}^{\prime }$
, where
 ${\it\tau}_{e}^{\prime }$
is dimensionless:
 $$\begin{eqnarray}{\it\tau}_{e}^{\prime }=\frac{{\it\tau}_{e}U_{sol}}{a}=\frac{U_{sol}}{3{\it\phi}h_{c}}=\frac{Pe}{3{\it\phi}Sh},\end{eqnarray}$$
which we postulate to be a function only of
 ${\it\phi}$
,
 $1/f({\it\phi})$
.
 $Sh$
could then be replaced by
 ${\it\tau}_{e}^{\prime }$
in describing the mass-transfer results, provided that
 $h_{c}$
is constant and that further dependence on
 $Pe$
and
 ${\it\beta}$
is negligible.
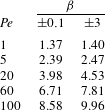
 $Sh_{0}$
values used in the study.

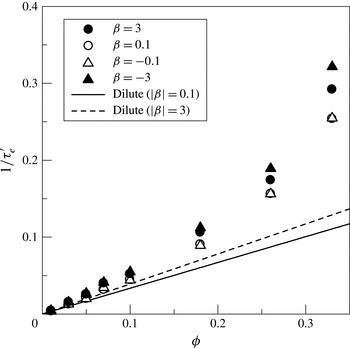
Figure 7 shows simulated data for
 $1/{\it\tau}_{e}^{\prime }$
as a function of
 ${\it\phi}$
with
 $Pe=60$
. Here
 ${\it\tau}_{e}^{\prime }$
is expressed as the denominator of the vertical axis to show the linearity in the dilute regime. The analytical function
 ${\it\tau}_{e}^{\prime }=Pe/(3{\it\phi}Sh_{0})$
is also plotted in the figure for comparison, where
 $Sh_{0}$
indicates
 $Sh$
in the dilute limit. The
 $Sh_{0}$
values used in the study are listed in table 1. We can see that
 $1/{\it\tau}_{e}^{\prime }$
increased more steeply than the analytical result in the dilute limit, which indicates that nutrient uptake was enhanced by the cell–cell interactions.
 $1/{\it\tau}_{e}^{\prime }$
as a function of the volume fraction
 ${\it\phi}$
with various values of
 ${\it\beta}\,(Pe=60)$
. The lines show analytical results in the dilute limit for comparison.

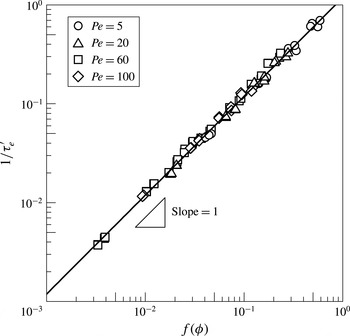
To confirm that
 $f({\it\phi})=3{\it\phi}Sh/Pe$
, as defined above, is proportional to
 $1/{\it\tau}_{e}^{\prime }$
, figure 8 shows all of the simulated data for
 $1/{\it\tau}_{e}^{\prime }$
, with the following parameter ranges:
 $0.01\leqslant {\it\phi}\leqslant 0.33$
,
 $-3\leqslant {\it\beta}\leqslant 3$
and
 $1\leqslant Pe\leqslant 100$
. We can see a good proportionality between
 $1/{\it\tau}_{e}^{\prime }$
and
 $f({\it\phi})$
, and a least-squares linear fit is given by
 $1/{\it\tau}_{e}^{\prime }=1.19f({\it\phi})$
.
 $1/{\it\tau}_{e}^{\prime }$
for all simulation cases plotted as a function of
 $f({\it\phi})$
, with
 $0.01\leqslant {\it\phi}\leqslant 0.33$
,
 $-3\leqslant {\it\beta}\leqslant 3$
and
 $1\leqslant Pe\leqslant 100$
. A fitted result with
 $y=1.19x$
is also plotted for comparison.

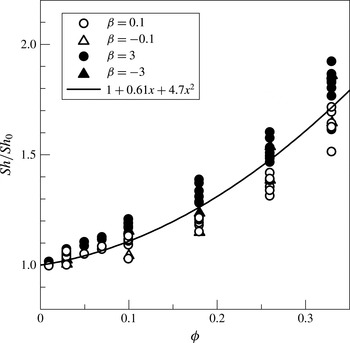
 $Sh$
for all simulation cases (with
 $5\leqslant Pe\leqslant 100$
,
 $-3\leqslant {\it\beta}\leqslant 3$
) plotted as a function of
 ${\it\phi}$
, where
 $Sh$
was normalized by its dilute-limit value
 $Sh_{0}$
. The fitted result
 $y=1+0.61x+4.7x^{2}$
is also plotted for comparison.

Although the data plotted in figure 8 are useful, we need to know
 $Sh$
for a given set of
 ${\it\beta}$
and
 ${\it\phi}$
to calculate
 ${\it\tau}_{e}^{\prime }$
. Calculating
 $Sh$
in the non-dilute regime requires a full calculation of the suspension, which is computationally expensive. It is, therefore, convenient if we can estimate the value of
 $Sh$
from the available data in the literature. Magar et al. (Reference Magar, Goto and Pedley2003) calculated
 $Sh_{0}$
analytically; i.e.
 $Sh$
in the dilute limit, for high and low
 $Pe$
conditions.
 $Sh_{0}$
with intermediate values of
 $Pe$
has also been reported for some values of
 ${\it\beta}$
. Thus, we intend to use
 $Sh_{0}$
determined by Magar et al. (Reference Magar, Goto and Pedley2003) to estimate
 $Sh$
with various values of
 ${\it\beta}$
and
 ${\it\phi}$
. Figure 9 shows the effect of
 ${\it\phi}$
on
 $Sh$
, normalized by
 $Sh_{0}$
, with different values of
 ${\it\beta}$
. Although
 $Sh/Sh_{0}$
was slightly larger for
 $|{\it\beta}|=3$
than for
 $|{\it\beta}|=0.1$
, we neglect this discrepancy and fit the data to a quadratic function for all cases. We found that a least-squares fit to
 $Sh/Sh_{0}=1+0.61{\it\phi}+4.7{\it\phi}^{2}$
provided a reasonable estimate of
 $Sh$
in the parameter range investigated here. Using this quadratic fit, (3.2) may be approximated as follows:
 $$\begin{eqnarray}{\it\tau}_{e}^{\prime }\approx \frac{Pe}{3{\it\phi}Sh_{0}(1+0.61{\it\phi}+4.7{\it\phi}^{2})},\end{eqnarray}$$
which we again postulate to be a function only of
 ${\it\phi}$
,
 $1/f^{\ast }({\it\phi})$
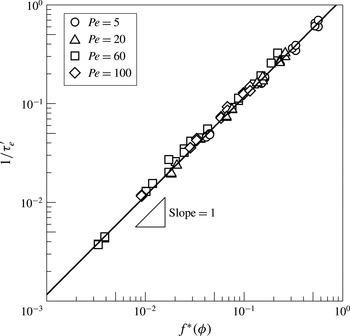
. Figure 10 shows all of the simulated data for
 $1/{\it\tau}_{e}^{\prime }$
with the following parameter ranges:
 $0.01\leqslant {\it\phi}\leqslant 0.33$
,
 $-3\leqslant {\it\beta}\leqslant 3$
and
 $1\leqslant Pe\leqslant 100$
. In the figure, we plot
 $f^{\ast }({\it\phi})$
instead of
 $f({\it\phi})$
as the horizontal axis. Again, we can see a good proportionality between
 $1/{\it\tau}_{e}^{\prime }$
and
 $f^{\ast }({\it\phi})$
, which shows that (3.3) is a reliable description of the problem. We find a least-squares fit to the linear function
 $1/{\it\tau}_{e}^{\prime }=1.16f^{\ast }({\it\phi})$
. Using (3.3) together with
 $Sh_{0}$
from Magar et al. (Reference Magar, Goto and Pedley2003), we can predict
 $Sh$
and
 ${\it\tau}_{e}^{\prime }$
for a wide range of cell suspensions in nature and in industrial applications.
 $1/{\it\tau}_{e}^{\prime }$
of all simulation cases are plotted as a function of
 $f^{\ast }({\it\phi}),0.01\leqslant {\it\phi}\leqslant 0.33,-3\leqslant {\it\beta}\leqslant 3$
and
 $1\leqslant Pe\leqslant 100$
. The fitted line
 $y=1.16x$
is also plotted for comparison.

3.4. Energy efficiency
In this section, we calculate the swimming energy of the squirmers. The swimming energy of an individual squirmer can be calculated as follows (Giacche & Ishikawa Reference Giacche and Ishikawa2010):
 $$\begin{eqnarray}E_{m}=\int _{A_{m}}\boldsymbol{q}(\boldsymbol{x})\boldsymbol{\cdot }\boldsymbol{u}(\boldsymbol{x})\,\text{d}A_{x}-E_{in},\end{eqnarray}$$
where
 $E_{in}$
is the energy dissipation of the virtual velocity field inside the squirmer and
 $E_{in}=18{\rm\pi}(1+{\it\beta}^{2}/3)$
. In the dilute limit,
 $E_{m}$
is given as
 $E_{0}=12{\rm\pi}(1+{\it\beta}^{2}/2)$
.
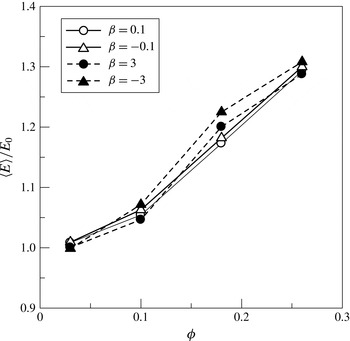
Figure 11 shows the effect of
 ${\it\phi}$
on the average swimming energy of the squirmer
 $\langle E\rangle$
, normalized by
 $E_{0}$
, with various values of
 ${\it\beta}$
. We can see that the swimming energy increased as
 ${\it\phi}$
increased; it follows that additional energy is required to maintain the surface squirming velocity in a dense suspension of cells. This is consistent with Lambert et al. (Reference Lambert, Picano, Breugem and Brandt2013), who found that an increase in the swimming energy was required in a concentrated film suspension.
The average swimming energy
 $\langle E\rangle$
of the squirmers as a function of the volume fraction
 ${\it\phi}$
with various values of
 ${\it\beta}$
. Here
 $\langle E\rangle$
is shown normalized by the energy of a solitary squirmer
 $E_{0}$
.

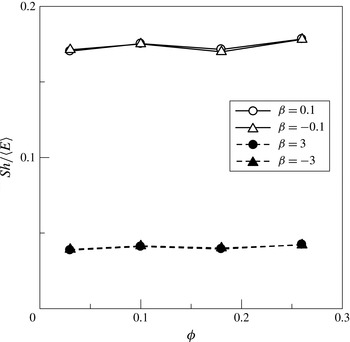
The nutrient uptake per unit energy is biologically significant. We calculated
 $Sh/\langle E\rangle$
, as shown in figure 12. We can see that
 $Sh/\langle E\rangle$
was not significantly affected by
 ${\it\phi}$
. Both
 $Sh$
and
 $E$
increased with increasing
 ${\it\phi}$
, and the nutrient uptake per unit energy was nearly independent of
 ${\it\phi}$
. Aggregation of cells, therefore, may not be a good strategy for efficient nutrient uptake. This conclusion is in contrast with that for confined suspensions, in which swimming is still a winning strategy for micro-organism survival in the dense suspensions (Lambert et al.
Reference Lambert, Picano, Breugem and Brandt2013). Note that
 ${\it\tau}_{e}$
is inversely proportional to
 ${\it\phi}$
; thus, aggregated cells use up all of the nutrients in a relatively short time.
The nutrient uptake per unit swimming energy
 $Sh/\langle E\rangle$
as a function of the volume fraction
 ${\it\phi}$
, with various values of
 ${\it\beta}$
.

Figure 12 also shows that
 ${\it\beta}$
significantly affected
 $Sh/\langle E\rangle$
. The uptake efficiency was much larger for
 $|{\it\beta}|=0.1$
cases than with
 $|{\it\beta}|=3$
. Thus, improving the swimming mode may be a good strategy for cells to increase the uptake efficiency of nutrients. In the dilute limit, Michelin & Lauga (Reference Michelin and Lauga2011) showed that the maximum nutrient uptake per unit energy occurred for
 ${\it\beta}=0$
. Even in the non-dilute regime, the uptake per unit energy may become maximum at
 ${\it\beta}=0$
, which should be proved in a future study.
4. Conclusions
We numerically investigated nutrient uptake in an infinite suspension of squirmers. In the dilute limit, our results were in good agreement with those of Magar et al. (Reference Magar, Goto and Pedley2003). By increasing the volume fraction of squirmers, the nutrient uptake of individual cells was enhanced due to hydrodynamic interactions. The average nutrient concentration of the suspension decreased exponentially as a function of time, and the relaxation time
 ${\it\tau}_{e}$
was calculated using (3.2). Furthermore, we proposed (3.3) to estimate
 ${\it\tau}_{e}$
and
 $Sh$
with a wide range of parameters (i.e.
 $0.01\leqslant {\it\phi}\leqslant 0.33$
,
 $-3\leqslant {\it\beta}\leqslant 3$
and
 $1\leqslant Pe\leqslant 100$
). We expect that, by combining (3.3) and
 $Sh_{0}$
determined by Magar et al. (Reference Magar, Goto and Pedley2003), one may easily predict
 $Sh$
and
 ${\it\tau}_{e}$
for a wide variety of cell suspensions in nature and in industrial applications. Finally, we analysed the swimming energy consumption of individual cells. The results indicate that both the energetic cost and the nutrient uptake increase as the volume fraction of squirmers increases. The uptake per unit energy is not significantly affected by the volume fraction, which is in contrast with a highly confined domain (cf. Lambert et al.
Reference Lambert, Picano, Breugem and Brandt2013). These findings have important consequences for our understanding of mass transport and the metabolism of swimming micro-organisms. We expect that the results reported here will help future experimental efforts and be validated experimentally.
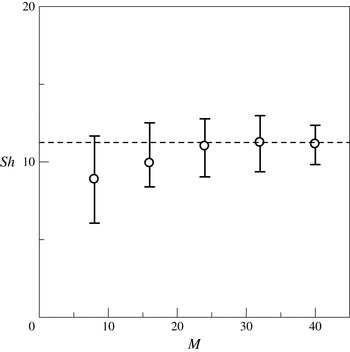
The effects of the number of squirmers
 $M$
on the calculation of
 $Sh$
(
 ${\it\phi}=0.26,Pe=60,{\it\beta}=3$
).

Acknowledgements
This research was supported by JSPS KAKENHI grant numbers 25000008 and 26242039.
Appendix A. Effect of the number of squirmers in a unit domain
Here we discuss the effect of the number of squirmers
 $M$
on the calculation of the nutrient uptake. Figure 13 shows
 $Sh$
as a function of
 $M$
with
 ${\it\phi}=0.26$
,
 $Pe=60$
and
 ${\it\beta}=3$
. We can see that
 $Sh$
was almost constant for
 $M\geqslant 24$
. Considering the trade-off between numerical accuracy and computational efficiency, we used
 $M=32$
in this study.
Appendix B. Another boundary condition: imposing a maximum nutrient flux at the cell surface
Here we investigate the nutrient uptake with different boundary conditions for the concentration field. In the main text, we assumed that nutrient particles were taken up by a squirmer when they came into contact with its surface. This boundary condition is equivalent to imposing a zero nutrient concentration at the cell surface; i.e. Dirichlet boundary conditions, as were employed by Magar et al. (Reference Magar, Goto and Pedley2003). In this appendix, we assume that nutrient particles are taken up by a squirmer with a limited nutrient flux at the cell surface; i.e. Neumann boundary conditions.
We restricted the mass-transfer coefficient to
 $h_{c}\leqslant h_{c,max}$
, which gives the maximum
 $Sh$
as
 $Sh_{max}=ah_{c,max}/D$
. The Neumann boundary condition was implemented as follows. After a squirmer uptakes a single nutrient particle, we ensure that the squirmer does not take another nutrient particle for a dimension-free time
 ${\it\delta}t_{d}=Pe/(4{\rm\pi}nSh_{max})$
, where
 $n$
is the number density of nutrient particles. A nutrient particle that comes into contact with the surface of the squirmer during
 ${\it\delta}t_{d}$
is not taken up by the cell, and remains at the cell’s surface. We note that imposing a zero nutrient concentration at the cell’s surface is equivalent to assuming an infinitely large
 $h_{c,max}$
. Thus, the results with
 $Sh_{max}\rightarrow \infty$
become identical to those with the Dirichlet boundary condition.
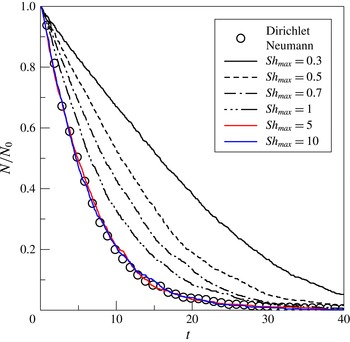
A comparison between the nutrient uptake with Dirichlet and Neumann boundary conditions (
 ${\it\phi}=0.26,Pe=60,{\it\beta}=0.1$
).
 $Sh_{max}$
was varied in the range 0.3–10.

Figure 14 shows
 $N/N_{0}$
as a function of time with various
 $Sh_{max}$
conditions (
 ${\it\phi}=0.26,Pe=60$
and
 ${\it\beta}=0.1$
). The results with the Dirichlet boundary condition (i.e. imposing a zero nutrient concentration at the surface of the cell) are also shown in the figure for comparison. We can see that the results with
 $Sh_{max}\geqslant 5$
fit well with those with the Dirichlet boundary condition. Since the Dirichlet boundary condition is equivalent to imposing
 $Sh_{max}\rightarrow \infty$
, the results in figure 3 are unaffected when
 $Sh_{max}$
is sufficiently large. When
 $Sh_{max}\leqslant 1$
, however, the rate of uptake becomes limited by
 $h_{c,max}$
. The rate of nutrient uptake is affected mainly by
 $h_{c,max}$
, and other parameters such as
 ${\it\beta}$
and
 ${\it\phi}$
are less significant. This is the principal reason that we used Dirichlet boundary conditions in this work.