1 Introduction
The flow past a solid obstacle has been the object of many previous studies because it is encountered in numerous industrial applications, including the calculation of aerodynamic forces around cooling towers, tall buildings and structures such as bridges, chimneys, heat exchangers, etc. The wake of bluff bodies, especially cylinders, is subject to two-dimensional von Kàrmàn vortex shedding when the associated Reynolds number is larger than a threshold value, 49 in the case of a square cylinder (Davis, Moore & Purtell Reference Davis, Moore and Purtell1984; Williamson Reference Williamson1988; Roshko Reference Roshko1993; Williamson Reference Williamson1996). At higher Reynolds numbers, around 175 for a square cylinder and 189 for a circular cylinder, the wake becomes unstable to three-dimensional disturbances. The transition from two- to three-dimensional flow in the wake of cylinders is accompanied by the formation of a tongue-shaped vortical structure with a large wavelength in the spanwise direction: this regime is referred to as mode
 $A$
(Barkley & Henderson Reference Barkley and Henderson1996; Brede, Eckelmann & Rockwell Reference Brede, Eckelmann and Rockwell1996; Henderson Reference Henderson1997; Robichaux, Balachandar & Vanka Reference Robichaux, Balachandar and Vanka1999). A rib-like vortical structure is also observed with a small wavelength and denoted mode
 $B$
. By performing Floquet stability analysis, a third regime that is quasi-periodic, denoted mode
 $QP$
, is observed with an intermediate wavelength between those of modes
 $A$
and
 $B$
(Barkley & Henderson Reference Barkley and Henderson1996; Henderson Reference Henderson1997; Robichaux et al.
Reference Robichaux, Balachandar and Vanka1999; Blackburn & Lopez Reference Blackburn and Lopez2003).
An interesting analogy and common features were observed by Brede et al. (Reference Brede, Eckelmann and Rockwell1996) between the shape and the wavelength of the formed secondary vortices in a circular cylinder wake and those of the plane shear layer instability. In both cases, secondary vortices are formed as tongues that are pulled out of the primary vortex roller and the spanwise wavelength is slightly larger than
 $2/3$
of the streamwise wavelength. This agreement suggests that a similar mechanism of three-dimensional transition may be in play for both flow fields. The numerical stability analysis of the flow in the circular cylinder wake by Barkley (Reference Barkley2005) using smaller sub-domains (between
 $1.5D$
and
 $3D$
downstream of the cylinder, where
 $D$
is the diameter of the cylinder), has shown that small regions of the wake just behind the cylinder are sufficient to capture the mode
 $A$
and
 $B$
instabilities observed in wake transition. The same conclusion has also been carried out in Giannetti, Camarri & Luchini (Reference Giannetti, Camarri and Luchini2010) using a sensitivity analysis of the three-dimensional secondary instability of a circular cylinder wake. Recently, it was shown in Agbaglah & Mavriplis (Reference Agbaglah and Mavriplis2017) that the first three-dimensional unstable mode, mode
 $A$
, is not inherent and even occurs prior to the streamwise vortex shedding event and that mode
 $A$
originates from an axial stretching of the upstream perturbed vorticity under a shear instability of the wake. Thus, it appears that the dynamics of the near wake, preliminary to the vortex shedding, is of crucial importance in the formation and development of three-dimensional transition instabilities.
The wakes of square and circular cylinders have been compared in previous studies by fixing the corresponding Reynolds number and using a circular cylinder with a diameter equal to the length of a side of the square cylinder (see for instance Robichaux et al. Reference Robichaux, Balachandar and Vanka1999; Saha, Biswas & Muralidhar Reference Saha, Biswas and Muralidhar2003; Ozgoren Reference Ozgoren2006). It is well known that for a square cylinder, the separation points are fixed at the front leading edges while their position varies with Reynolds number for a circular cylinder. In the case of a square cylinder, this has the effect of increasing the effective width of the body. For the same Reynolds number, the Strouhal number in flow past a circular cylinder has been shown to be larger than in flow past a square cylinder while it is also noted that there is similarity between the circular and square cylinders in their transition sequences at low Reynolds numbers.
In the present study, instead of comparing wakes of square and circular cylinders with the same diameter and consequently fixing the corresponding Reynolds number, we use the circumscribed circular cylinder, which has a larger diameter than that of the square cylinder we compare to. Similarities of the flow in the vicinity of the square cylinder and that of the square’s circumscribed circular cylinder are examined. In particular, characteristics of the shear layer formed in the side wall and the near wake behind both cylinders are compared through time averages performed in both the early-time period before the streamwise vortex shedding and after the shedding has occurred. Results of previous Floquet stability analyses of square and circular cylinder wakes, (Barkley & Henderson Reference Barkley and Henderson1996; Robichaux et al. Reference Robichaux, Balachandar and Vanka1999; Blackburn, Marques & Lopez Reference Blackburn, Marques and Lopez2005; Sheard, Fitzgerald & Ryan Reference Sheard, Fitzgerald and Ryan2009), are finally compared in the case of the circumscribed circular cylinder.
2 Numerical method and simulations
Numerical computations of a single-phase flow are performed by solving the incompressible Navier–Stokes equations, with constant density and viscosity, respectively denoted by
 $\unicode[STIX]{x1D70C}$
and
 $\unicode[STIX]{x1D707}$
:
 $$\begin{eqnarray}\displaystyle & \unicode[STIX]{x1D70C}(\unicode[STIX]{x2202}_{t}\boldsymbol{u}+\boldsymbol{u}\boldsymbol{\cdot }\unicode[STIX]{x1D735}\boldsymbol{u})=-\unicode[STIX]{x1D735}p+\unicode[STIX]{x1D735}\boldsymbol{\cdot }\unicode[STIX]{x1D749}+\unicode[STIX]{x1D70C}\boldsymbol{f}, & \displaystyle\end{eqnarray}$$
 $$\begin{eqnarray}\displaystyle & \unicode[STIX]{x1D735}\boldsymbol{\cdot }\boldsymbol{u}=0, & \displaystyle\end{eqnarray}$$
where
 $\boldsymbol{u}$
is the fluid velocity vector with components
 $u,v,w$
in the streamwise, vertical and spanwise directions, respectively. Here
 $\unicode[STIX]{x1D749}=\unicode[STIX]{x1D707}[\unicode[STIX]{x1D735}\boldsymbol{u}+\unicode[STIX]{x1D735}\boldsymbol{u}^{T}]$
is the viscous stress tensor,
 $\boldsymbol{f}$
represents external forces and
 $p$
the pressure. The simulations are conducted using the high-order spectral element code Nek5000 (Fischer, Lottes & Kerkemeier Reference Fischer, Lottes and Kerkemeier2008), in which the computational domain is decomposed into
 $K$
hexahedral spectral elements upon which the governing equations are written in the weak form and discretized using a Galerkin method. In each element, the solution on the nodal points is approximated by tensor products of
 $N$
th-order Legendre polynomial Lagrangian interpolants. The time derivative is discretized via a second-order implicit backward differentiation and nonlinear convective terms are advanced using an explicit fourth-order Runge–Kutta scheme; it is also overintegrated (dealiasing) to ensure that skew symmetry is retained. The obtained temporal discretization system is solved by decoupling the viscous and pressure terms via a time splitting operation. We refer to Fischer (Reference Fischer1997) for more details.
Numerical simulations are performed using both a square cylinder (
 $SC$
) and a circular cylinder (
 $CC$
). The length of the simulation domain is
 $L=31D$
, with a height
 $H=21D$
and a spanwise length
 $S=6D$
, where
 $D$
is the length of a side of the square cylinder. Note that the largest wavelength of the unstable transition modes is in the range
 $5D{-}5.8D$
(Henderson Reference Henderson1997; Robichaux et al.
Reference Robichaux, Balachandar and Vanka1999; Blackburn & Lopez Reference Blackburn and Lopez2003; Luo, Tong & Khoo Reference Luo, Tong and Khoo2007). The distances from the centre of the cylinders to the upstream, transverse and downstream boundaries are respectively
 $10.5D$
,
 $10.5D$
and
 $20.5D$
. As shown in Agbaglah & Mavriplis (Reference Agbaglah and Mavriplis2017), a domain height of
 $7D$
and a polynomial order
 $N=7$
are sufficient to accurately capture the two-dimensional dynamics of the flow past a square cylinder, showing only 2 % of maximum error when comparing with Strouhal numbers obtained in Breuer et al. (Reference Breuer, Bernsdorf, Zeiser and Durst2000). It is also shown that computed growth rates of the spanwise instability in three-dimensional simulations have approximately the same values for
 $N=7,9,11$
with a relative error lower than 3 %. Here,
 $K=7272$
spectral elements and the polynomial order
 $N=7$
are used. For reasons that become clear later, the circumscribed circle to the square is used for the
 $CC$
simulations. Therefore, the diameter of the circular cylinder is
 $D^{\prime }=\sqrt{2}D$
. Note that an equivalent to the above mentioned simulation domain, in which the distances from the centre of the
 $CC$
simulations to the upstream, transverse and downstream boundaries are respectively
 $10.5D^{\prime }$
,
 $10.5D^{\prime }$
and
 $20.5D^{\prime }$
, is used in preliminary simulations (not reported herein) and has shown no significant difference in the dynamics of the flow when comparing to the domain used for the
 $SC$
simulations. For convenience, results from the same computational domain
 $(L,H,S)=(31D,21D,6D)$
are presented in this paper. Stress-free impermeable boundaries, corresponding to mirror symmetries, are imposed in the spanwise direction and on the top and bottom edges while outflow conditions are applied at the outlet. A free stream inflow velocity
 $U_{0}$
is prescribed at the domain left edge and used to initialize the calculations. Two dimensionless numbers are used to characterize the numerical simulations, namely the Reynolds number
 $Re=\unicode[STIX]{x1D70C}DU_{0}/\unicode[STIX]{x1D707}$
for the
 $SC$
and
 $Re^{\prime }=\unicode[STIX]{x1D70C}D^{\prime }U_{0}/\unicode[STIX]{x1D707}=\sqrt{2}Re$
for the
 $CC$
simulations, and the Strouhal number
 $St=fD/U_{0}$
where
 $f$
is the measured frequency of the vortex shedding in the wake of the cylinder. Note that, apart from the diameters, the entrance velocity
 $U_{0}$
, the density and the viscosity are identical for the
 $SC$
and the
 $CC$
simulations. Present computations are performed without imposing upstream disturbances; downstream instabilities are promoted by discretization errors arising from the governing equations along with those from the boundary conditions.
The near wake of the cylinder is analysed by focusing on the early-time dynamics consisting of the time period from the first domain flow through time to the onset time of the vortex shedding. The duration of this time period is typically larger than 10 periods of the subsequent vortex shedding. The long-time dynamics, dominated by the periodic streamwise vortex shedding, is considered next.
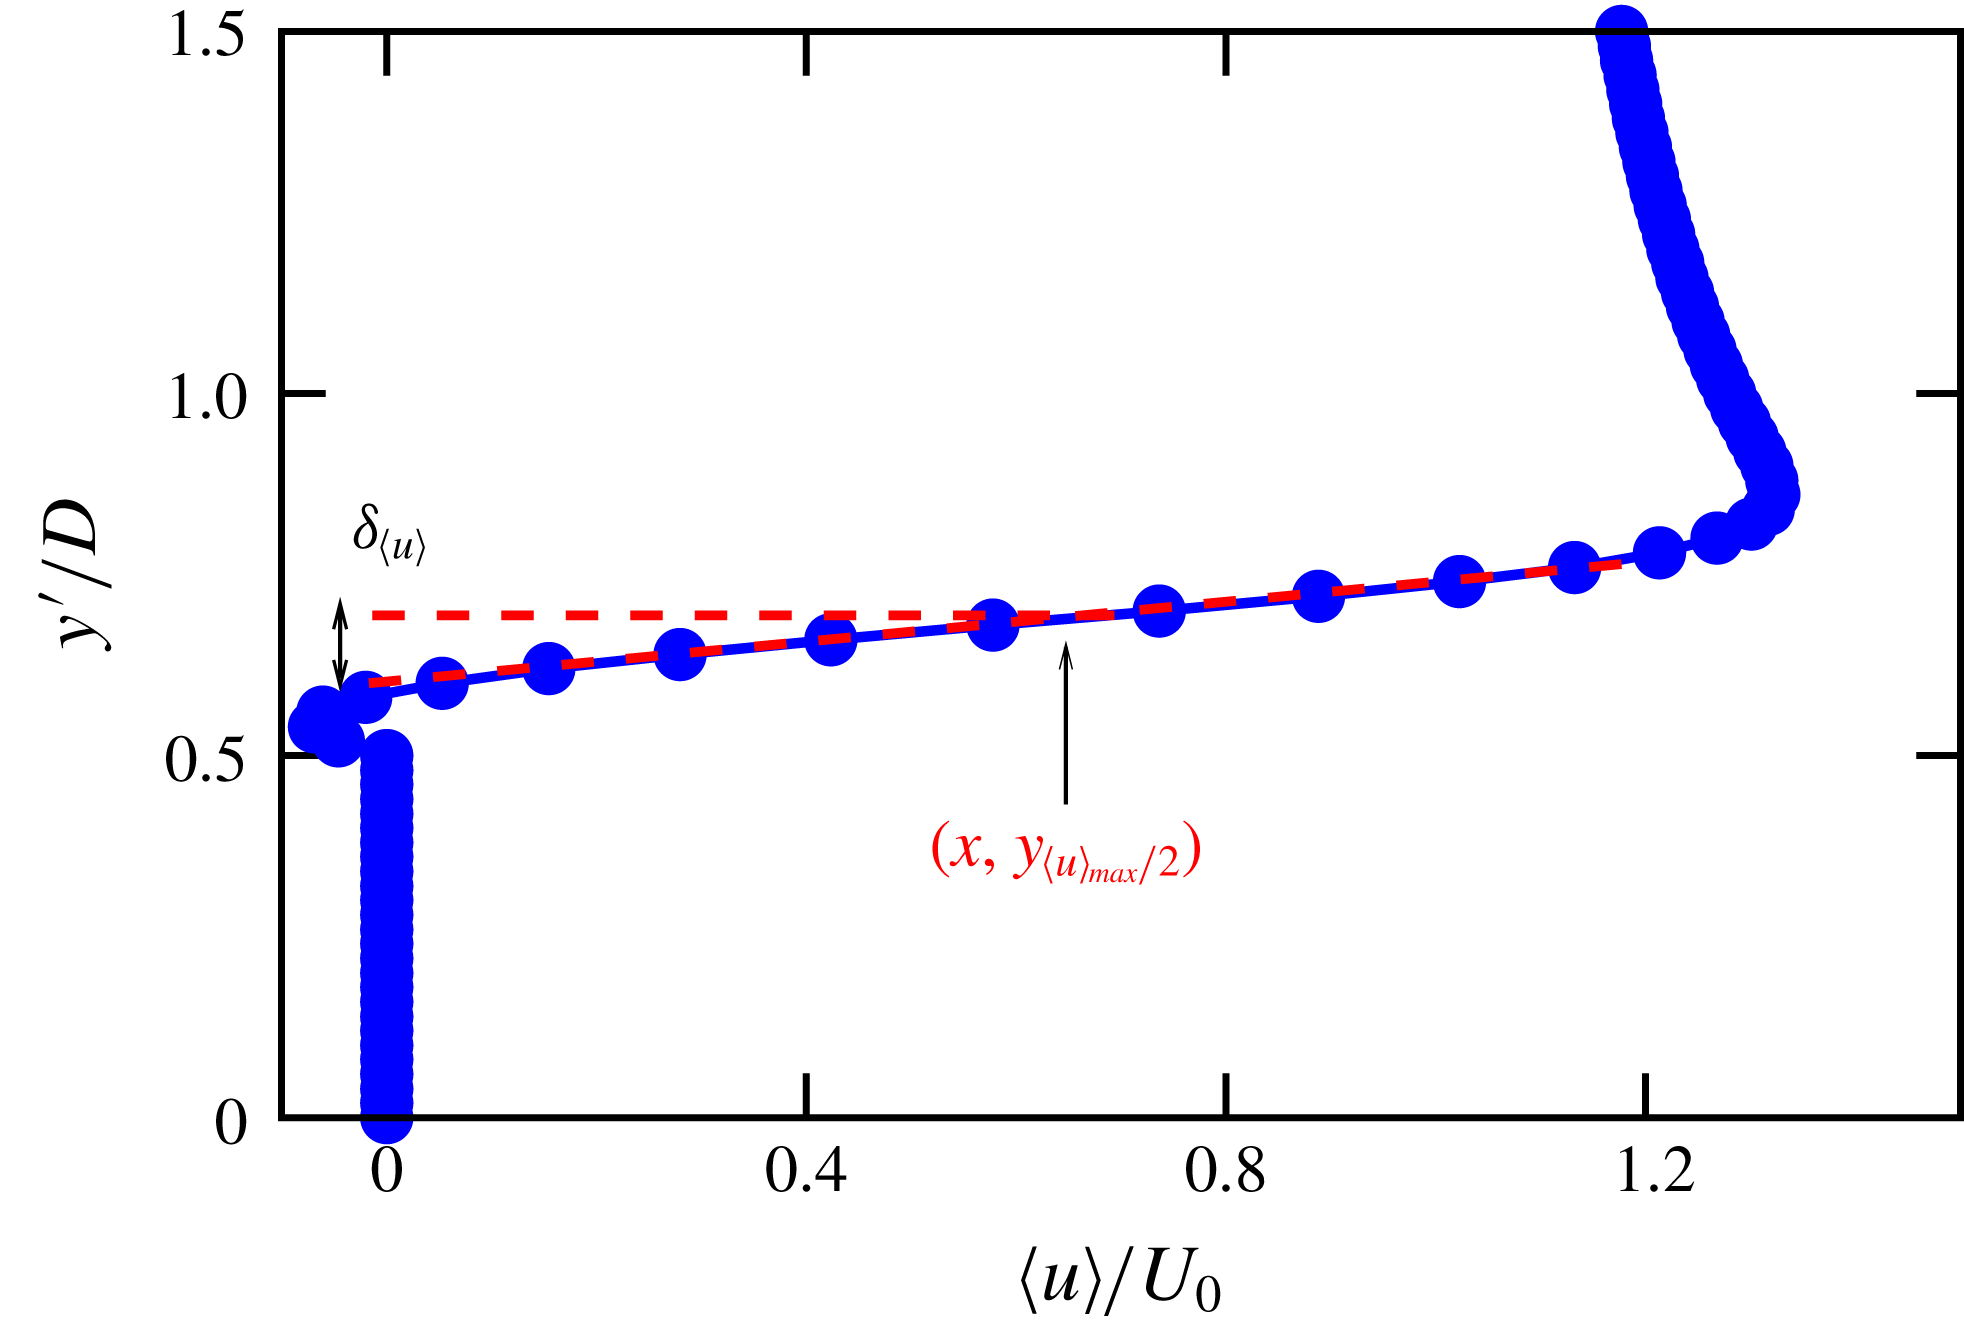
Sketch showing the calculation of the mean mixing layer thickness,
 $\unicode[STIX]{x1D6FF}_{\langle u\rangle }$
;
 $y^{\prime }$
represents the cross-streamwise coordinate centred at the middle of the cylinder.

3 Early-time dynamics of the near wake
The flow around the
 $SC$
and the
 $CC$
is examined and compared in the early-time range based on instantaneous and averaged velocity fields on the upper part of the side wall boundary and the near wake behind the cylinders. The time period considered in this section corresponds to 12 and 22 periods of the subsequent vortex shedding respectively for the
 $CC$
and the
 $SC$
simulations, starting from the first flow through time,
 $tU_{0}/D=31$
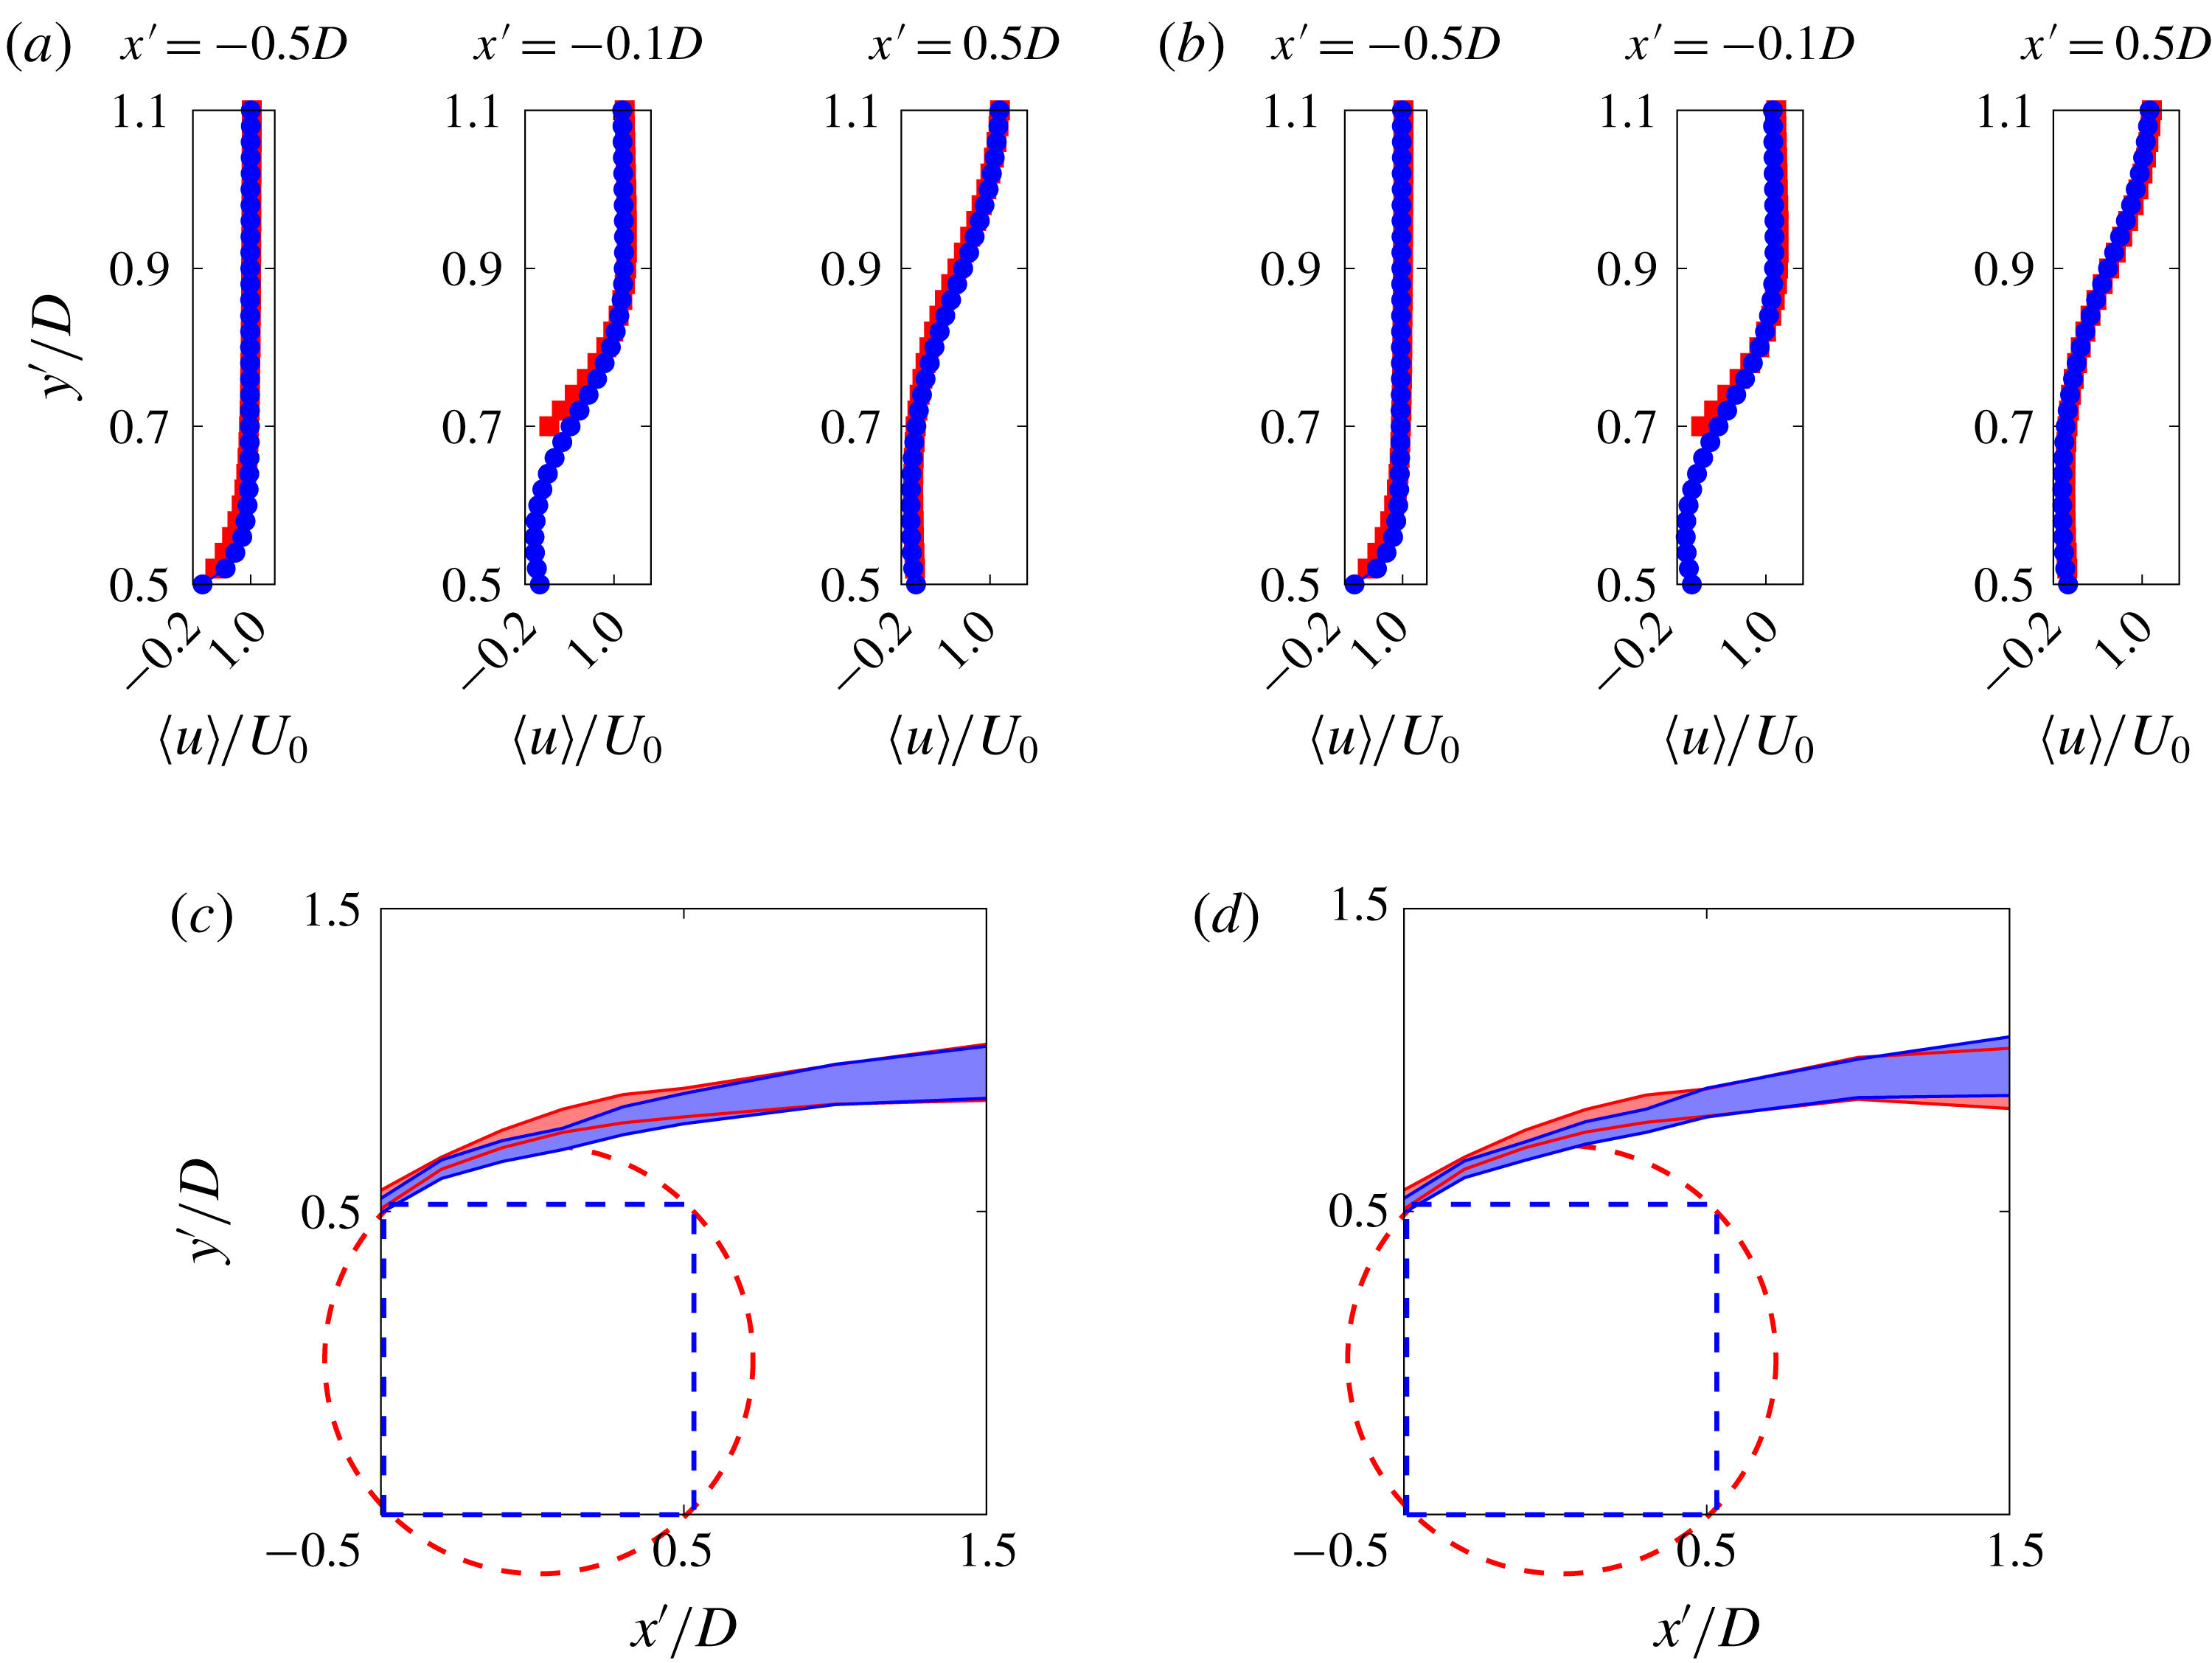
. The streamwise velocity field is averaged in time and spanwise direction. Figures 2(a) and 2(b) show the average
 $u$
-velocity for Reynolds numbers
 $Re=205$
and 225, respectively, on the upper part of the side wall boundary of the
 $SC$
and the
 $CC$
. Maxima of the velocity profiles in figure 2 are approximately the same for the
 $SC$
and the
 $CC$
simulations. A mean mixing region is extracted from the average
 $u$
-velocity profiles close to the cylinders and shown in figures 2(c) and 2(d). The mean mixing layer thickness,
 $\unicode[STIX]{x1D6FF}_{\langle u\rangle }$
, is computed at each
 $x$
location from the forward top corner of the square cylinder to the near wake of the cylinder, by calculating the vertical distance between
 $y_{\langle u\rangle _{max}/2}$
, the ordinate of the point corresponding to half of the maximum velocity, and
 $y_{T}$
, the intersection of the tangent to the average velocity profile at the position
 $(x,y_{\langle u\rangle _{max}/2})$
with the axis
 $y_{\langle u\rangle =0}$
, i.e.
 $\unicode[STIX]{x1D6FF}_{\langle u\rangle }=|y_{\langle u\rangle _{max}/2}-y_{T}|$
, see figure 1. It should be noted that only velocity averages of points with ordinates smaller than
 $y_{\langle u\rangle _{max}}$
are considered in the velocity mixing layer computation. A similar mixing layer has been used in a previous study (see for instance Agbaglah & Desjardins Reference Agbaglah, Chiodi and Desjardins2017). The loci of the mean mixing layer are shown in figures 2(c) and 2(d) for Reynolds numbers of 205 and 225, respectively, with sketches of the
 $SC$
and the
 $CC$
added for guidance. The mean mixing layer for both the
 $SC$
and the
 $CC$
are located at approximately the same position. A little deviation is observed in the side wall due to the circular shape of the
 $CC$
but that is mostly recovered downstream of the cylinder. The flow separation and the recirculation regions on the top/bottom of the
 $SC$
have the effect of increasing the effective width of the
 $SC$
body, making it comparable with the diameter of the circumscribed circular cylinder.
Comparison of early-time averaged streamwise velocity profiles on the upper part of the side wall boundary of the square (blue
 $\circ$
) and circular (red
 $\Box$
) cylinders for
 $Re=205$
(a) and
 $Re=225$
(b); for the
 $CC$
these correspond to
 $Re^{\prime }=289.9$
and
 $Re^{\prime }=318.2$
, respectively. The average is calculated both in time and spanwise direction. The loci of the mean mixing layer are shown in (c) and (d) for
 $Re=205$
and
 $Re=225$
, respectively. Sketches of the
 $SC$
and the
 $CC$
are added for guidance.
 $x^{\prime }$
and
 $y^{\prime }$
are the streamwise and the cross-streamwise coordinates, respectively, centred at the middle of the cylinders.

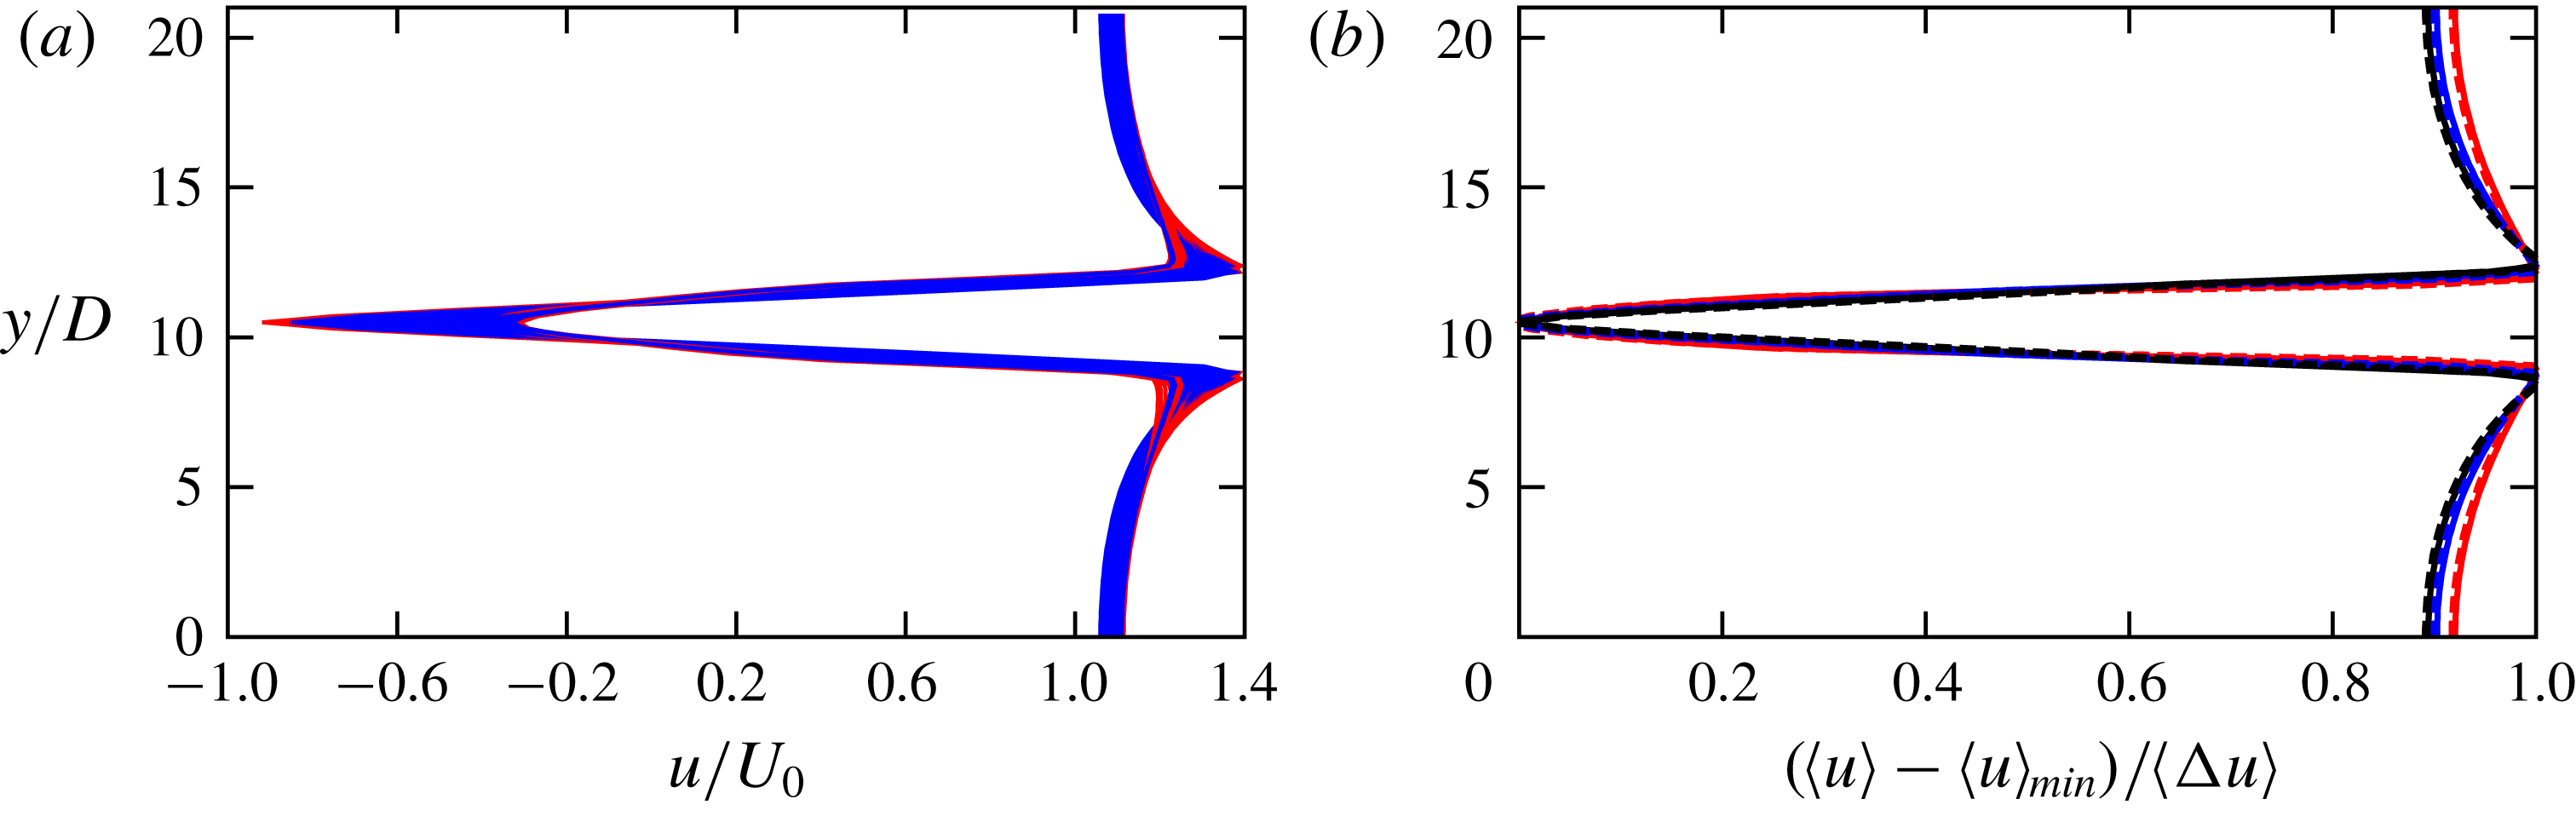
A self-similar behaviour is observed for the
 $u$
-velocity profile downstream of the cylinder as shown in figure 3(a), where instantaneous profiles are superimposed for 100 different times at a downstream distance of
 $3D$
from the
 $SC$
and the
 $CC$
. The minimum correlation coefficient for the curves in this figure is approximately 0.93. A comparison of the average velocity profiles for the
 $SC$
and the
 $CC$
wakes, plotted in standard ‘similarity’ coordinates, is presented in figure 3(b) at three different downstream locations:
 $1D$
,
 $2D$
and
 $3D$
. The agreement is surprisingly very good, showing that the difference in the shape of the cylinders has no significant effect on the mean downstream velocities for the considered
 $Re$
numbers.
(a) Superposition of instantaneous
 $u$
-velocity profiles obtained
 $3D$
downstream of the cylinder and half the span length, in flow past the square (blue lines) and the circular (red lines) cylinders. Early-time-averaged streamwise velocity profiles are shown in (b) at three different downstream distances of the square and circular cylinders:
 $1D$
(red lines),
 $2D$
(blue lines) and
 $3D$
(black lines). The velocity averages are calculated both in time and spanwise direction and are plotted in similarity coordinates:
 $(\langle u\rangle -\langle u\rangle _{min})/\langle \unicode[STIX]{x0394}u\rangle$
, where
 $\langle \unicode[STIX]{x0394}u\rangle =\langle u\rangle _{max}-\langle u\rangle _{min}$
with
 $\langle u\rangle _{max}$
and
 $\langle u\rangle _{min}$
the maximum and the minimum averaged
 $u$
-velocity, respectively. Solid lines represent the flow past the square cylinder (
 $Re=205$
) and the dashed lines represent the flow past the circular cylinder (
 $Re^{\prime }=289.9$
).

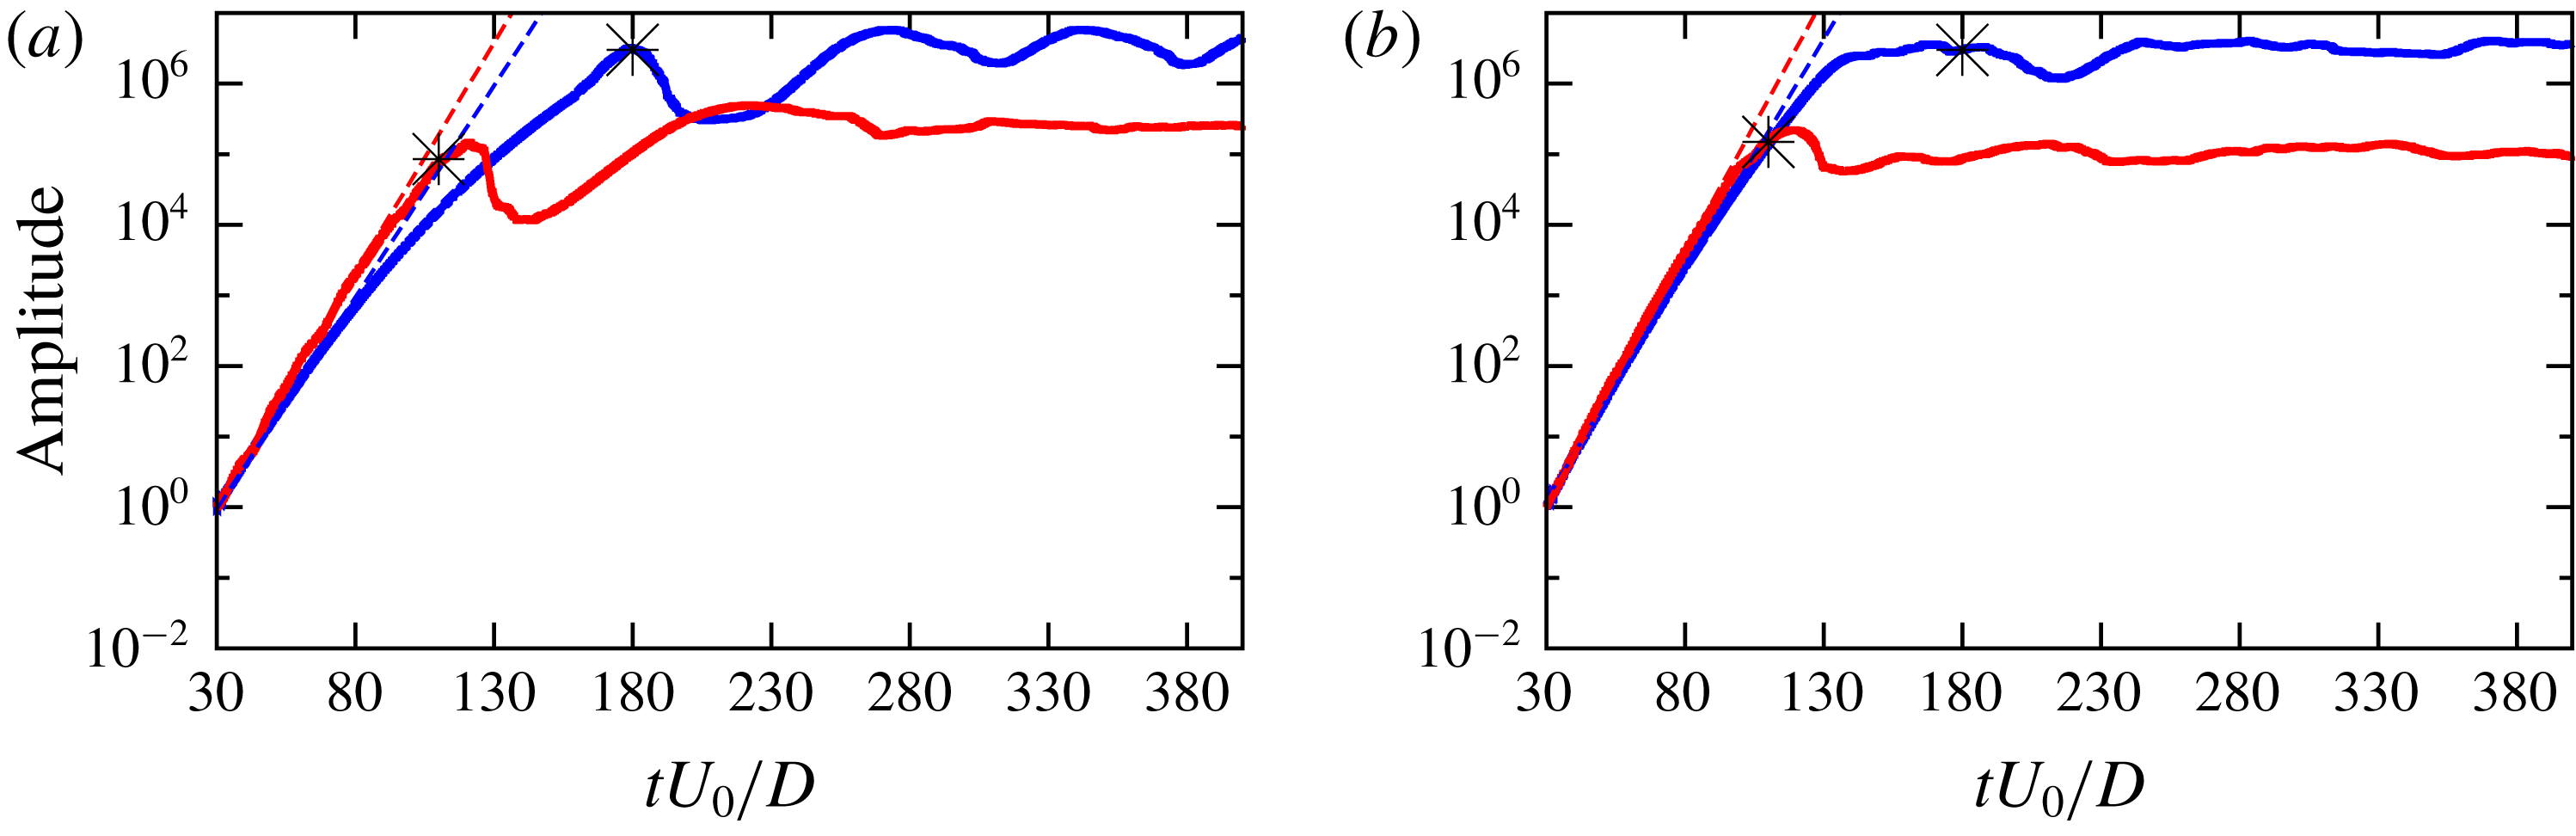
The growth of the spanwise instability is monitored by its amplitude in time, calculated as the
 $L_{2}$
norm of the spanwise perturbation velocity:
 $\sqrt{\int _{\unicode[STIX]{x1D6FA}}w(\boldsymbol{x},t)^{2}\,\text{d}\unicode[STIX]{x1D6FA}}$
, where
 $\unicode[STIX]{x1D6FA}$
represents the simulation domain and
 $\boldsymbol{x}$
the position vector. The growth rate
 $\unicode[STIX]{x1D714}_{z}$
is computed as the slope in a log–linear plot of the amplitude. Figures 4(a) and 4(b) show the obtained amplitude for Reynolds numbers of 205 and 225, respectively in the
 $SC$
and the
 $CC$
simulations. The amplitude is non-dimensionalized by its value at the first domain flow through time. Interestingly, the growth of the instability amplitude becomes saturated once the spanwise vortices are shed downstream of the cylinder; see the asterisk dots in figure 4. This agrees with the observation of Agbaglah & Mavriplis (Reference Agbaglah and Mavriplis2017) that the spanwise perturbation in the cylinder wake occurs before the onset of the streamwise vortex separation. The computed growth rates for
 $Re=205$
are
 $\unicode[STIX]{x1D714}_{z}=0.138$
and 0.15 for the
 $SC$
and the
 $CC$
, respectively, and
 $\unicode[STIX]{x1D714}_{z}=0.15$
and 0.165 for
 $Re=225$
. The growth rates for the
 $CC$
are a little larger than those of the
 $SC$
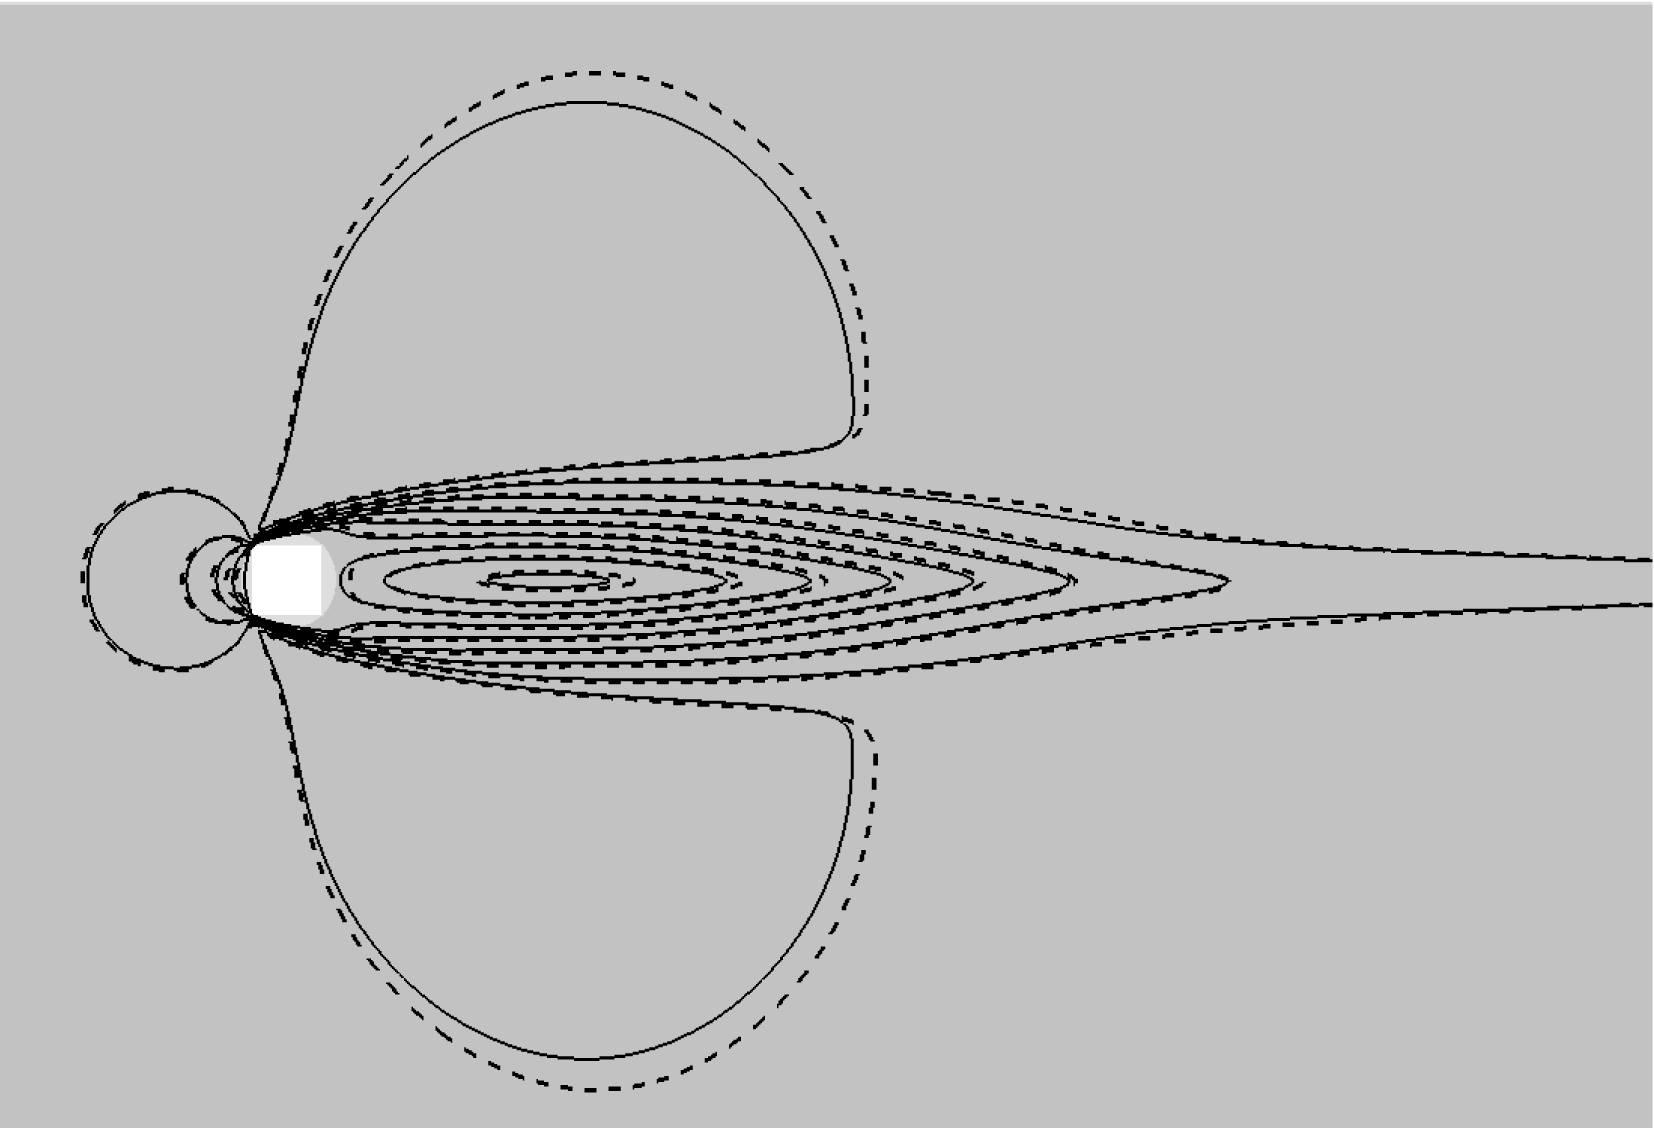
but only with percentage differences of less than 10 %. Figure 5 shows a good agreement, through a superposition of the averaged streamwise velocity contours for the
 $CC$
and the
 $SC$
, plotted in the middle plane of the cylinders.
Amplitude of the spanwise perturbation as a function of non-dimensional time in flow past the square (blue line) and the circular (red line) cylinder for
 $Re=205$
(a) and for
 $Re=225$
(b); for the circular cylinder these correspond to
 $Re^{\prime }=289.9$
and
 $Re^{\prime }=318.2$
, respectively. The amplitude is non-dimensionalized by its value at the first domain flow through time. The dashed lines represent fits with exponential functions while asterisk dots represent the onset time of the vortex shedding.

Superposition of the early-time averaged streamwise velocity contours at half the span length for the flow past the square cylinder for
 $Re=205$
(solid lines) and the circular cylinder (circumscribed to the square) for
 $Re^{\prime }=289.9$
(dashed lines). For both cylinders, 10 different contours are plotted with levels between
 $-$
0.5 and 1.3.

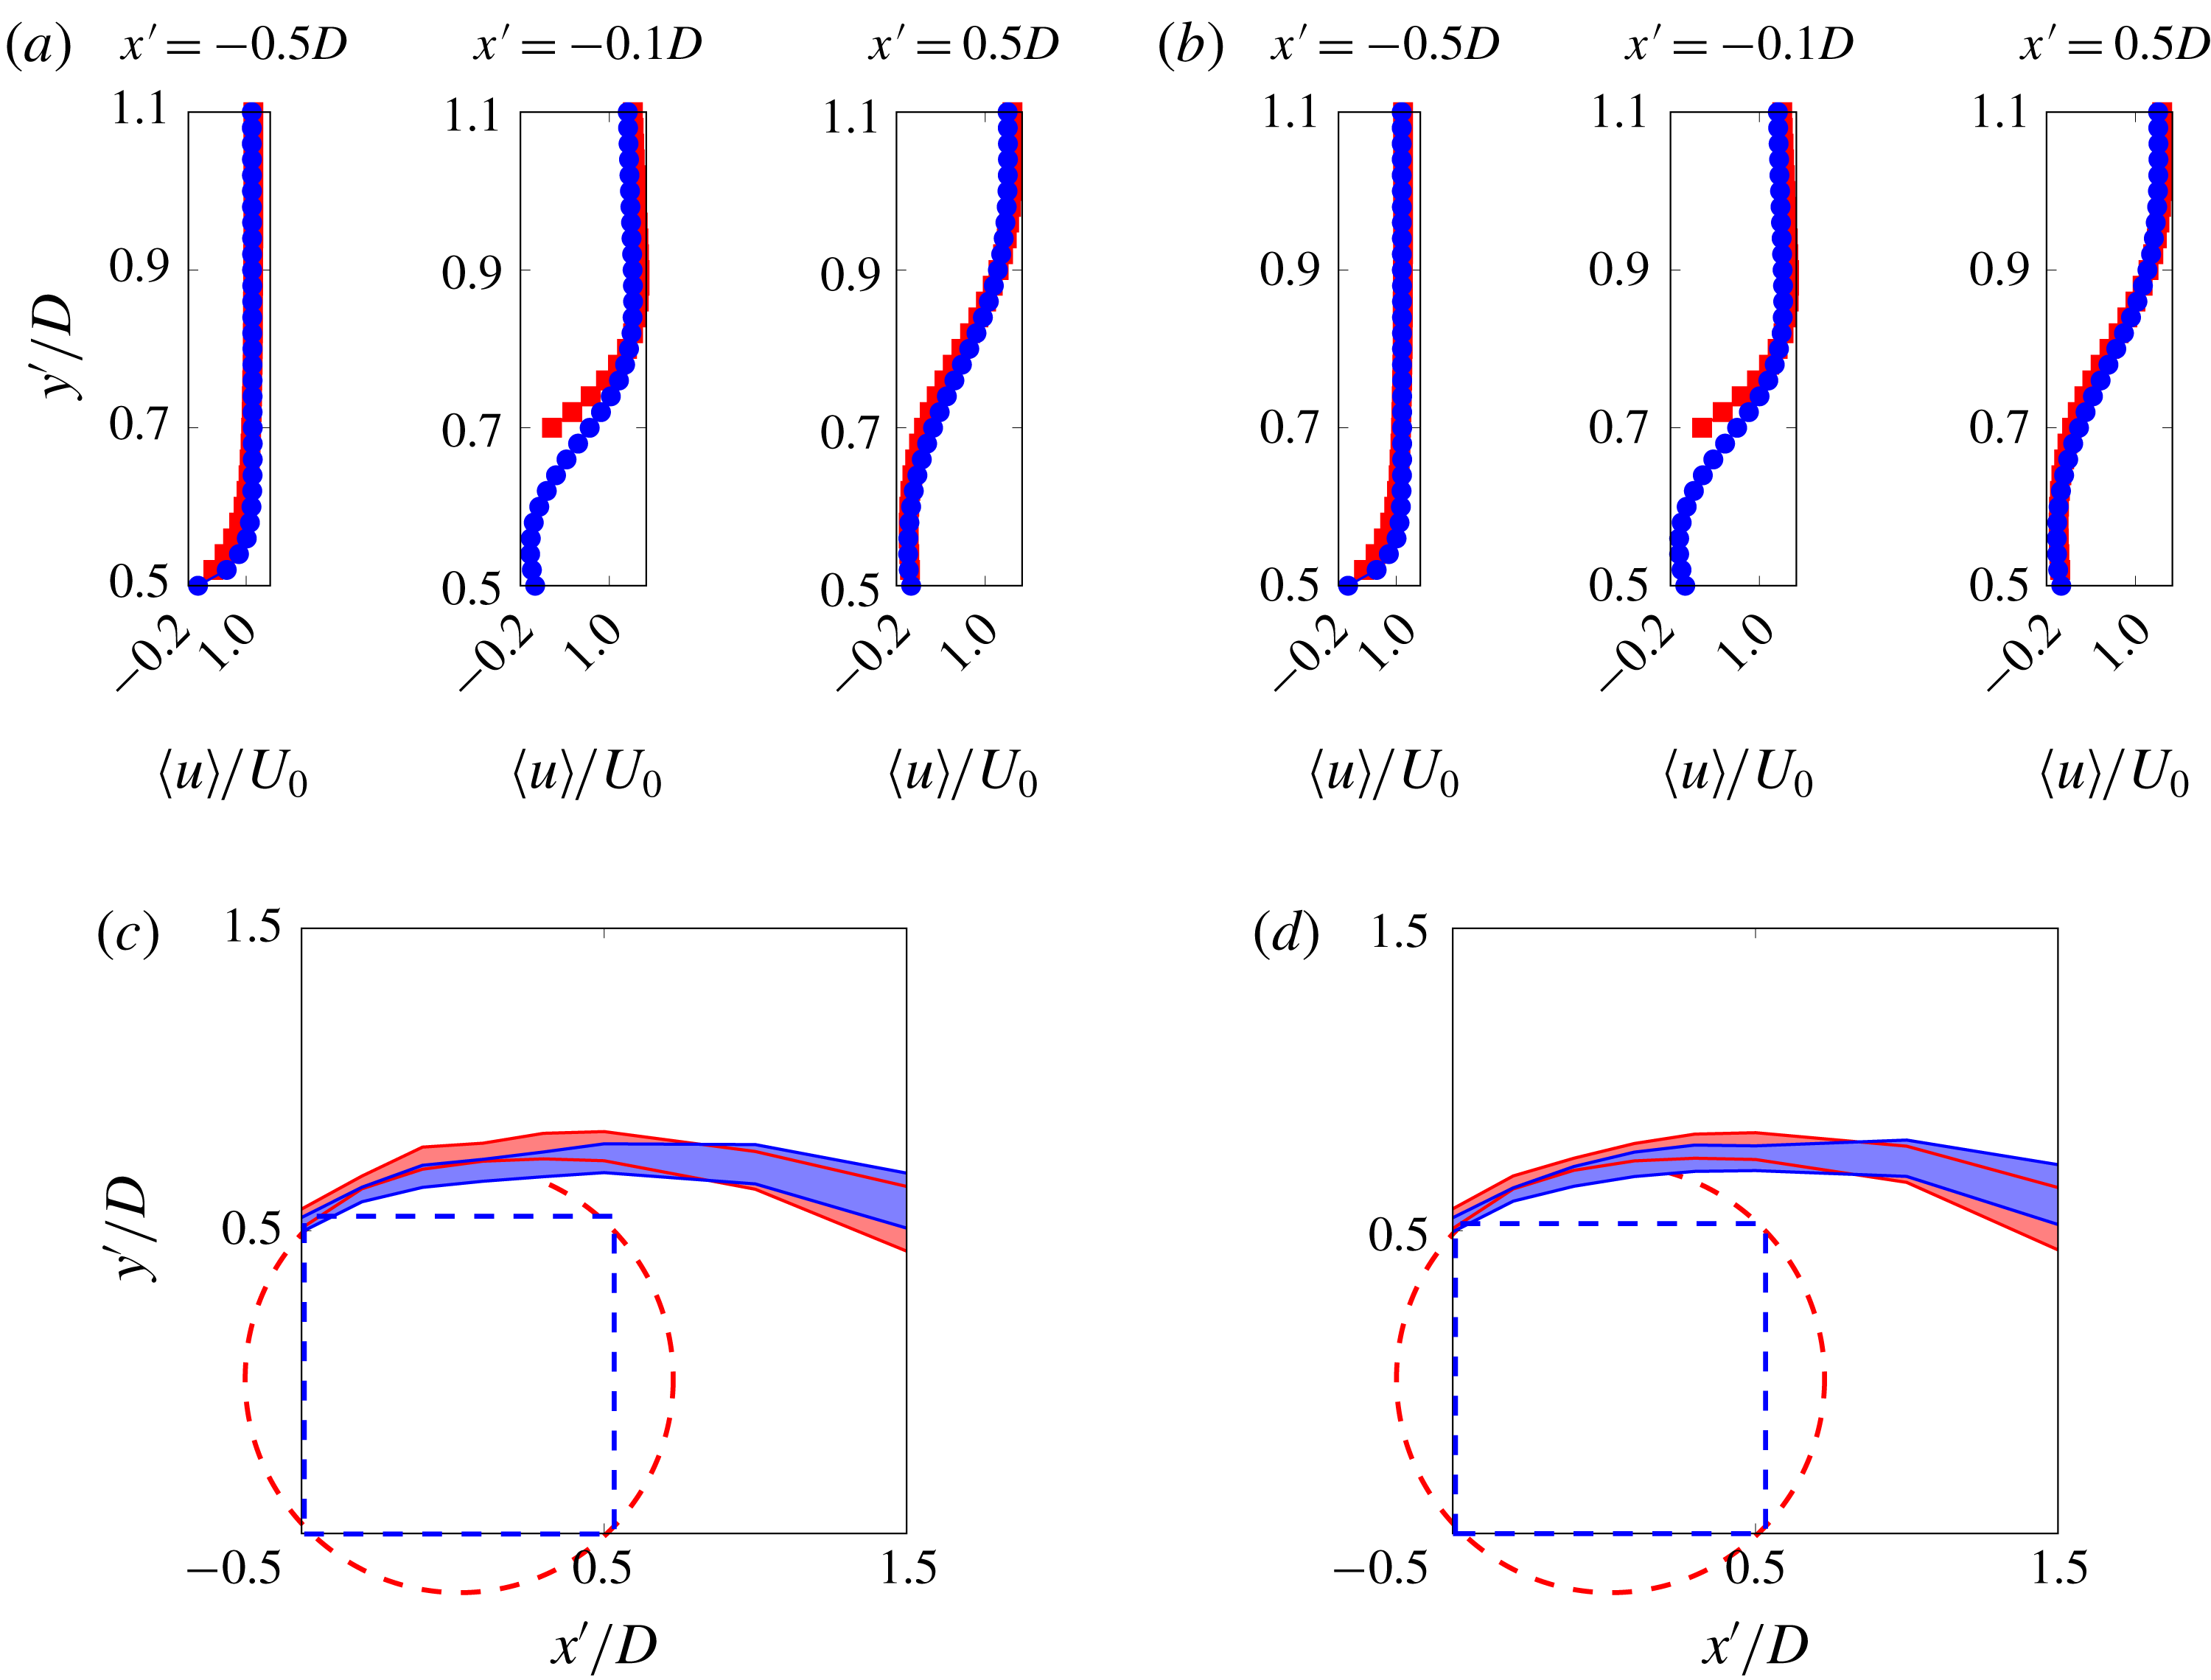
Comparison of long-time-averaged streamwise velocity profiles on the upper part of the side wall boundary of the square (blue ○) and circular (red ▫) cylinders for
 $Re=205$
(a) and
 $Re=225$
(b); for the circular cylinder these correspond to
 $Re^{\prime }=289.9$
and
 $Re^{\prime }=318.2$
, respectively. The average is calculated both in time and spanwise direction. The loci of the mean mixing layer are shown in (c) and (d) for
 $Re=205$
and
 $Re=225$
, respectively;
 $x^{\prime }$
and
 $y^{\prime }$
are the streamwise and the cross-streamwise coordinates, respectively, centred at the middle of the cylinder.

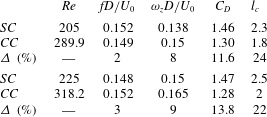
Comparison of shedding frequencies
 $fD/U_{0}$
, growth rates of the wake three-dimensional instability
 $\unicode[STIX]{x1D714}_{z}D/U_{0}$
, mean drag coefficients
 $C_{D}$
and mean recirculation region lengths
 $l_{c}$
obtained in present simulations of flow past the square cylinder (
 $SC$
) and the circumscribed circular cylinder (
 $CC$
). Percentage differences
 $\unicode[STIX]{x1D6E5}$
(%) are also added for comparison.

4 Wake dynamics in the periodic vortex shedding regime
The integral flow parameters such as lift and drag coefficients and the Strouhal number, the recirculation region length, the average velocity profiles and vortical structures in the wakes of the
 $SC$
and the
 $CC$
are compared in this section to examine the long-time dynamics. The Strouhal number for the flow past the
 $SC$
at
 $Re=205$
in table 1 (
 $St=0.152$
) agrees very well with
 $St=0.1523$
obtained in Robichaux et al. (Reference Robichaux, Balachandar and Vanka1999) (see their most refined curve in their figure 8) and
 $St=0.159$
obtained in the experiments of Luo et al. (Reference Luo, Tong and Khoo2007) for the
 $0^{\circ }$
end-plate inclination. Time averages here are computed for 30 shedding periods starting from
 $tU_{0}/D=200$
, after the streamwise vortex shedding has occurred. Figure 6 shows the average
 $u$
-velocity profiles and the loci of the mean mixing layer, defined in § 3, on the upper part of the side wall boundary and downstream of the
 $SC$
and the
 $CC$
. Here, even though the difference in the maxima of the velocity profiles is small, the upward shift of the mean mixing region in the side wall of the
 $CC$
is more pronounced than in the early-time dynamics of § 3. The mean mixing layer is tilted down further due to the recirculation region formed downstream of the cylinder. The contour of 0 average
 $u$
-velocity encloses the recirculation region, and the mean recirculation region length
 $l_{c}$
, normalized with
 $D$
for both cylinders, is defined from the cylinder centre to the farthest position of
 $\langle u\rangle _{t}=0$
. Figures 7 and 8 show the contour of 0 average
 $u$
-velocity and the norms of the average streamwise velocity field in the middle plane of the cylinder for Reynolds numbers of 205 and 225, respectively. As shown in figures 7(a) and 7(b), for
 $Re=205$
,
 $l_{c}=2.3$
and 1.8 for the
 $SC$
and the
 $CC$
, respectively. For
 $Re=225$
,
 $l_{c}=2.5$
and 2 for the
 $SC$
and the
 $CC$
, respectively, as depicted in figure 8(a,b). For both Reynolds numbers, the recirculation region length is significantly larger for the
 $SC$
simulations. This explains why the downstream portion of the mean mixing region is less tilted downwards for the
 $SC$
as observed in figure 6. The drag and the lift coefficients are shown in figure 9 as a function of time in the vortex shedding regime. The time-averaged drag coefficients for the long-time dynamics are calculated and reported in table 1 for the square and circular cylinders. For the
 $CC$
, the average drag coefficients decrease with the increasing
 $Re$
numbers as observed in previous three-dimensional computations by Henderson (Reference Henderson1997) and the obtained values are close to those reported on the figure 4 in Sheard, Hourigan & Thompson (Reference Sheard, Hourigan and Thompson2005), where an average drag coefficient of approximately 1.3 is reported for
 $Re^{\prime }=300$
. For the
 $SC$
the average drag coefficients increase a little with
 $Re$
numbers, with values close to the obtained drag coefficient of 1.41 at
 $Re=200$
by Sohankar, Norberg & Davidson (Reference Sohankar, Norberg and Davidson1999). Apart from the regular vortex shedding frequency, the time histories of drag and lift coefficients in figure 9 exhibit a quasi-periodic low-frequency modulation with a repetition period of approximately 60–100 time units. This was also observed in previous studies, see for instance Sohankar et al. (Reference Sohankar, Norberg and Davidson1999). Vortical structures in the wake are plotted in figure 10 where iso-contours of streamwise vorticity are shown for the
 $SC$
and the
 $CC$
. For
 $Re=205$
, the tongue-shaped vortex structure with a long spanwise wavelength, characteristic of a mode A instability (Barkley & Henderson Reference Barkley and Henderson1996), is observed in figures 10(a) and 10(b) for the
 $SC$
and the
 $CC$
, respectively. A rib-like vortex structure with a smaller wavelength, characteristic of the mode
 $B$
regime, is depicted in figure 10(c,d) for
 $Re=225$
. It is notable in figure 10 that the visible iso-contours of streamwise vorticity, for the mode
 $A$
instability, extend farther downstream for the
 $CC$
(figure 10
b) than for the
 $SC$
(figure 10
a). Also, the arcing form of vortical structures of the mode B instability is more pronounced in the
 $CC$
wake (figure 10
d) than in the wake of the
 $SC$
(figure 10
c). These differences are thought to be related to the long-time nonlinear effects of the cylinder’s shapes on the dynamics.
Time-averaged streamwise velocity field and contour of 0 average
 $u$
-velocity (blue line), in the middle plane of the cylinder, showing the mean recirculation region length
 $l_{c}=2.3$
for the square cylinder (a) at
 $Re=205$
and
 $l_{c}=1.8$
for the circular cylinder (b) at
 $Re^{\prime }=289.9$
.

Time-averaged streamwise velocity field and contour of 0 average
 $u$
-velocity (blue line), in the middle plane of the cylinder, showing the mean recirculation region length
 $l_{c}=2.5$
for the square cylinder (a) at
 $Re=225$
and
 $l_{c}=2$
for the circular cylinder (b) at
 $Re^{\prime }=318.2$
.

Drag coefficients as a function of time for
 $Re=205$
(a) and
 $Re=225$
(b) and lift coefficient as a function of time for
 $Re=205$
(c) and
 $Re=225$
(d). The blue line corresponds to the square cylinder while the red line corresponds to the circular cylinder at
 $Re^{\prime }=289.9$
in (a,c), and
 $Re=318.2$
in (b,d).

Iso-contours of positive (yellow) and negative (blue) vorticity in the wake of the square cylinder for
 $Re=205$
(a) and
 $Re=225$
(c), and the circular cylinder for
 $Re^{\prime }=289.9$
(b) and
 $Re^{\prime }=318.2$
(d). (a) and (b) Show the tongue-shaped vortical structures of the mode
 $A$
instability while (c) and (d) show the rib-like vortical structures of the mode
 $B$
instability. Iso-contours of the velocity magnitude are also displayed in transparent grey colours.

A summary comparison of the integral flow parameters and their percentage differences (
 $\unicode[STIX]{x1D6E5}~(\%)=(|P_{SC}-P_{CC}|/0.5(P_{SC}+P_{CC}))\times 100$
, where
 $P$
represents the considered parameter) for the flows past the
 $SC$
and the
 $CC$
is presented in table 1. One can notice that by using the circumscribed circle to the square, the obtained shedding frequencies and the growth rates of the three-dimensional instability of the wake are very close for the considered Reynolds numbers, while the drag coefficients are larger for the square cylinder and the amplitude of the lift coefficients is larger for the circular cylinder.
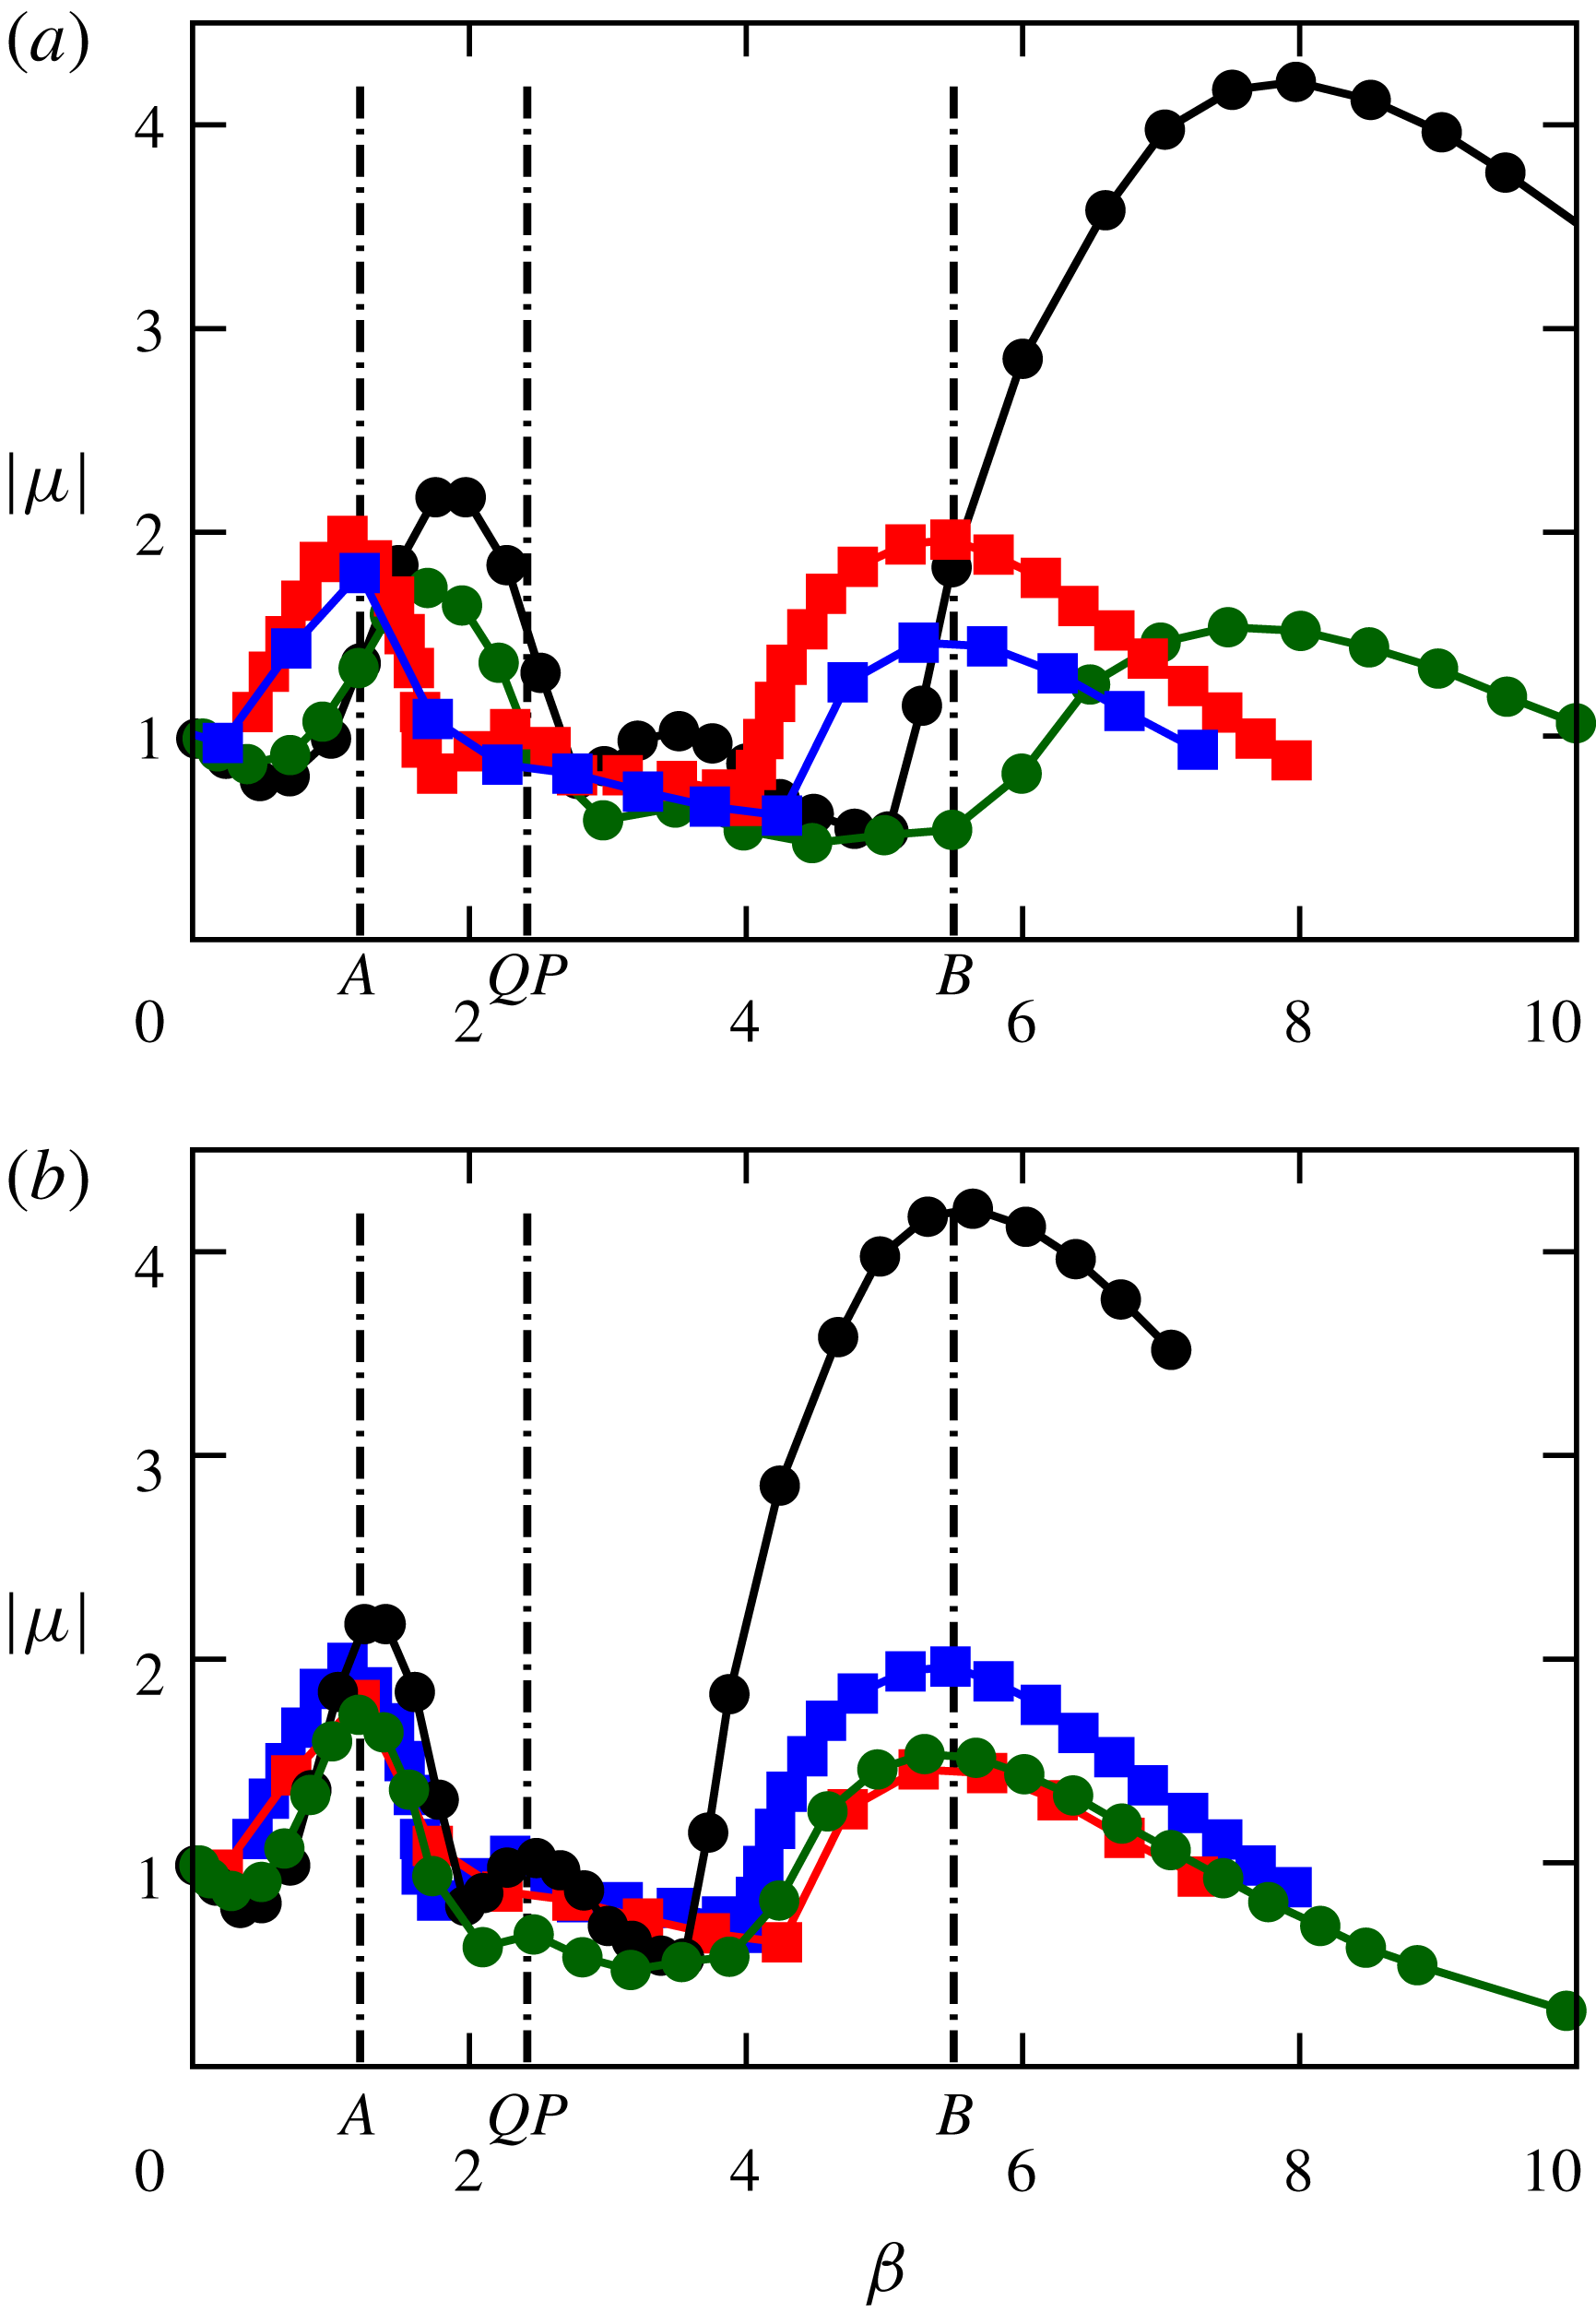
As no upstream perturbation is imposed at the inlet in the present study, only the fastest growing mode can be observed. It is therefore interesting to see how modes with different wavenumbers compare when using the circumscribed circle to the square. Figure 11 shows Floquet multipliers:
 $|\unicode[STIX]{x1D707}|=|\text{exp}(\unicode[STIX]{x1D714}_{z}/f)|$
as a function of the dimensionless spanwise wavenumber
 $\unicode[STIX]{x1D6FD}$
. Four previous results are reported: Floquet stability analysis of flow past a
 $SC$
for
 $Re=205$
by Robichaux et al. (Reference Robichaux, Balachandar and Vanka1999) and by Sheard et al. (Reference Sheard, Fitzgerald and Ryan2009) and results for flow past a
 $CC$
for
 $Re=280$
by Barkley & Henderson (Reference Barkley and Henderson1996) and
 $Re=380$
by Blackburn et al. (Reference Blackburn, Marques and Lopez2005). In addition, Floquet stability analysis of flow past a
 $CC$
(Barkley & Henderson Reference Barkley and Henderson1996; Blackburn et al.
Reference Blackburn, Marques and Lopez2005) has been modified by shifting the
 $x$
-axis, considering that the diameter
 $D^{\prime }$
in their dimensionless spanwise wavenumber calculations corresponds to the diameter of the circumscribed circle of the
 $SC$
that we compare to. This implies that
 $D^{\prime }=\sqrt{2}D$
where
 $D$
is the diameter of the
 $SC$
. The obtained new dimensionless wavenumber is
 $\unicode[STIX]{x1D6FD}=\unicode[STIX]{x1D6FD}_{CC}/\sqrt{2}$
. Figure 11(b) shows a good agreement of the most unstable wavenumbers when the new scaling is used for the
 $CC$
results. Peaks of the high-wavenumber mode, in the case of the
 $SC$
, are achieved at
 $\unicode[STIX]{x1D6FD}=1.2,5.5$
and 2.4 for instability modes
 $A,B$
and
 $QP$
, respectively (Sheard et al.
Reference Sheard, Fitzgerald and Ryan2009). These values are plotted by vertical dashed lines in figure 11 and match very well with peaks of the high-wavenumber mode for the
 $CC$
when wavenumbers are rescaled (see figure 11
b). Thus, it appears that the main issue in the discrepancy of the most unstable wavenumbers of three-dimensional instabilities for flow past a
 $SC$
and a
 $CC$
is related to the scaling used.
In the case of the wakes of non-circular cylinders at non-reflection-symmetric inclinations to the flow, as for a flow past a square cylinder with small incidence angles (e.g. Sheard Reference Sheard2011) and cylinders with triangular cross-sections (e.g. Ng, Vo & Sheard Reference Ng, Vo and Sheard2018), it is shown that for increasing incidence angle, the dominant spanwise wavelengths (or alternatively the dominant wavenumbers) remain almost constant, for the former, when normalized with the side length of the square cylinder and vary only slightly, for the latter, when the projected height of the triangular cylinder (with a small inclination angle
 $\unicode[STIX]{x1D6FC}<20$
) is used. For larger incidence angles, other corners of the cylinder may affect the effective width ‘seen’ by the mean upstream flow and consequently could introduce a discrepancy in the comparison of the dominant spanwise wavelengths.
Floquet multiplier magnitude
 $|\unicode[STIX]{x1D707}|$
as a function of the spanwise wavenumber
 $\unicode[STIX]{x1D6FD}$
. (a) Comparison of results from the flow past a square cylinder at
 $Re=205$
obtained by Robichaux et al. (Reference Robichaux, Balachandar and Vanka1999) (red filled ▫) and by Sheard et al. (Reference Sheard, Fitzgerald and Ryan2009) (blue filled ▫) and results from the flow past a circular cylinder obtained at
 $Re^{\prime }=280$
by Barkley & Henderson (Reference Barkley and Henderson1996) (green filled ○) and at
 $Re=380$
by Blackburn et al. (Reference Blackburn, Marques and Lopez2005) (black filled ○). (b) Same data as in (a) plotted with a rescaled dimensionless wavenumber
 $\unicode[STIX]{x1D6FD}=\unicode[STIX]{x1D6FD}_{CC}/\sqrt{2}$
for the circular cylinder. The vertical dashed lines correspond to the peaks of the high-wavenumber mode for instability modes
 $A,B$
and
 $QP$
(Sheard et al.
Reference Sheard, Fitzgerald and Ryan2009).

5 Conclusion
We performed Navier–Stokes numerical simulations of the flow past a square cylinder for Reynolds numbers
 $Re=205$
, 225, and the square’s circumscribed circular cylinder corresponding to Reynolds numbers
 $Re^{\prime }=289.9$
, 318.2. The flow separation and the recirculation regions on the top/bottom of the square cylinder have the effect of increasing its effective width, making it comparable with the diameter of the circumscribed circular cylinder. Therefore, the circumscribed circular cylinder is considered as the basis for a characteristic length scale in the comparisons of the flow past both cylinders. Early-time dynamics of the wake is investigated through instantaneous and averaged velocities and mixing layers in the vicinity of the cylinders prior to the streamwise vortex shedding. The time period considered is larger than 10 periods of the subsequent vortex shedding, starting from the first domain flow through time. A self-similar behaviour is observed for the streamwise velocity in the near wake and the loci and the thickness of the mean mixing layer and averaged velocities are approximately equal in the side wall and downstream of the square and circular cylinders, showing that the difference in the shape of the cylinders has no significant effect on the mean downstream dynamics for the considered
 $Re$
numbers. The amplitude of the three-dimensional instability grows exponentially and reaches a saturation state before the streamwise vortex shedding occurs in the wake of the square and circular cylinders for the considered Reynolds numbers. Vortical structures corresponding to unstable modes
 $A$
and
 $B$
are observed at long times in the wakes of both cylinders. The obtained vortex shedding frequencies are very close for the two cylinders. The drag coefficients are larger for the square cylinder while the amplitude of the lift coefficients is larger for the circular cylinder. The mean recirculation region length in the wake is larger for the flow past the square cylinder. However, these differences of the long-time wake dynamics do not affect the three-dimensional instability mode selection since the exponential growth of the instability reaches a saturation state before the occurrence of the downstream vortex shedding. By rescaling previous results of Floquet stability analyses, taking into account the diameter of the circumscribed circular cylinder, the peak of the high-wavenumber mode is achieved at approximately the same wavenumber for both cylinders and for each of the unstable modes
 $A,B$
and
 $QP$
. It is therefore interesting to compare the wake of a square cylinder to that of the square’s corresponding circumscribed circular cylinder instead of previous Reynolds number by Reynolds number comparisons as the former offers very close wake dynamics and instability behaviours.
Acknowledgements
The authors thank the Natural Sciences and Engineering Research Council of Canada and the University of Ottawa for financial support and Compute Canada and SciNet for computational support.