I. INTRODUCTION
In light water reactors (LWR), zirconium-alloy (Zr-alloy) fuel claddings have been widely used for over four decades due to the excellent neutron transparency of Zr, and combination of corrosion resistance and mechanical properties in normal operating conditions. Reference Sabol, Comstock, Weiner, Larouere and Stanutz1 However, in high temperature environments (1000 °C or higher) as may be the case during accident scenarios, significant degradation of the Zr-alloy cladding occurs. Profuse exothermic oxidation occurs (with associated hydrogen production) leading to a loss in mechanical integrity of the cladding. Furthermore, zirconium-oxide undergoes phase transformations as the temperature rises, which promotes its spallation and exacerbates cladding degradation. Reference Pint, Terrani, Brady, Cheng and Keiser2–Reference Baek and Jeong5 Efforts to address this challenge have been aimed at replacing Zr-alloy as cladding material with other materials such as FeCrAl alloys and SiC–SiC composites. Reference Pint, Terrani, Brady, Cheng and Keiser2,Reference Cheng, Keiser, Brady, Terrani and Pint6–Reference Yamamoto, Pint, Terrani, Field, Maloy and Gan9 Another approach involves deposition of oxidation-resistant coatings on Zr-alloy cladding. In this regard, chromium, Reference Idarraga-trujillo, Le flem, Brachet, Le Saux, Hamon and Muller10,Reference Kim, Kim, Jung, Park, Park and Koo11 Ti2AlC, Reference Maier, Garcia-Diaz, Hauch, Olson, Sindelar and Sridharan12 and TiN Reference Sung, Kim and Kim13 coatings have been investigated.
It is well known that transition metal-silicides have outstanding oxidation resistance and structural properties at high temperatures. For example, MoSi2 has been extensively studied on account of its outstanding oxidation resistance. Reference Mitra14 However, this material has been reported to suffer from accelerated pest oxidation at low temperatures resulting in a porous and nonprotective oxide scale. Reference Sharif15,Reference Knittel, Mathieu and Vilasi16 ZrSi2 has been studied to a much lesser extent, but appears to be a more appropriate candidate for a coating for the nuclear fuel cladding application from the standpoints of neutronics and greater compatibility with the underlying Zr-alloy substrate due to its oxophilic nature which is expected to result in better bonding to the native oxide film on the Zr-alloy. Moreover, ZrSi2 has high Young's modulus (∼200 GPa) and high compressive yield strength at high temperatures (∼200 MPa at 1000 °C). Reference Rosenkranz and Frommeyer17 However, there have been only limited studies on the evaluation of oxidation behavior of ZrSi2 at high temperatures. It has been reported that oxidation of ZrSi2 in dry oxygen and steam does not result in a continuous SiO2 layer, differing in this regard from other silicides (CoSi2, CrSi2, NiSi2, PtSi2, and TiSi2) regardless of oxidation temperature. Reference Strydom, Lombaard and Pretorius18 The long term isothermal oxidation (600–1100 °C for 160 h) of aluminum alloyed (4 at.% addition) ZrSi2 showed high oxidation resistance with two oxidation stages above 700 °C: early stage (formation of ZrSiO4, ZrO2) and steady-state stage (formation of Al2O3). Reference Pérez, López, Jiménez and Adeva19,Reference Pérez20 Thermogravimetry and differential thermal analysis experiments of ZrSi2 powders up to 1450 °C suggest complex step reactions with combination of ZrO2, SiO2, and ZrSiO4 formation. Reference Geßwein, Pfrengle, Binder and Haußelt21 Nevertheless, the oxidation data of bulk ZrSi2 at high temperature are still limited.
In this study, the oxidation behavior of dense bulk forms of ZrSi2 in high temperature air (700, 1000, and 1200 °C) has been explored. A temperature of 700 °C was chosen to determine whether material degradation at low temperature occurs like MoSi2 while higher temperatures (1000 and 1200 °C) simulate a postulated loss of coolant accident scenario in LWR. Reference Gosset and Le Saux22 In addition, Zircaloy-4 (Zry-4) was also oxidized under similar conditions as a base-line for comparison with ZrSi2. All oxidized samples were rigorously characterized with the goal of understanding compositional and morphological evolution of microoxide and nanooxide structures.
II. EXPERIMENTAL
A. Materials
Commercially available dense ZrSi2 (American Elements Inc., Los Angeles, CA) with a reported purity of >99.5% and Zircaloy-4 plate (ATI Wah Chang, Albany, OR, referred to as Zr-4 henceforth) were procured for this study. The density of the dense ZrSi2 was about 95% of theoretical densities, Reference Murarka23 respectively. The phases in the as-received materials were confirmed by x-ray diffraction analysis (XRD), but few micron-sized Si particles were revealed in as-received ZrSi2 matrix as an impurity. All ZrSi2 samples were cut and ground into approximately 12.7 × 12.7 mm2, 6.4 mm thick square coupons, and Zr-4 coupons were 3.2 mm thick.
B. Air oxidation tests
All six faces on the samples were ground progressively with 320, 600, 800, and 1200 grit SiC papers and then ultrasonically cleaned with methanol and acetone. The dense ZrSi2 and the Zry-4 samples were exposed at 700, 1000, and 1200 °C in stagnant ambient air. The samples were removed each hour for weight change measurements (as an initial measure of the extent of oxidation) performed with Satorius microprecision balance (model#CPA26P) with 0.002 mg resolution. The fast cooling with ambient air was conducted because slow cooling may not be able to preserve microstructures that evolved at high temperatures and to minimize this possibility of any changes during cooling.
C. Characterization
Surface morphology and evolution of oxide structures in cross-section were characterized by Zeiss LEO Scanning Electron Microscope (SEM; Carl Zeiss AG, Oberkochen, Germany) integrated with Energy Dispersive Analysis System (EDS). XRD (Bruker Corporation, Billerica, Massachusetts) with Cu Kα radiation was performed to identify oxide product phases and the very near-surface composition was evaluated by Thermo-Scientific Kα x-ray Photoemission Spectroscopy (XPS; Thermo Fisher Scientific, Waltham, Massachusetts). To identify oxidized structures at high magnification and resolutions, thin foils of the sample surface were lifted out by a Zeiss Auriga Focus Ion Beam (FIB; Carl Zeiss AG) milling and imaged with a Tecnai 12 Transmission Electron Microscope (TEM; FEI Company, Hillsboro, Oregon) and Titan Scanning TEM in conjunction with EDS (STEM-EDS; FEI Company).
III. EXPERIMENTAL RESULTS
A. Oxidation kinetics and oxidation products
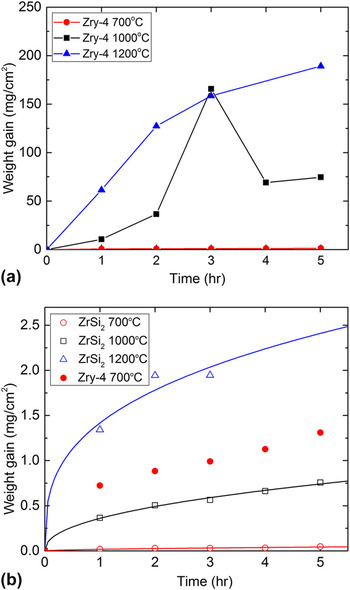
The kinetics of oxidation of the dense ZrSi2 was determined by weight change measurements at each hour during oxidation. The weight gain values (per unit area of the sample) of Zry-4 and dense ZrSi2 are shown in Fig. 1. As may be noted, the weight gain of the dense ZrSi2 is negligible compared to that of the Zry-4 at the high temperatures. The Zry-4 showed the formation of a thick oxide scale and its spallation led to weight reduction at 1000 °C (4 h) and 1200 °C (3 h) as shown in Fig. 1(a). On the other hand, the dense ZrSi2 appeared to be stable without significant degradation at the high temperatures. It is worth noting that no pest oxidation was observed on the surface of the ZrSi2 samples. Minor chipping on the edge of the dense ZrSi2 samples was observed at 1200 °C after 3 h oxidation. Therefore, the weight gain values at 5 h have not been reported in Fig. 2(b). The general oxidation kinetics follows a power law. The oxidation kinetics at 700 and 1000 °C follow approximately a parabolic rate law while at 1200 °C follows more closely the cubic growth rate law. More protective nature with increasing temperatures has been reported in MoSi2 and TiSi2 as well, resulting from denser SiO2 formation. Reference Sharif15,Reference Becker, Rahmel and Schutze24,Reference Liu, Shao and Tsakiropoulos25 The weight gain relationships are empirical and were plotted with the limited data points so that it is difficult to elucidate physical and chemical processes of the oxide growth. Nevertheless, the weight gain trends imply that the ZrSi2 oxidation process is controlled by the diffusion of charged species (e.g., Si4+, O2−) through the oxide dictating the oxide growth rate. Reference Khanna26
Weight gain versus time for (a) Zry-4 and (b) dense ZrSi2 samples constructed with least square fits at 700, 1000, and 1200 °C in air.

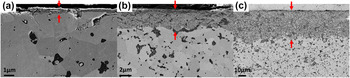
Cross-sectional SEM images of the dense ZrSi2 at (a) 700 °C, (b) 1000 °C, and (c) 1200 °C for 5 h exposure in air. The red arrows indicate the oxide layer between a mounting resin and unreacted ZrSi2.

The oxide layer thickness was measured in SEM cross-sectional images and shown in Fig. 2. The average oxide layer thickness of the dense ZrSi2 at 700 °C, 1000 °C, and 1200 °C for 5 h oxidation was determined to 470 nm, 6.7 µm, and 37 µm, respectively. In addition, the oxide layer thickness at 1000 °C for 15 h oxidation was 12 µm, which considered together with other exposure times at this temperature is indicative of parabolic oxidation kinetics at 1000 °C. Furthermore, no spallation and delamination of the oxide layer were observed and only minor cracks were identified in unreacted ZrSi2 matrix underneath the oxide scale at 1200 °C possibly due to thermal cycling due to periodic removal of samples from the furnace.
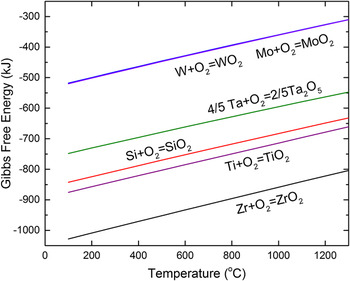
Although thickness of the ZrSi2 oxide layer formed at high temperatures is significantly lower than that formed on Zr-4, the oxide scale is much thicker than for TaSi2, MoSi2, and WSi2 in the similar oxidation tests (1000 °C air) reported in literature. Reference Lafatzis and Mergia27,Reference Lie, Tiller and Saraswat28 One of possible reason for this is the thermodynamically favored ZrO2 formation in ZrSi2 oxidation. Fig. 3 shows Gibbs free energy formation of oxide per a mole of O2 of Si as well as Ta, Ti, Mo, W, and Zr, which was calculated by HSC Chemistry thermodynamics software. In these other metal-silicides except for Ti, selective oxidation of Si leads to the formation of a continuous oxidation resistant SiO2 layer Reference Berztiss, Cerchiara, Gulbransen, Pettit and Meier29 while the absence of continuous SiO2 layer in ZrSi2 may result in relatively faster oxide growth. Likewise, TiSi2 has at least five times higher oxidation rate compared to MoSi2. Reference Pérez20
Gibbs free energies of oxide formation for Zr, Ti, Si, Ta, W, and Mo per 1 mole O2, calculated by HSC Chemistry thermodynamics software.

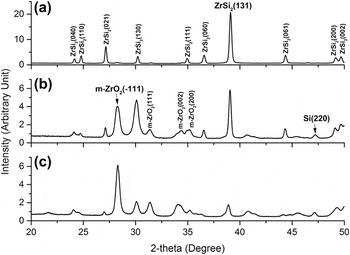
The phases present in the oxide layer formed at different temperatures for 5 h exposure were identified by full-theta XRD analysis and the results are shown in Fig. 4. At 700 °C oxidation [Fig. 4(a)], pronounced diffracted peaks stemming from unreacted ZrSi2 and weak Si and monoclinic ZrO2 (m-ZrO2) peaks were identified. At 1000 °C [Figs. 4(b)] and 1200 °C [Fig. 4(c)] oxidation, intensity of m-ZrO2 was remarkably increased and weak Si peaks were also seen. Grazing incidence XRD scan (2° incident beam angle) showed the same results. For higher temperatures, the intensity of the strongest m-ZrO2 peak at 28° (−111) gets sharper but the ZrSi2 strongest peak at 39° (131) gets weaker and broader, which corresponds to thicker ZrO2 oxide layer at higher temperature. In addition, absence of peaks of thermodynamically favored SiO2 and zircon (ZrSiO4) phases observed in Zr–Si–O system does not preclude their presence, since they may be present as amorphous phases. During the selective oxidation of Zr in ZrSi2, some Si may be newly formed as an intermediate product which represents the weak silicon peak at 47° (220). Geßwein et al. Reference Geßwein, Pfrengle, Binder and Haußelt21 postulated selective oxidation producing SiO2 and Si at low temperature [as shown in Eq. (1)] from thermogravimetric experiments of ZrSi2 powders oxidation in air.
 $${\rm{ZrS}}{{\rm{i}}_2} + {{\rm{O}}_2} \to {\rm{Zr}}{{\rm{O}}_2} + \left( {2 - y} \right){\rm{Si}}{{\rm{O}}_x} + y{\rm{Si}}\;\left( {500\;^\circ {\rm{C}} \lt T \lt 800\;^\circ {\rm{C}}} \right)$$
XRD patterns of the ZrSi2 oxidized at (a) 700 °C, (b) 1000 °C, and (c) 1200 °C for 5 h showing monoclinic zirconia, silicon, and unreacted ZrSi2 peaks.

Additionally, it is not surprising that tetragonal-zirconia phase which is stable above 1000 °C based on Zr–O binary phase diagram Reference Urbanic and Heidrick30 is not observed in Fig. 4. This is because our XRD analysis was conducted at room temperature so that most tetragonal zirconia transformed to monoclinic zirconia during cooling. Reference Gosset and Le Saux22
B. Microstructural evolution oxide layer in the oxidized ZrSi2
Given that both Zr and Si have very negative Gibbs free energy of oxide formation of each oxide and possible selective and nonselective oxidations of Zr in ZrSi2 creates the potential to produce complex multilayered structure, which may be beneficial for protection of Zr-alloy fuel cladding under accident conditions.
1. Surface morphology evolution
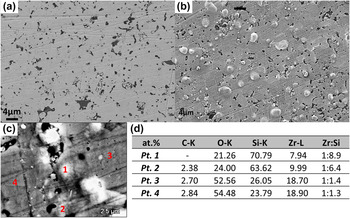
To investigate the compositional and morphological evolution of the oxide layer at high temperatures, plan-view SEM-EDS examinations were first performed for samples exposed to each of the temperatures for 5 h. Figure 5(a) shows SEM image of the surface of the as-received ZrSi2 and Fig. 5(b) shows surface of ZrSi2 sample that was subject to oxidation at 700 °C for 5 h. Figures 5(c) and 5(d) show results of EDS analysis of the oxide layer. Micron-sized spherical phases were observed to evolve on the oxidized surface [Fig. 5(b)]. Semiquantitative EDS point scan confirmed that there were local variations in the concentration of Si, Zr, and O on the surface and the spherical phases were enriched in Si [i.e., point 1 and 2 in Fig. 5(c)]. This represents a significantly higher Si concentration than in the as-received ZrSi2 for which the Zr-to-Si ratio was 1:2.4 as determined by our XPS, to be discussed later. Therefore, the micron-scale spherical phases appear to be Si-rich oxides formed by Si diffusion from the surrounding area.
Plan-view of SEM images of (a) as-received ZrSi2, (b) ZrSi2 oxidized at 700 °C for 5 h, (c) high voltage SEM (12 kV) image of the oxidized sample, and (d) EDS compositions in regions indicated in (c). Points 1 and 2 indicate the regions of spherical phases shown in the image (b).

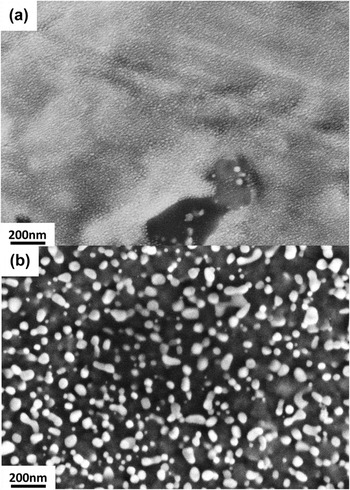
On surfaces oxidized at higher temperatures, the surface morphology was different as shown in Fig. 6 for samples oxidized at 1000 and 1200 °C. The Si-rich humps were not clearly identified but nanoscale precipitation of oxide phase particulates (40–100 nm in size) appeared, particularly, on the surface of samples oxidized at 1200 °C [Fig. 6(b)]. The imaging contrast between the background matrix and oxide particulates suggests differences in their compositions and TEM-EDS analysis determined that these nanosized particulates were ZrO2 as will be discussed later. At 1000 °C, the fine oxide particles also emerged on the surface but the size of structure was too small to be quantified in the SEM image.
Plan-view of high magnification SEM images of ZrSi2 oxidized at (a) 1000 °C for 15 h and (b) 1200 °C for 5 h.

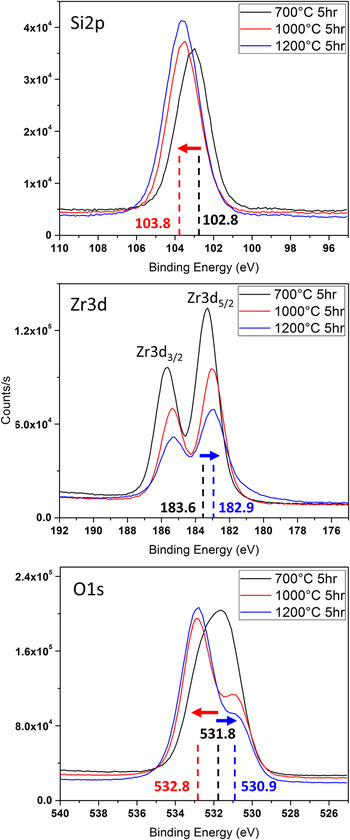
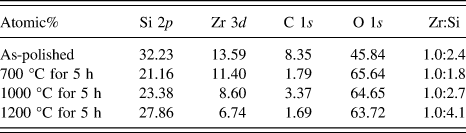
To understand the structural evolution at the surface during high temperature, XPS analysis was performed. The chemical states of Si, Zr, and O were acquired over a 400 µm diameter circular region on the surface of samples oxidized at each of the temperatures for 5 h and the results are shown in Fig. 7. The intensity of Si 2p binding energy peak increases with increasing oxidation temperature—the peak binding energy shifted +1 eV (102.8 eV → 103.8 eV) between samples oxidized at 700 °C and those oxidized at higher temperatures (1000 and 1200 °C). On the other hand, signal intensity of the Zr 3d 3/2 and Zr 3d 5/2 binding energies decreased with increasing oxidation temperature. Here, the peak values shifted −0.7 eV at 1000 °C compared to 700 °C (183.6 eV → 182.9 eV). The O 1s binding energy associated with the elements showed the same trends with respect to temperature. The intensity of O 1s binding energy associated with Zr atom decreased but that of Si atom increased with the binding energy shifts, indicating fundamental differences compositional shifts between 700 °C and 1000 °C/1200 °C exposures. Based on the reported XPS binding energies, Reference Naumkin, Kraut-Vass, Gaarenstroom and Powell31 the binding energy of Si 2p and Zr 3d at 1000 and 1200 °C corresponded to SiO2 and ZrO2 but those in 700 °C did not clearly match with the simple oxides. The shifts in x-ray photoelectron peaks are likely associated with a transition in binding states. Such shifts have been reported in a complex mixed oxide (i.e., ZrSiO4) in comparison to simple oxides (i.e., ZrO2 and SiO2) due to different covalency of cations. The Si 2p bonding is more covalent but the Zr 3d is more ionic in ZrSiO4. Reference Guittet, Crocombette and Gautier-Soyer32,Reference Dementjev33 Therefore, it is speculated that at 700 °C an amorphous Zr–Si–O phase forms, however, at 1000 and 1200 °C this phase is not stable but rather decomposes to distinct SiO2 and ZrO2 simple oxide phases. This is also in good agreement with phase conversion from amorphous ZrSiO4 film to simple oxides at 900 °C annealing (i.e., Si–O–Zr → O–Si–O + O–Zr–O) reported in a previous study. Reference Rayner, Therrien and Lucovsky34,Reference Lucovsky and Rayner35 Interestingly, oxidation product of TiSi2 at 600 °C in oxygen is glassy Ti–Si–O phase as well. Reference Schwettmann, Graff and Kolodney36 The near-surface chemical composition of oxidized surfaces as determined by the XPS technique is summarized in Table I. The variation of the concentration ratio of Zr to Si indicates that there was not only lateral diffusion of species shown in Figs. 5 and 6 but also depth-wise diffusion of species. The compositional ratio of Si to Zr was slightly reduced (less Si) at 700 °C but it increased again (more Si) at 1000 °C and gets doubled at 1200 °C compared to the as-received ZrSi2. Based on the published high diffusion rate of Si compared to Zr, Reference Tallman, Yang, Pan, Anasori and Barsoum37,Reference Roy and Paul38 it appears that a part of newly formed Si during oxidation diffused inward in the thin oxide layer so that the Si concentration on the surface is diminished during oxidation at 700 °C. However, a net outward flux of Si atoms at the higher temperatures increases the Si concentration on the outer-most surface.
XPS spectrum (Si 2p, Zr 3d, O 1s binding energy) of ZrSi2 oxidized at 700, 1000, and 1200 °C after 5 h oxidation. Position of the peak maximum (eV) is specified and the arrows indicate the trend of binding energy shift with increasing temperature (from 700 °C to 1000 °C/1200 °C). The red arrows and blue arrows are associated with silicon and zirconium, respectively.

XPS near-surface chemical compositional analysis of as-received and ZrSi2 oxidized at high temperatures.

2. Depth-wise structural evolution
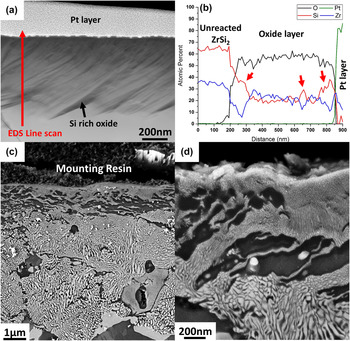
To correlate the observed surface chemical and morphological evolution with depth-wise species diffusion, cross-sectional analysis using high magnification STEM imaging was performed (Fig. 8). At 700 °C, 10 h oxidation was carried out to get thicker oxide layer and subsequent STEM analysis showed dark wavy structures [Fig. 8(a)] in the ∼630 nm thick oxide layer that formed. EDS line scan analysis showed the structures to be Si-rich oxide phase [Fig. 8(b)] and consequently a reduction of Si concentration was identified in the adjacent regions. Based on the STEM observation, the phase identification in XRD, and the binding energy shift in XPS, the major phases in the oxide layer at 700 °C are likely amorphous Zr–Si–O and Si-rich oxide. The cross-sectional images of samples oxidized at 1000 and 1200 °C showed complex nano/micron structures. Four types of structures were identified in the 7 µm oxide layer formed at 1000 °C [please see Figs. 8(c) and 8(d)]: (i) submicron layer with fine structural features, (ii) underlying wavy dark structures, (iii) a thick region consisting of irregular structures, and (iv) unreacted ZrSi2 region. It is speculated that the wavy structures developed by the inward diffusion of Si at the early stages of oxidation and the nondirectional irregular structures were formed by spinodal decomposition in the amorphous Zr–Si–O matrix, which will be discussed in detail.
(a) HAADF STEM cross-sectional image of ZrSi2 oxidized at 700 °C for 10 h and (b) corresponding EDS line-scan showing composition fluctuation even in the thin (∼630 nm) oxide layer. The red arrows indicate Si-rich oxide. (c) Cross-sectional SEM image with low voltage (3 kV) of the oxide layer on ZrSi2 formed at 1000 °C for 5 h at low magnification and (d) and high magnification near the top layer.

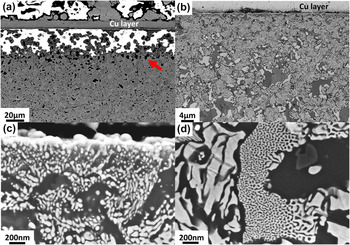
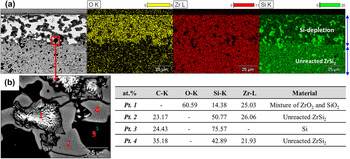
Similar evolution of the oxide structures was observed for samples oxidized at 1200 °C for 5 h. A large numbers of Si islands indicated by the red arrow in Fig. 9(a) were identified at the interface between the oxide layer and unreacted ZrSi2. In addition, charging effects were observed in Fig. 9(a), indicating a fully oxidized structure (bright regions) which has dielectric properties. However, some regions appeared not to be oxidized significantly and manifested as dark and gray areas shown in Fig. 9(b). The nanoscale spherical particulates, which was seen on the plan view image [Fig. 6(b)], were dispersed only in region adjacent to air interface [Fig. 9(c)]. The uniform irregular nanoscale structures are again observed in Fig. 9(d). The EDS analysis [Fig. 10(a)] showed that the less oxidized regions were composed of Si-rich oxide and unreacted ZrSi2. The origin of the Si-rich oxide is the slow reaction kinetics of SiO2 growth Reference Lafatzis and Mergia27 during oxidation of the newly formed Si and some ZrSi2 were not completely consumed while the oxide layer was developing. The irregular structures seem to consist of ZrO2 and SiO2 based on the EDS point scan [point 1 in Fig. 10(b)], corresponding to the Si-depleted regions in the EDS mapping. In addition, the existence of Si islands in the interface between the oxide scale and ZrSi2 suggests that the selective oxidation occurs at temperatures higher than those reported in temperature (<800 °C). Reference Geßwein, Pfrengle, Binder and Haußelt21 Due to relatively large SEM-EDS spot size (∼1 µm), TEM-EDS analysis was performed to understand mechanism of evolution of this compositionally alternating oxide structure.
SEM images of ZrSi2 oxidized at 1200 °C for 5 h, taken at (a) 12 kV and (b) 3 kV at low magnifications. High magnification 3 kV SEM images (c) at interface between air and oxide layer and (d) at the middle of oxide scale showing different shapes of nanoscale structures.

EDS spectra mapping (a) of the oxidized ZrSi2 at 1200 °C for 5 h showing Si depleted region, and point EDS analysis (b) at the interface between oxide layer and unreacted ZrSi2. The carbon signal is an artifact from the mounting resin.

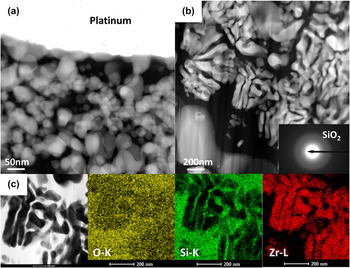
The irregular nanoscale structures and spherical phases observed in Figs. 9(c) and 9(d) were analyzed using STEM-EDS (Fig. 11). The high angle annular dark field (HAADF) STEM images of the ZrSi2 oxidized at 1200 °C for 5 h revealed nanoscale particulate phases [Fig. 11(a)] adjacent to the air interface and the irregular structures [Fig. 11(b)] uniformly dispersed in the entire oxide scale. Since brightness in HAADF images is proportional to atomic number of material, it is speculated that the structures were composed of higher atomic number elements compared to the background matrix material. STEM-EDS analysis confirmed the chemical composition of the structures as shown in Fig. 11(c). The spherical particulates and irregular structures were crystalline ZrO2 in SiO2 background matrix. The fuzzy ring diffraction pattern [inset, Fig. 11(b)] of the background matrix suggests that the SiO2 phase is amorphous, in agreement with the XRD result where no crystalline SiO2 peaks were identified.
HAADF STEM cross-sectional images of ZrSi2 oxidized at 1200 °C for 5 h. (a) nanoscale spherical phases at the interface with air (i.e., top surface) and (b) irregular structures uniformly dispersed in oxide scale. The inset shows SiO2 diffraction pattern indicating an amorphous structure. The platinum layer was deposited on the top of the sample during sample preparation by FIB. Higher atomic number material has brighter contrast in these images. (c) Bright field STEM image and STEM-EDS elemental mapping images of the irregular structures. These images clearly indicate that the irregular structures consist of ZrO2 and amorphous SiO2.

IV. DISCUSSION
A. Spinodal decomposition
As mentioned earlier, a plausible explanation to the formation of an alternating nanolayered structure of ZrO2 and SiO2 is phase separation of amorphous Zr–Si–O by spinodal decomposition, a diffusion driven process that occurs in unstable undercooled or supersaturated phases, resulting in homogenous two-phase fine scale mixture. Reference Laughlin and Soffa39 Lucovsky et al. Reference Rayner, Therrien and Lucovsky34,Reference Lucovsky and Rayner35 first reported that annealing of ∼400 nm amorphous ZrSiO4 thin film at 900 °C for 60 s led to chemical phase separation consisting of crystalline ZrO2 and amorphous SiO2 based on infrared absorption spectroscopy. A thermodynamic driving force exists if the solid mixture is within unstable spinodal boundary. Kim et al. Reference Kim and McIntyre40 estimated the excess Gibbs free energy of mixing in supercooled liquid of ZrO2 and SiO2 using a subregular model utilizing the invariant points in pseudo-binary ZrO2–SiO2 phase diagram. In addition, Stemmer et al. Reference Stemmer, Chen, Levi, Lysaght, Foran and Gisby41 predicted extension of the liquid miscibility gap and spinodals to lower temperature using commercially available thermodynamic software and published oxide data. Based on their estimations, the composition of spinodal boundary between 1000 and 1200 °C in ZrO2 and SiO2 mixture is in the range of 0.4–0.9 SiO2 mole fraction and its corresponding decomposed equilibrium phases are ZrO2 rich phase (0.2–0.4 SiO2 mole fraction) and SiO2 rich phase (0.9–0.98 SiO2 mole fraction). Therefore, it is suggested that there is a thermodynamic driving force that induces spinodal decomposition in ZrSi2 oxidation at high temperatures.
At 1000 °C, the spinodal structures near the top surface were finer than those at the center of the oxide layer, which may be attributed to ZrO2/SiO2 composition effect on Gibbs free energy of mixing. The minimum wave length of phase modulation decreases with increasing negativity of second derivative of Gibbs free energy of mixing. Reference Porter and Easterling42 The absolute value of the negative free energy is maximized at 73% mole fraction of SiO2 at 1000 °C calculated by the subregular model, Reference Stemmer, Chen, Levi, Lysaght, Foran and Gisby41 which is consistent with Si concentration of the 1000 °C surface, resulting in formation of the finer spinodal structures.
Additionally, nucleation of the ZrO2 particulates at 1200 °C on the top surface would also be explained by the extension of the liquid miscibility gap. Due to the highest concentration of SiO2 on the top surface by outward Si diffusion in oxide layer (see Table I) at 1200 °C, the composition may not be within the spinodal boundary but within miscibility gap. Therefore, nucleation and growth of ZrO2 in SiO2 matrix will likely lower its free energy in lieu of spinodal decomposition.
B. Kinetic suppression of crystalline ZrSiO4 formation
It is worth noting that crystalline ZrSiO4 was not identified in the ZrSi2 oxidation even though its formation is preferable in binary ZrO2–SiO2 phase diagram at the temperatures with any composition. Reference Butterman and Foster43 Most published experiments agree that ZrSiO4 formation from a reaction of ZrO2 and SiO2 requires at least 1300 °C annealing temperature. Reference Itoh44–Reference Kaiser, Lobert and Telle47 Formation of crystalline ZrSiO4 is a solid state reaction, hypothesized that Si4+ cations from amorphous SiO2 diffuses through the highly refractory ZrSiO4 layer and reacts with t-ZrO2 to produce new phase and there are no mobile species like in liquid or gas. Reference Veytizou, Quinson, Valfort and Thomas45 Therefore, the growth rate of crystalline ZrSiO4 is kinetically limited although thermodynamically favored. Crystalline ZrSiO4 formation is expected in ZrSi2 oxidation at higher temperature (e.g., 1300 °C or 1400 °C) or much longer time oxidation.
C. Summary of ZrSi2 oxidation
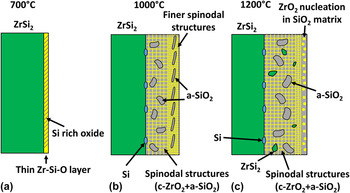
Based on the analysis in this study, a physical model for microstructural evolution during the isothermal oxidation at each test temperature is schematically shown in Fig. 12 in an attempt to develop a picture of microstructural evolution in the oxide layer. At 700 °C, a thin oxide layer consisting of Zr–Si–O amorphous phase matrix with Si-rich oxide wavy structures forms. Additionally, small amount of Si and ZrO2 was identified in XRD analysis. The role of the newly formed Si by the selective oxidation in the ZrSi2 oxidation is important. The Si diffuses around the oxide layer and leads to the formation of Si-rich spherical phases on the surface and its inward diffusion induced reduction of Si concentration on the top surface as well as formed Si-rich wavy oxide. Although the composition of the oxide is within the estimated spinodal boundary, mobility of species at this temperature is not enough to show distinct phase separation.
Schematic illustration of the microstructural evolution during isothermal oxidation of ZrSi2 oxidation at (a) 700 °C, (b) 1000 °C, and (c) 1200 °C. c = crystalline and a = amorphous. The figure is not scaled.

At 1000 °C, in the initial stages of oxidation, the Si diffused inward first when it reacted with oxygen in the thin oxide layer and agglomerated resulting in wavy Si-rich oxide structures. The wavy structures seen in 700 °C oxidation tests were likely precursors of those observed at 1000 °C. While oxidation continues, outward diffusion of the newly formed Si dominated as confirmed by the increment of Si concentration at the surface. In the oxide/ZrSi2 interface, the amorphous Zr–Si–O mixture decomposed quickly so that the isotropic irregular structures consisting of ZrO2 and SiO2 were generated. At the same time, the Si produced Si-rich oxide islands near the spinodal structures.
At 1200 °C, the oxidation behavior was similar to 1000 °C oxidation except for the nucleation of the nanoscale ZrO2 particulates near the air interface. Due to remarkable outward diffusion of Si ions, the Zr–Si–O mixture was metastable and reduced its free energy by ZrO2 nucleation. In short, it is suggested that an intermediate unstable Zr–Si–O mixture exists during oxidation of ZrSi2 at 1000 and 1200 °C, leading to phase separation to ZrO2 and SiO2.
V. CONCLUSIONS
A study to gain and fundamental understanding of the evolution of oxide layer in ZrSi2 at high temperatures has been performed with the goal of applying ZrSi2 coatings on Zr-alloy fuel cladding to improve their accident tolerance. ZrSi2 showed parabolic-cubic oxidation kinetics depending on temperature and its weight gain due to oxidation was negligible compared to Zr-4. Average oxide scale thickness was 470 nm, 6.7 µm, and 37 µm at 700 °C, 1000 °C, and 1200 °C, respectively, for 5 h oxidation. The oxide scale was mechanically stable and there was no evidence of spallation of the oxide layer. At 700 °C, the surface morphology changed in that Si-rich micron-sized spherical phases on the top surface and Si-rich wavy structures in amorphous Zr–Si–O layer were observed. At 1000 °C, the Si concentration increased at the surface. In the depth-wise direction, fine spinodal structures, wavy Si-rich oxide, coarse spinodal structures, and Si-rich oxide islands were developed. At 1200 °C, similar structures were observed and additionally ZrO2 particulates in air interface. SEM-EDS and STEM-EDS analysis confirmed spinodal decomposition of Zr–Si–O matrix at 1000 and 1200 °C resulting crystalline ZrO2 and amorphous SiO2 and the driving force of their formation was explained by phase instability at 1000 and 1200 °C in ZrO2–SiO2 pseudo-binary phase diagram. Formation of finer spinodal structures at 1000 °C and nucleation of spherical ZrO2 particulates at 1200 °C may be attributed to high SiO2 mole fraction by outward Si diffusion. A physical model for oxidation has been proposed wherein Zr–Si–O mixture with newly formed Si undergoes a spinodal phase decomposition into ZrO2 and SiO2, which manifested as a nanoscale assembly of alternating layer of the two oxides. Based on its high oxidation resistance, ZrSi2 can be considered as a potential candidate coating material for LWR Zr-alloy fuel cladding for improved accident tolerance during a loss of coolant accident. The high temperature oxidation resistance results from the formation of amorphous Zr–Si–O or glassy SiO2. However, more tests particularly in steam environment and coating fabrication approaches must be investigated for implementation of this application.
ACKNOWLEDGMENTS
The authors are grateful to Steven Fronek for sample preparation and Alexander Mairov for technical support with STEM. This work is funded by Department of Energy (DOE) through grants DE-NE0008300.