


INTRODUCTION
In 2018, New York’s 19th District became the whitest district in the nation with a Black congressional representative. The district’s voters, 88% of whom were white, narrowly elected Democrat Antonio Delgado over Republican incumbent Representative John Faso, whose campaign had attempted to paint Delgado as a “big-city rapper” (National Republican Congressional Committee 2018). Political scientist Christopher B. Mann told the New York Times that the response to Faso’s attack ads would be “a test of how far we have come” (Foderaro Reference Foderaro2018), referring to the long and well-researched history of white voters’ negative reactions to candidates of color (Gay Reference Gay2002; Sigelman et al. Reference Sigelman, Sigelman, Walkosz and Nitz1995; Terkildsen Reference Terkildsen1993). Yet in one of the whitest districts in the country, Delgado prevailed.
Surprising as Delgado’s election might have been, he was not the only Black congressional candidate to win a seat in a majority-white district that year: Joe Neguse was elected in 88% white CO-02; Lauren Underwood in 84% white IL-14; Jahana Hayes in 77% white CT-05; and Lucy McBath in 71% white GA-06. In fact, all nine new Black members of Congress elected in 2018 represented majority or plurality-white districts, a marked departure from past election cycles (Dreier Reference Dreier2018). Subsequent cycles demonstrated that this surge in Black candidates’ success in white districts was not a fluke: 2020 saw the election of Byron Donalds, Mondaire Jones, Burgess Owens, and Marilyn Strickland, and 2022 saw the election of John James, Valerie Foushee, Emilia Sykes, Summer Lee, and Wesley Hunt—all of whom represented districts that were at least 60% white. Despite continued skepticism from donors and party leadership (Doherty, Dowling, and Miller Reference Doherty, Dowling and Miller2022), Representative Sykes recently told the Times, “Black candidates can win everywhere if we are given the opportunity” (quoted in Jimison Reference Jimison2024).
The role white voters have played in the successes of so many recently elected Black representatives is puzzling, since past research often indicates that white voters, like other groups, tend to prefer representatives who share their racial identity. Are recent gains in Black officeholding in majority-white, mostly Democratic places indicative of a change in white voters’ preferences? Two recent trends suggest they might be: white partisans are increasingly sorted on the basis of their racial attitudes (Jardina and Ollerenshaw Reference Jardina and Ollerenshaw2022; Sides, Tesler, and Vavreck Reference Sides, Tesler and Vavreck2019) and white Democrats have become increasingly racially liberal (Engelhardt Reference Engelhardt2021; Hopkins and Washington Reference Hopkins and Washington2020; Schram and Fording Reference Schram and Fording2021). Might white Democrats in particular now be more willing, or even prefer, to vote for Black candidates as a result of their growing racial liberalism? These questions relate to broader puzzles in political science: How can majoritarian democracies provide equitable representation to minority groups? In contexts of longstanding intergroup tensions and disparities, what makes coalition-building among members of advantaged and disadvantaged groups possible? In investigating the case of white Democrats’ support for Black candidates, this paper contributes to literatures on descriptive representation, party polarization, and privileged group members advocating for equality for disadvantaged groups (Kroeger Reference Kroeger2017; Lee Reference Lee2002; Radke et al. Reference Radke, Kutlaca, Siem, Wright and Becker2020; Wood Reference Wood2017). I present evidence that as white Democrats’ racial attitudes have liberalized, this group of voters has come to prefer Black candidates, all else equal, and that support is greatest among those who express the greatest concern for racial injustice.
The paper begins by discussing the significance of Black descriptive representation, the history of white voters’ resistance to electing Black politicians, and recent shifts in white Americans’, and particularly white Democrats’, attitudes towards Black Americans. I argue that these shifts could plausibly motivate greater support for Black candidates. After describing this theory and its testable implications, I present a series of empirical analyses. First, I show that the number of Black members of Congress has recently increased disproportionately in majority-white districts. Next, I turn to individual-level analyses to evaluate whether changes in white Americans’ voting behavior could contribute to this phenomenon. A meta-analysis of candidate choice experiments illustrates how support for Black candidates has increased distinctively among white Democratic participants over time. I then present suggestive evidence that white Democrats’ increasing support for Black politicians is, in part, a product of their increasing racial liberalism. I also present an experimental test of an alternative explanation for this growing support, finding that it is not fully explained by voters’ perceptions of candidates’ ideologies. The paper concludes by discussing implications and directions for future research.
BACKGROUND
The issue of Black representation is emblematic of a fundamental dilemma for majoritarian political systems: how can minoritized and marginalized groups be represented fairly? Black Americans are underrepresented both descriptively (Reflective Democracy Campaign 2021) and substantively (Griffin and Newman Reference Griffin and Newman2008). America’s history of disenfranchisement and discrimination against racial minority groups undoubtedly contributes to these disparities, but Griffin and Newman (Reference Griffin and Newman2008) also trace Black underrepresentation to differences in “voting power,” a function of the turnout rate, partisanship, and relative size of the group in a given constituency. These findings are disheartening because they suggest that even absent racial animus among white voters and legislators, the group-level interests of Black citizens would continue to receive less attention than those of white citizens. Although their research focuses on policy representation, Griffin and Newman (Reference Griffin and Newman2008) highlight that descriptive representation, that is, having a representative who shares one’s racial identity, is connected to improved material outcomes for Black Americans. But electing additional representatives of color remains a challenge. In Congress, for example, most majority-Black districts already have Black representatives, yet Black Americans remain underrepresented nationwide. In other remaining districts, Black candidates must usually win the support of a significant share of the white population. This section discusses the significance of descriptive representation of Black Americans, the history of white Americans’ resistance to electing Black officeholders, and the possibility of change.
The literature provides robust evidence that Black representation matters. Especially in contexts of intergroup disparities, conflict, and historical exclusion from power, the presence and actions of marginalized-group officeholders can have significant impacts (Mansbridge Reference Mansbridge1999). Black legislators promote Black interests in several ways, including prioritizing these interests in proposed legislation (Tate Reference Tate2003), sponsoring symbolic legislation acknowledging the contributions of Black Americans (Sinclair-Chapman Reference Sinclair-Chapman2002), and responding to contact from Black constitutions and non-constituents alike more frequently than otherwise-similar white legislators (Broockman Reference Broockman2013; Lowande, Ritchie, and Lauterbach Reference Lowande, Ritchie and Lauterbach2019). Black voters’ attitudes about descriptive representation reflect these impacts: Black voters perceive Black candidates as more likely to prioritize issues affecting racial minorities (English, Pearson, and Strolovitch Reference English, Pearson and Strolovitch2019; McDermott Reference McDermott1998; Stout Reference Stout2018) and as better equipped to address racial inequality (Weaver Reference Weaver2012). Descriptively represented Black Americans are also more likely to engage in politics in many ways and to express greater trust in government (see Stout, Tate, and Wilson [Reference Stout, Tate and Wilson2021] for a comprehensive review). In sum, much of the existing research indicates that descriptive representation carries great substantive and symbolic meaning for Black Americans.
Historically, white Americans have also preferred descriptive representation, presenting an obstacle to equalizing representation for minoritized groups. Gains in Black representation in Congress during Reconstruction and again in the late twentieth century were only possible when Black voters were concentrated in majority-minority districts and the federal government took action to protect Black voting rights (Bullock and Dunn Reference Bullock and Dunn2003; Pildes Reference Pildes1995; Stout, Tate, and Wilson Reference Stout, Tate and Wilson2021). Absent these conditions, white policymakers and voters have historically suppressed the Black vote and elected white representatives. Amid increasing Black representation in the 1990s and 2000s, many studies found that white voters continued to prefer white candidates (Block Reference Ray2011; Bullock and Dunn Reference Bullock and Dunn2003; Henderson et al. Reference Henderson, Sheagley, N. Goggin, Dancey and Theodoridis2022; Moskowitz and Stroh Reference Moskowitz and Stroh1994; Terkildsen Reference Terkildsen1993; Visalvanich Reference Visalvanich2017), to approve more highly of white representatives (Ansolabehere and Fraga Reference Ansolabehere and Fraga2016; Gay Reference Gay2002), and to indicate that they felt more represented by white members of Congress (English, Pearson, and Strolovitch Reference English, Pearson and Strolovitch2019). White Americans prefer white representatives for some of the same reasons that Black Americans prefer Black representatives: they perceive that on balance, Black candidates will prioritize minority group interests more highly (McDermott Reference McDermott1998; Sigelman et al. Reference Sigelman, Sigelman, Walkosz and Nitz1995) and may fear that their own interests will receive less attention. Consistent with this perception, Gay (Reference Gay2002) finds that white constituents rate white congressional representatives as more responsive to themselves.
However, anti-Black sentiment may contribute to this preference for white candidates more than the interests of whites as a group. Anti-Black prejudice is associated with diminished support for Black candidates among white voters (Krupnikov, Piston, and Bauer Reference Krupnikov, Piston and Bauer2016; Terkildsen Reference Terkildsen1993; Visalvanich Reference Visalvanich2017). Scholars have argued that racial prejudice cost President Obama a non-negligible share of the electorate in 2008 (Hutchings Reference Hutchings2009; Tesler and Sears Reference Tesler and Sears2010). Racial prejudice among white Americans has historically been widespread, widening the scope of its impact on voting behavior. Figure 1, which presents data from the General Social Survey (Davern et al. Reference Davern, Bautista, Freese, Herd and Morgan2024) and the American National Election Study (American National Election Studies 2022), demonstrates that as recently as 2012, majorities of white Democrats and Republicans alike denied that racial inequality was mainly due to discrimination and agreed with the statement that “Blacks should work their way up without special favors.” Despite the Democratic party’s reputation as the more racially liberal party (Schickler Reference Schickler2016), racial prejudice has historically been an especially potent source of division among white Democrats (Feldman and Huddy Reference Feldman and Huddy2005; Sniderman, Brody, and Tetlock Reference Sniderman, Brody and Tetlock1991; Sniderman and Carmines Reference Sniderman and Carmines1997). To be sure, there are examples throughout recent history of whites supporting the political empowerment and representation of Black Americans (Southern Poverty Law Center 2015), but racially liberal white Democrats remained a minority through Obama’s reelection. Black candidates achieved impressive success in the 1990s and 2000s, not least President Obama, but this success occurred in spite of persistent and widespread racial conservatism among white Americans (DeSante and Smith Reference DeSante and Smith2020; Hutchings Reference Hutchings2009), not because of whites’ changing attitudes.
Perceptions of Racial Injustice by Respondent Race and Partisanship
Note: General Social Survey (top and lower left panels) and American National Election Study (lower right panel). Data are weighted using person post-stratification weights.

More recently, however, scholars have noted that whites’ racial attitudes have significantly shifted, particularly when examining these attitudes by party. Jardina and Ollerenshaw (Reference Jardina and Ollerenshaw2022) show that white Democrats’ racial resentment, negative racial stereotyping, and opposition to race-conscious policies declined precipitously between 2016 and 2020, whereas white Republicans’ responses to these items remained relatively stable. Hopkins and Washington (Reference Hopkins and Washington2020) replicate this result of asymmetric polarization in racial resentment between 2016 and 2020. Some of this polarization reflects an ongoing process of party sorting (Sides, Tesler, and Vavreck Reference Sides, Tesler and Vavreck2019), but others have argued convincingly that many white Democrats’ racial attitudes have genuinely changed over the last fifteen years (Engelhardt Reference Engelhardt2021; Reference Engelhardt2023). White Republicans’ racial attitudes, on the other hand, have either liberalized more modestly (Hopkins and Washington Reference Hopkins and Washington2020), shown little change (Jardina and Ollerenshaw Reference Jardina and Ollerenshaw2022), or grown somewhat more conservative over this period (Enns and Jardina Reference Enns and Jardina2021). The data presented in Figure 1 exemplify this developing asymmetric polarization among white partisans. In each panel, white Democrats’ average views diverge from white Republicans and approach those of Black Democrats in the latter half of the 2010s.
The rapid liberalization of white Democrats’ racial attitudes and their increasing support for pro-Black policies are surprising. Past literature has conceived of racial attitudes as “crystallizing” in childhood and remaining stable over a person’s lifetime (Henry and Sears Reference Henry and Sears2009), and DeSante and Smith (Reference DeSante and Smith2020) show that younger white cohorts are not especially racially liberal. Many of the scholars who have documented this shift point to the emergence and election of President Trump as a catalyst for this accelerating polarization. If President Obama symbolized the nation’s racial progress, Trump’s explicit racial rhetoric signaled a threat to this progress that many reacted strongly against (Hopkins and Washington Reference Hopkins and Washington2020; Jardina, Kalmoe, and Gross Reference Jardina, Kalmoe and Gross2021; Schram and Fording Reference Schram and Fording2021; Sides and Tesler Reference Sides and Tesler2024). After eight years of Obama and four years of Trump, white Americans’ racial attitudes were strongly tied to their partisanship and white Democrats’ racial attitudes in particular had moved significantly to the left, a set of shifts that has largely persisted through the Biden era (Sides and Tesler Reference Sides and Tesler2024).
The political effects of white Democrats’ more-liberal racial attitudes has been a burgeoning area of study, and it suggests that this shift could be associated with growing support for Black political candidates. Tesler and Sears’s (Reference Tesler and Sears2010) research on how racial resentment factored into Obama’s 2008 campaign provides a key insight on which much of this newer literature rests: those white voters who expressed low racial resentment in 2008, although a minority even within the Democratic party, were more supportive of Obama and policies associated with him because of his racial identity. The low end of the racial resentment scale, in other words, measures not merely the absence of anti-Black bias, but a preference for a Black politician. Recent work by Agadjanian et al. (Reference Agadjanian, Carey, Horiuchi and Ryan2023) provides an experimental test of this theory, showing that minimally racially resentful white Democratic participants preferred Black candidates for a city manager position to otherwise-identical white job candidates in a conjoint task. This “other side of racialization” (Tesler and Sears Reference Tesler and Sears2010, 6) was overpowered by the “first” (high-resentment) side in 2008, but post-2016, the majority of white Democrats fall on the lower half of the racial resentment scale. Schram and Fording (Reference Schram and Fording2021) note the significance of white Democrats’ racial liberalism for the aforementioned wave of Black candidates elected to Congress in 2018, finding that low racial resentment was associated with participation in a range of political activities among whites in that year. In other words, at the same time that white Democrats’ racial attitudes changed, these attitudes also became a stronger impetus to political action.
The bottom panels in Figure 1 exemplify the political nature of these attitudinal shifts: by 2022, white Democrats had significantly diverged from white Republicans and nearly converged with Black Democrats in their agreement with the notion that the government should take action to improve the living standards of Blacks, as well as in the belief that Black Americans have too little influence in politics rather than too much. In both cases, estimates for white Democrats cross the middle of these scales between 2012 and 2020. Not only were the racial attitudes of white Democrats dramatically different in the wake of Trump’s ascendance, their racial politics were as well. As Sides and Tesler (Reference Sides and Tesler2024) note, there is some regression to the mean post-2020, but this qualitative shift across the midpoint from racial conservatism to liberalism remains.
THEORETICAL EXPECTATIONS
What might be the consequences of these developments for Black Americans’ descriptive representation? The literature provides some suggestive evidence on this question. Tesler and Sears (Reference Tesler and Sears2010) and Agadjanian et al. (Reference Agadjanian, Carey, Horiuchi and Ryan2023) find that low racial resentment is associated with a preference for Black politicians. Weissman (Reference WeissmanForthcoming) shows that over the same period that white Democrats’ racial resentment has declined, they have come to approve more highly of congressional representatives of color than of similar white representatives. Together, these studies suggest that white Democrats’ increasing racial liberalism may be contributing to a growing preference for Black representatives, a reversal of many of the findings in the descriptive representation literature. The studies presented in this paper, summarized in Table 1, aim to test this proposition.
Summary of Analyses

Note: All studies were approved by UC Berkeley’s IRB. Lucid samples were recruited using Lucid Marketplace and restricted to non-Hispanic whites who self-identify as Democratic partisans or leaners. Round 1 was collected in March 2022, N = 469. Round 2 was collected in April 2023, N = 1,852. Round 3 was collected in May 2023, N = 254. Round 4 was collected in June 2023, N = 153. These four studies were conducted under IRB Protocol #2022-03-15203. Round 5 was collected in December 2023, N = 1,294; IRB Protocol #2023-11-16908. The California voter sample was recruited via email in August 2023 using a random sample of the state voter file provided by Political Data Intelligence. Non-Hispanic white Democratic partisans and leaners N = 543; IRB Protocol #2023-03-16197.
The first study analyzes the relationship between the election of Black congressional representatives and district racial composition between 2010 and 2022, which includes the period of greatest change and polarization in whites’ racial attitudes. In light of the literature arguing that racial prejudice hurts Black candidates’ ability to appeal to white voters, we should see more Black candidates winning election in whiter districts as racial prejudice declines among white Democrats. Indeed, we do. The second study turns from district-level to voter-level analysis to directly test whether white Democrats have become more likely to vote for (hypothetical) Black candidates over time. I analyze data from 36 candidate choice experiments, conducted between 1988 and 2022, in which participants faced choices between Black and white candidate profiles. This meta-analysis also includes data from six conjoint experiments I conducted in 2022 and 2023. This study demonstrates a distinctive upward trend in white Democrats’ support for Black candidate profiles over time. The third study examines whether this new preference for Black candidate profiles is associated with pro-Black attitudes. I find that support for Black profiles in my own surveys of white Democratic participants is highest among the least racially resentful and those who perceive the greatest degree of anti-Black discrimination. Consistent with the prominent role of President Trump in the process of white Democrats’ leftward shift on race, I also show that negative feelings towards Trump are a potent predictor of support for Black candidate profiles.
I also investigate whether racially liberal white Democrats view electing Black representatives as a symbolic manifestation of the nation’s racial progress and an end in itself, or rather as a means of promoting material steps to address racial injustice. When I analyze the tradeoffs voters make between candidates who are Black and those who take a liberal stance on a race-related policy, I find suggestive evidence that white Democratic voters’ support for Black candidates is not reducible to an aesthetic preference for a more diverse legislature; rather, it reflects, in part, a desire to elect a representative who supports racially progressive policies.
Finally, I test an alternative explanation for white Democrats’ growing support for Black candidates: that political liberalism in general, rather than racial liberalism in particular, explains the observed shift. White voters tend to stereotype Black candidates and politicians as more ideologically extreme, and specifically as more liberal than similar white candidates (Bowen and Clark Reference Bowen and Clark2014; Lerman and Sadin Reference Lerman and Sadin2016; McDermott Reference McDermott1998; Sigelman et al. Reference Sigelman, Sigelman, Walkosz and Nitz1995; Visalvanich Reference Visalvanich2017). Historically, scholars have argued that this tendency disadvantages Black candidates, but in light of the continued ideological sorting the parties (Levendusky Reference Levendusky2009), perhaps this liability is now an asset. Racial attitudes, especially racial resentment, are closely related to political ideology (Carmines, Sniderman, and Easter Reference Carmines, Sniderman and Easter2011); consequently, ideological stereotyping could be a confounding variable in the relationship between racial attitudes and support for Black candidates. However, I find that white Democratic voters, on average, are willing to trade off a modest degree of ideological closeness to support Black candidates. White Democratic voters are not simply using race to infer ideological congruence with candidate profiles. Instead, this and the other analyses presented in this paper provide suggestive evidence that these voters view electing Black representatives as a means of pursuing remedies to racial injustice.
ARE MORE BLACK CONGRESSIONAL CANDIDATES GETTING ELECTED IN MAJORITY-WHITE DISTRICTS?
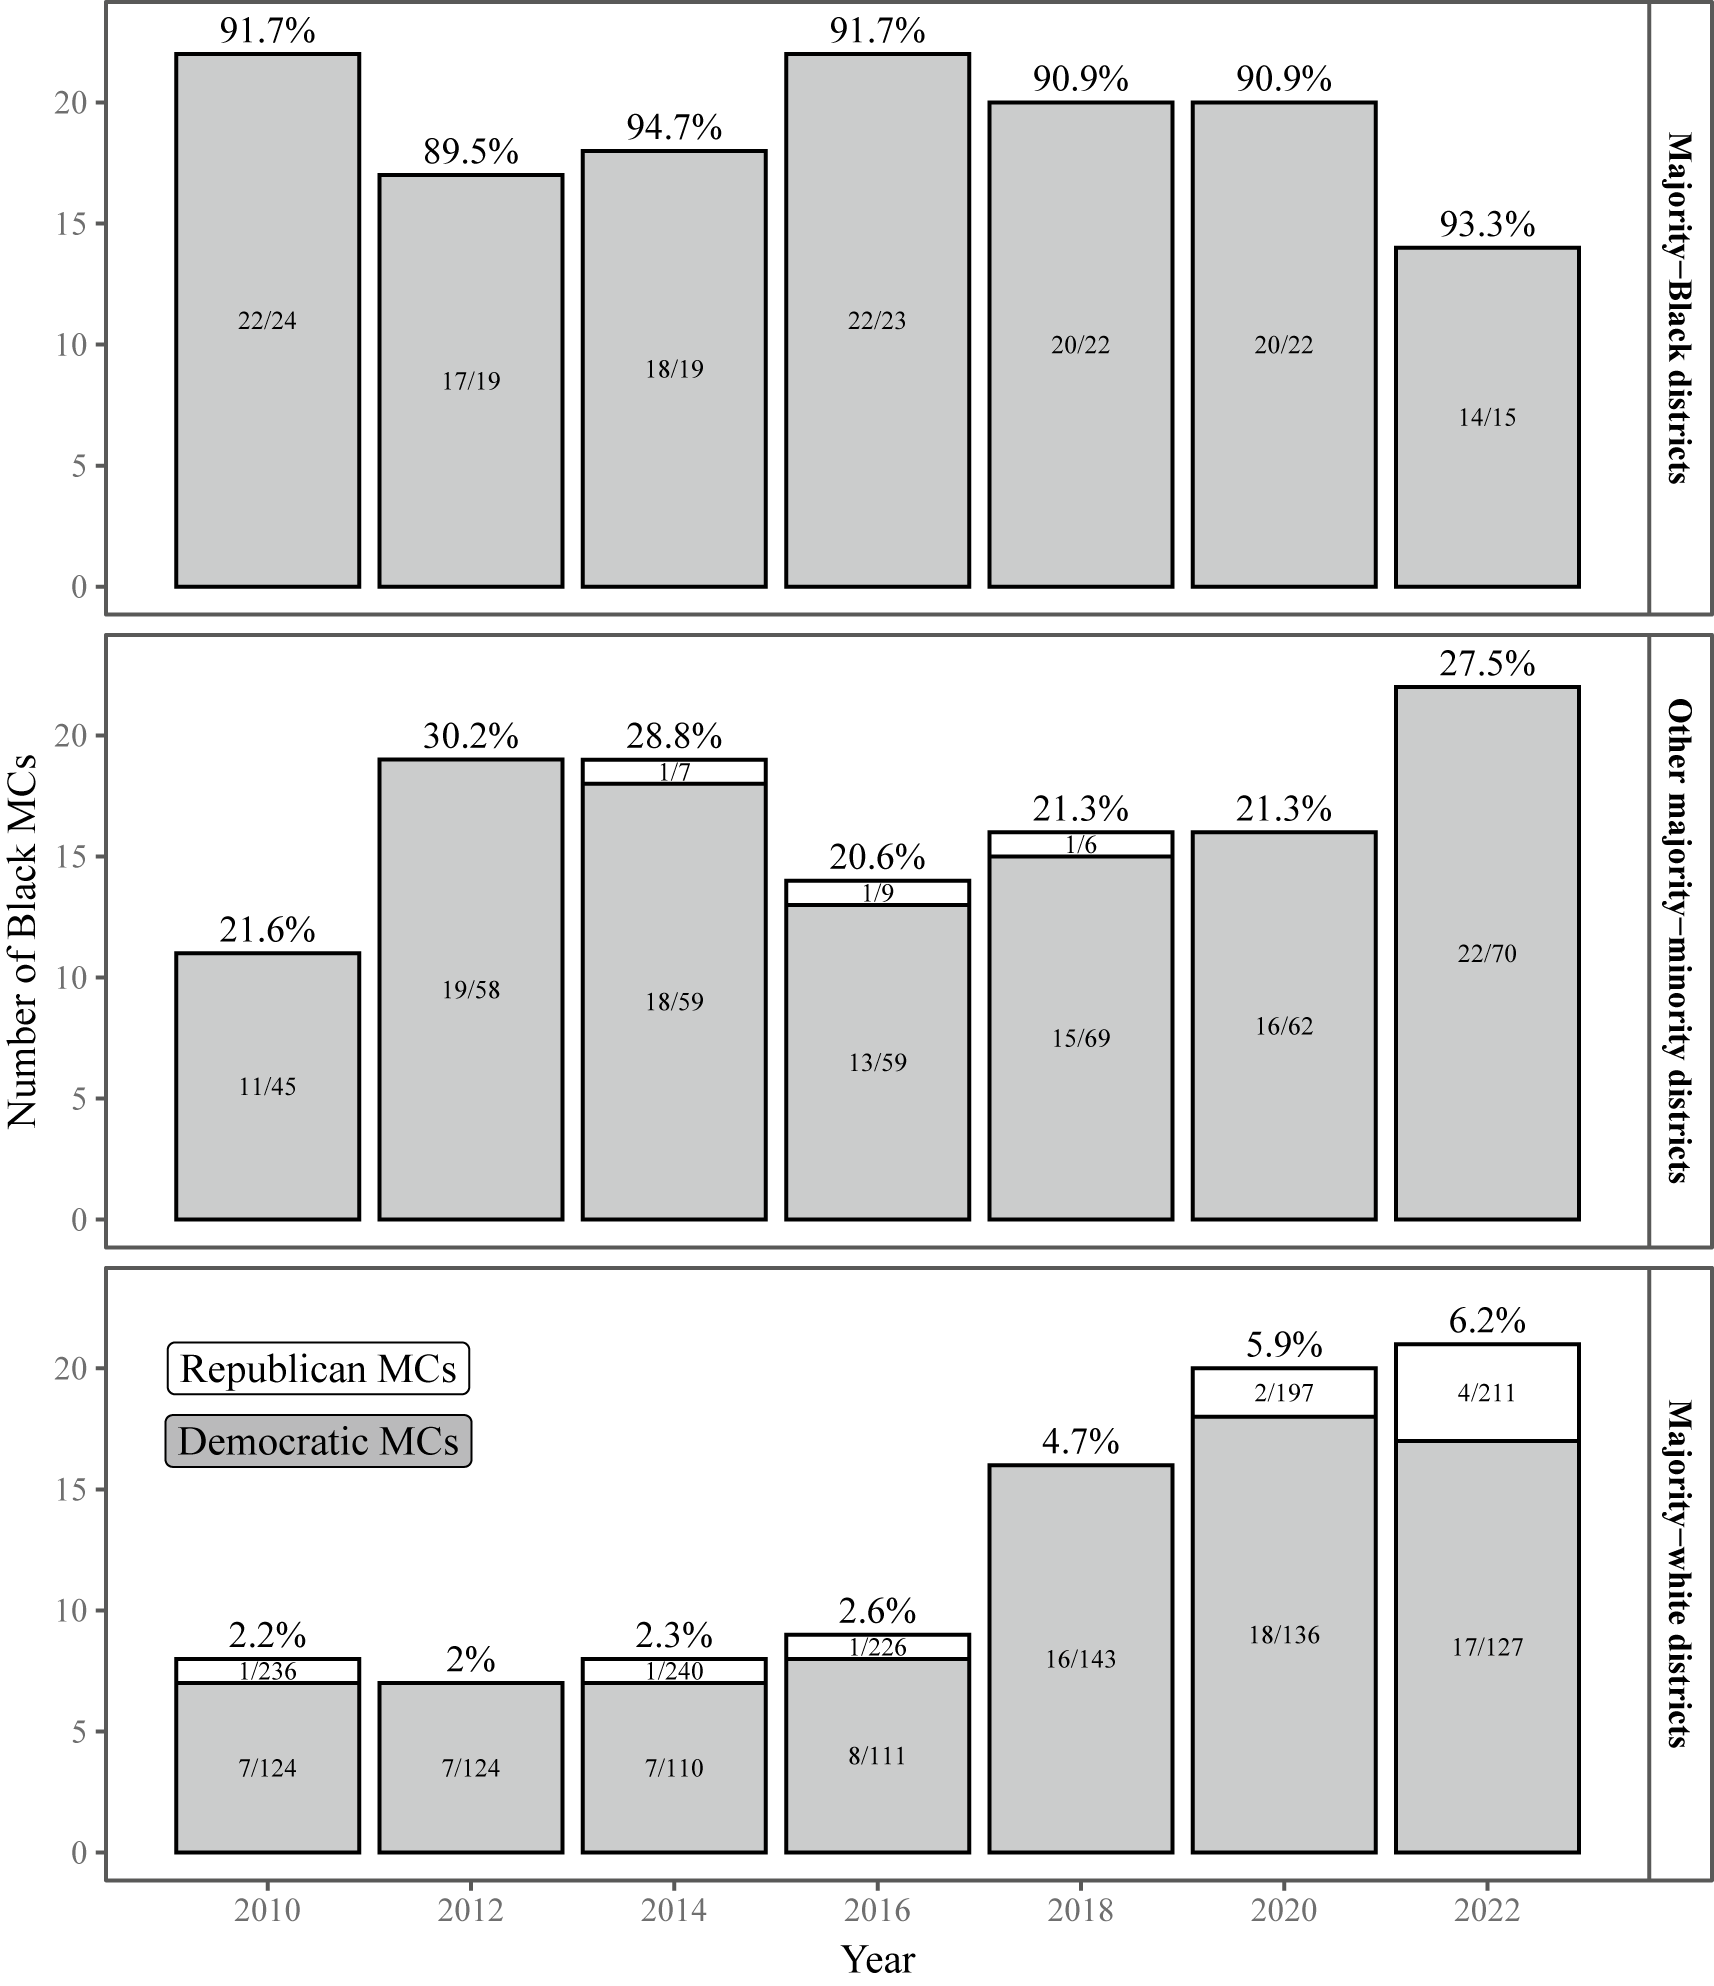
If white Democrats’ increasingly liberal racial attitudes have made them more supportive of Black candidates, then we should see Black candidates running and winning in whiter places. To test this implication, I compiled data on the ethnicity of members of Congress and on their districts between 2010 and 2022.Footnote 1 Figure 2 plots the number of Black members of Congress (MCs) by year, disaggregated by the racial composition of the district they represent. Bars are color-coded by MC party, and the fractions in the figure represent the share of MCs from that party and district type who are Black. The number of majority-white districts represented by Black MCs nearly tripled between 2010 and 2022. Moreover, the percentage of majority-white districts represented by Black MCs increased from 2.2% in 2010 to 6.2% in 2022, whereas the percentages of majority-Black and other majority–minority districts represented by Black MCs did not change significantly over this period.
Number of Black MCs in Majority-Black and Other Majority–Minority vs. Majority-White Districts, 2010–2022
Note: Shares of Black MCs in the Democratic and Republican parties from each type of district are shown as fractions, and shares of Black MCs from each type of district overall are shown as percentages.

Of course, these statistics alone are not necessarily indicative of changes in white voters’ behavior. Perhaps the growing number of Black MCs in majority-white districts has more to do with changing district demographics. Even districts that remained majority-white became slightly less white over this period, with the average share of whites in majority-white districts decreasing from 79.4% in 2008 to 76.1% in 2022, as shown in the first column of Table 2. To account for this demographic change, the remaining columns of Table 2 estimate the relationship between year and estimated proportion of Black representatives, controlling for citizen voting age population (CVAP) percent white, for majority-white districts column 2), majority-Black districts (column 3), and other majority-minority districts (column 4). If white voters’ support for Black candidates has increased, the coefficients on later years in the dataset should be positive and statistically significant, net district CVAP percent white. As expected, although the coefficient on district CVAP percent white is negative in majority white districts—whiter districts elect fewer Black representatives, on average—the coefficients on 2020 and 2022 are positive and statistically significant, indicating that holding district CVAP percent white constant, more Black congressional candidates are winning in majority-white districts in these years. This pattern does not hold in either majority-Black or other majority-minority districts.
Majority-White Districts Citizen Voting Age Percent White Over Time and Proportion of U.S. House Districts With a Black Representative by Year and Type of District, Controlling for CVAP Percent White

Note: *p < 0.05; **p < 0.01; ***p < 0.001. Reference category is 2010. Percent white scaled 0–1.
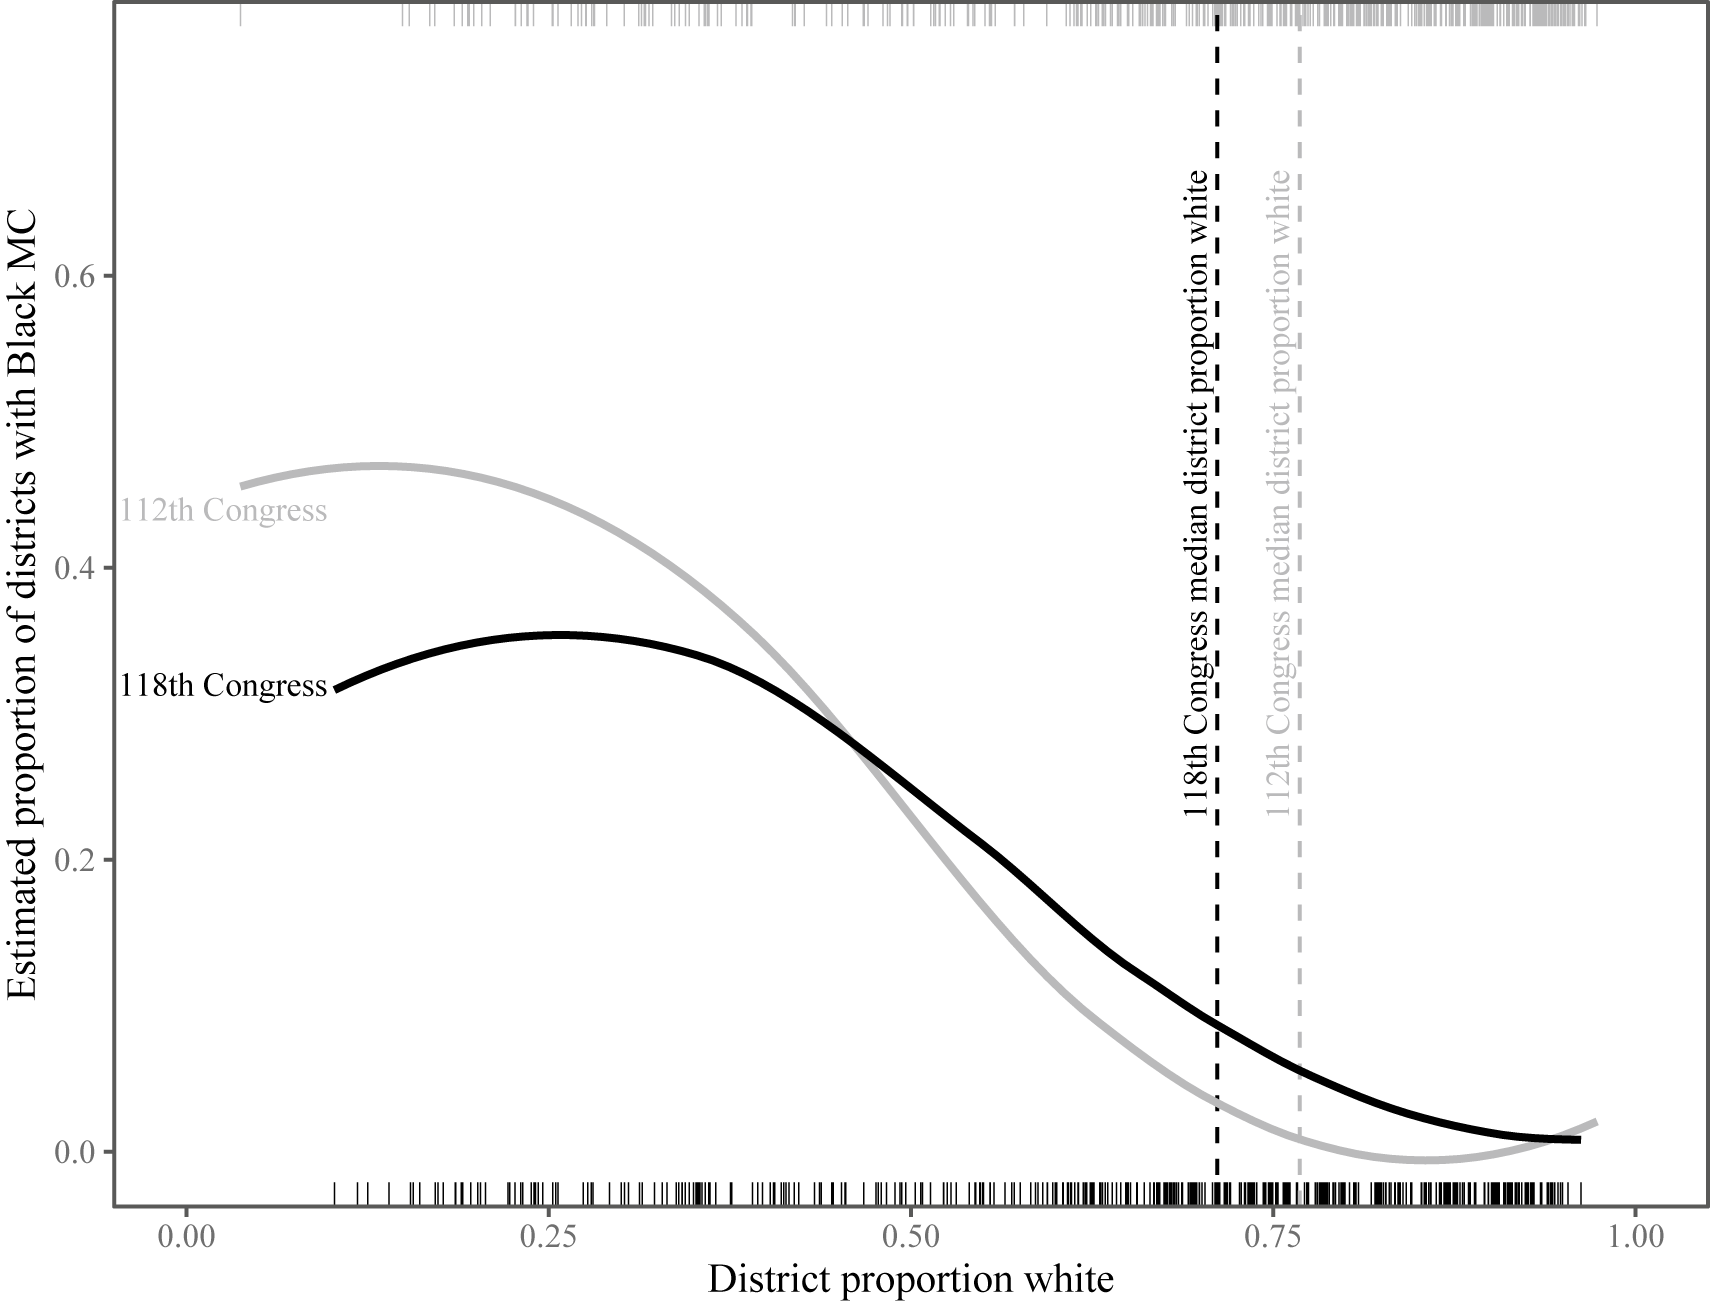
To illustrate how the relationship between district CVAP percent white and the election of Black MCs has changed over time, Figure 3 examines the earliest and latest years shown in Figure 2 in more granular detail. It plots LOESS regression lines showing the relationship between district percent white and having a Black congressional representative. This relationship is negative in both years, but in the region of the plot representing majority-white districts, the line for the 118th Congress is less steep than the line for the 112th, indicating less of a decline in Black officeholding as proportion white increases in 2022 than in 2010. Additionally, the 118th Congress line falls above the 112th Congress line in this region of the plot. The vertical dashed lines represent the median district proportion white in each of these two years; that the 118th Congress line is higher at both points on the x-axis suggests that the increase in Black representation in majority-white districts is not attributable to demographic change alone.
Proportion of Black MCs in 112th and 118th Congresses by District Citizen Voting Age Population Proportion White
Note: Results of bivariate LOESS models analyzing the relationship between district citizen voting age percent white and estimated proportion of districts with Black MCs for the 112th Congress and the 118th Congress.

Still, these analyses do not directly tell us whether white voters have become more likely to support Black candidates. An alternative possibility is that political elites have become more likely to back these candidates. However, Doherty, Dowling, and Miller (Reference Doherty, Dowling and Miller2022) find this is unlikely to be the case in majority-white districts, and an analysis of candidates’ fundraising receipts, reported in Table A2 in the Supplementary Material, shows that Black Democratic frontrunners in majority-white districts do not receive greater support from PACs and party committees than similar white candidates. It could be that white voters are less likely to turn out in elections where a Black candidate is on the ballot (Gay Reference Gay2001; Petrow Reference Petrow2010; Washington Reference Washington2006). Another possible mechanism behind this increase is change in candidate supply (Juenke and Shah Reference Juenke and Shah2016). In their analysis of the unprecedented number of state legislators of color elected in 2018, Fraga, Shah, and Juenke (Reference Fraga, Shah and Juenke2020) find that this increase in POC representation was driven by an unprecedented number of candidates of color entering legislative races rather than unprecedented success of these candidates conditional on having entered. The authors conclude that candidates of color were elected in 2018 “because more of them were competing... not because voters are making new gendered and racial/ethnic choices” (437, emphasis in original text). However, Fraga and his coauthors’ data do not permit examination of these choices at the voter level, nor can their analyses rule out the possibility that candidate supply is endogenous to anticipated voter demand. To assess whether individual white voters have become more supportive of Black candidates over time, it will be necessary to move from district-level to individual-level analysis.
DO INDIVIDUAL VOTERS SELECT BLACK CANDIDATES MORE OFTEN NOW THAN IN THE PAST?
To test for possible changes in support for Black candidates at the voter level, this section presents analysis of data from candidate choice experiments in which white voters selected between Black and white candidate profiles. Although experiments lack the realism and stakes of actual elections, they allow for greater isolation of the relationship between race and vote choice by removing much of the potential for confounding variables inherent in real-world data.
Data
I gathered replication datasets from 36 studies conducted by other scholars between 1988 and 2022. I located relevant studies by searching on Google Scholar and Roper iPoll; the archives of American Political Science Review, American Journal of Political Science, British Journal of Political Science, Journal of Experimental Political Science, Journal of Politics, Political Analysis, and Political Behavior; and within CCES team modules. Included studies had to (1) include a binary measure of candidate choice, (2) manipulate candidate race, and (3) record participant race and partisanship. Citations for each of the included studies are provided in the appendix, and additional information about each is provided in Table B1 in the Supplementary Material.
I also conducted six original conjoint studies in 2022 and 2023 which meet these three criteria. Section B of the Supplementary Material presents example conjoint tables from each of these studies. Five of the studies were fielded on Lucid Marketplace between March 2022 and December 2023 on samples of white Democrats. The fifth sample also included Black Democrats. In all five studies, after consenting to participate and passing two attention checks, participants viewed the profiles of two hypothetical candidates, one Black and one white, and asked, “Which candidate for Congress would you support in this Democratic Primary election?” All respondents were paid for their participation, with compensation ranging from $0.75 to $1.50 based on the length of the survey form.
The sixth original study was conducted by emailing a random sample of the California voter file in August 2023. 543 white Democrats responded. As in the Lucid studies, both candidates in the conjoint task were Democrats, but rather than voting in a hypothetical primary, participants were simply asked “Which of these profiles would you prefer to have as your representative in Congress?,” since non-Democratic voters would not be likely to vote in such a primary. Participants were offered the opportunity to enter a drawing to win one of five $200 Amazon gift cards upon completing the survey.Footnote 2
To facilitate comparison across studies in this meta-analysis, I took two further steps. First, I restricted analysis to contests between one Black and one white candidate. This is necessary because some studies assigned candidate race with equal probabilities for each racial identity, whereas others assigned race with probabilities equal to population share. Studies with a higher proportion of Black candidates have higher rates of Black vs. Black contests, biasing the “effect” of a candidate being Black toward zero. Accordingly, I consider only contests between Black and white candidates and present the marginal mean for Black candidates, that is, the proportion of the time a Black candidate was selected over a white opponent.
Second, I weighted the data to approximate representativeness within year, race, and party. Many of the studies in this analysis were fielded by industry-leading polling firms on close-to-representative samples, but others, including my own, were fielded on platforms such as Mechanical Turk and Lucid, which tend to yield samples that are somewhat less representative (Berinsky, Huber, and Lenz Reference Berinsky, Huber and Lenz2012; Coppock and McClellan Reference Coppock and McClellan2019). Increased use of the latter category of platforms in recent years could be an issue for the over-time analysis I am conducting if the non-representativeness of these samples leads to a greater bias in overall estimates for more recent years. Accordingly, I weighted all data in the meta-analysis using crossed targets for age group, gender, and census region. Further information about weighting is provided in Section B of the Supplementary Material.
Results
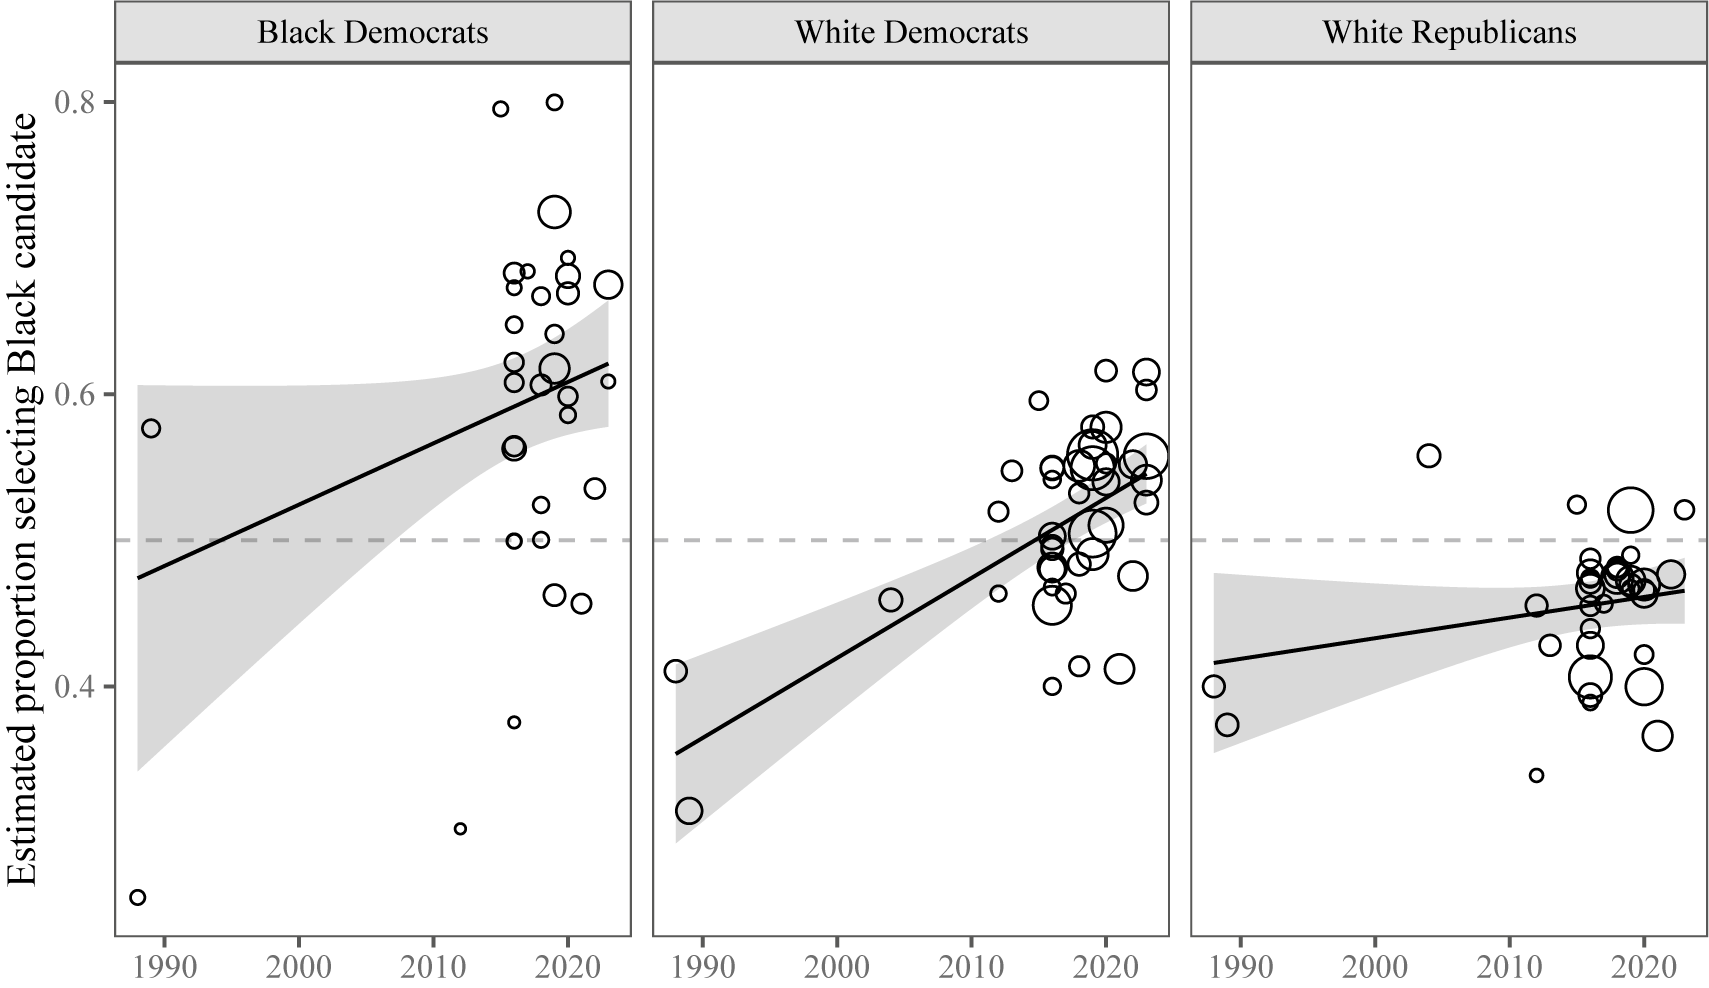
To estimate change in support for Black candidates over time, I specified a linear model regressing the proportion of participants selecting a Black candidate over a white opponent on year. The model includes the weights discussed in the section above as well as study random effects (see Schwarz and Coppock [Reference Schwarz and Coppock2022] for an explanation of the use of random effects in a meta-analysis of conjoint experiments). Figure 4 presents the estimated proportion of Black Democratic, white Democratic, and white Republican study participants who selected a Black candidate over a white opponent over time. These results are also provided in Model 1 presented in Table B5 in the Supplementary Material. White Democrats stand out as the group that has shifted most dramatically in their support for Black candidates between 1988 and 2023, moving from a significant preference for white candidates to a significant preference for Black candidates. Black Democrats’ preference for Black candidates and white Republicans’ preference for white candidates are both relatively consistent across studies and over time. Owing to the relatively small samples of Black Democrats in many of these studies, there is a lot of noise in estimates for this group, and the slope of the regression line is not significantly different from the slope for white Democrats (
 $ p=0.606 $
). However, the slope of the regression line for white Democrats is significantly steeper than that for white Republicans (
 $ p=0.007 $
).Footnote
3
Estimated Proportion of Study Participants Selecting Black Candidates Over White Opponents Across 42 Candidate Choice Experiments, 1988–2023
Note: Models include study random effects. Points are estimates from individual studies, sized by sample size. Data are weighted for representativeness by race-party-year. Results are presented in tabular form in Column 1 of Table B4 in the Supplementary Material.

Visualizing the results of the meta-analysis in this way is useful, but it also illustrates the dearth of available data prior to 2012. Candidate choice experiments were relatively rare until conjoint experiments gained popularity in the early 2010s, and changes in technology and the retirements of past generations of researchers mean that some of the few datasets that did exist prior to this period are lost to time. The estimates that I am able to calculate in the 1980s and early 2000s are consistent with the literature, which indicates that through this period, white Democrats were indeed hesitant to support Black candidates and representatives (Bullock and Dunn Reference Bullock and Dunn2003; Gay Reference Gay2002; Moskowitz and Stroh Reference Moskowitz and Stroh1994; Pildes Reference Pildes1995; Terkildsen Reference Terkildsen1993). However, it is reasonable to wonder whether these three studies drive the entirety of the positive upward trend in support among white Democrats.
To address this possibility, I specify an additional model, presented in Figure 5 and across Columns 2 and 3 of Table B5 in the Supplementary Material. This model first regresses support for Black candidates over white opponents on a three-level factor variable that groups studies conducted 1988–2004, 2012–2016, and 2017–2023, retaining the same weights and publication random effects as the model discussed above. These buckets correspond with periods in which the literature would suggest that white Democrats would (1) prefer white candidates, (2) display ambivalence between white and Black candidates, and (3) potentially prefer Black candidates on average, respectively. Across the three studies conducted in 2004 and earlier, white Democrats selected Black candidates about 39.1% of the time. Also as expected, this proportion increased significantly by about 10.5 percentage points in the 2012–2016 period (
 $ SE=3.4 $
percentage points), to almost exactly 50%. There was also a statistically significant increase in support for Black candidates of about 3.7 percentage points (
 $ SE=1.6 $
percentage points) between the 2012–2016 and 2017–2023 periods. By contrast, neither Black Democrats nor white Republicans became notably more supportive of Black candidates between these two latter periods, nor did white Republicans’ support increase significantly between the two earlier periods.
Estimated Proportion of Study Participants Selecting Black Candidates Over White Opponents Across 42 Candidate Choice Experiments by Period, 1988–2023
Note: Models include study random effects. Points represent pooled estimates in each of three periods: pre-2012, 2012–2016, and 2017–2023. Error bars represent 95% confidence intervals. Data are weighted for representativeness by race-party-year. Results are presented in tabular form in Columns 2 and 3 of Table B5 in the Supplementary Material.

To sum up, across 42 experiments conducted between 1988 and 2023, white Democratic survey participants have come to respond more positively to Black candidate profiles over time. Consistent with the literature’s characterization of these voters’ responses to Black candidates, this shift has occurred in two parts. First, by the mid-2010s, racial sorting and the influence of President Obama coincided with a shift from significantly preferring white profiles to, on average, indifference between Black and white profiles. Second, following Trump’s election and the rapid shift in white Democrats’ racial attitudes that ensued, this indifference changed to a modest but statistically significant preference for Black profiles.Footnote 4 Analysis of voter-level decisions thus corresponds with theoretical expectations and suggests that the increase in Black representation in majority-white districts could be driven, in part, by white Democrats in these districts voting for Black candidates in greater numbers. Contrary to the conclusion reached by Fraga, Shah, and Juenke (Reference Fraga, Shah and Juenke2020), voters are “making new... racial/ethnic choices” (437)—choices which could have the potential to encourage higher rates of Black candidate entry and more ready elite support for potential Black candidates.
WHICH ATTITUDES ARE ASSOCIATED WITH WHITE DEMOCRATS’ SUPPORT FOR BLACK CANDIDATES?
So far, we have seen that Black candidates have been elected at accelerating rates in majority-white districts and that white Democrats have become more supportive of Black candidate profiles, both over the same period that white Democrats’ attitudes toward Black Americans have liberalized. But are liberal racial attitudes in fact associated with a preference for Black candidate profiles? In this section, I make further use of the original studies included in the meta-analysis to address this question.
Data
To explore the relationship between racial attitudes and support for Black candidates, the first Lucid study measured participants’ racial resentment and perceptions of anti-Black discrimination. I included racial resentment because it is a commonly used measure of white attitudes toward Black Americans (Agadjanian et al. Reference Agadjanian, Carey, Horiuchi and Ryan2023; Tesler and Sears Reference Tesler and Sears2010). However, racial resentment’s strong ideological content (Carmines, Sniderman, and Easter Reference Carmines, Sniderman and Easter2011) means that white partisans’ responses to these traditional items are quite polarized (Engelhardt Reference Engelhardt2021), and other measures reveal greater heterogeneity among white Democrats (Peyton and Huber Reference Peyton and Huber2021). Accordingly, I also measured participants’ perceptions of anti-Black discrimination, a less affectively and ideologically laden way of assessing participants’ beliefs about racial injustice.
In the second Lucid study, I focused on the relationship between support for Black candidates and partisan and ideological considerations. I measured participants’ affect toward Presidents Trump and Biden using traditional feeling thermometer items. This study also included a manipulation of the ideology of the candidates presented in the conjoint task that will be discussed in greater detail in a later section. Table C1 in the Supplementary Material presents the full text of the items used in these analyses.
Support for Black Candidates is Associated with Concern About Racial Injustice and Dislike of Trump
Figure 6 presents the relationships between racial resentment, perceived anti-Black discrimination, and feeling thermometers for Presidents Trump and Biden on the x-axes and selecting a Black candidate profile on the y-axis. The top two panels indicate that as expected, racial resentment is negatively associated with selecting a Black profile (
 $ \beta =-0.297 $
,
 $ SE=0.085 $
,
 $ p<0.001 $
) and perceiving a greater degree of anti-Black discrimination is positively associated with selecting a Black profile (
 $ \beta =0.397 $
,
 $ SE=0.088 $
,
 $ p<0.001 $
).Footnote
5 Consistent with Tesler and Sears’s (Reference Tesler and Sears2010) “two sides of racialization” framework, both the low and high ends of each scale are associated with a significant preference about candidate race: high-resentment participants and those who expressed that Black Americans face no discrimination preferred white candidate profiles on average, whereas low-resentment participants and those who expressed that Black Americans face “a great deal” of discrimination preferred Black profiles on average. Low racial resentment is thus not simply an absence of racial prejudice, but is associated with a distinctly positive reaction to Black candidates. Similarly, white Democrats who believe that Black Americans face a great deal of discrimination do not simply endeavor not to discriminate against Black candidates themselves, but act to balance out this discrimination through their voting behavior.
Perceptions of Racial Injustice, Presidential Feeling Thermometers, and Support for Black Candidates Among White Democratic Survey Participants
Note: Bivariate OLS regressions with 95% confidence intervals. Points represent unique values on the x-axes and are sized by number of participants. Data are weighted for representativeness by age, gender, and region. Racial attitudes data are from Lucid Study 1 and presidential feeling thermometer data are from Lucid Study 2. Results are presented in tabular form in Table C2 in the Supplementary Material.

The second row of panels in Figure 6 considers the relationship between partisanship and white Democrats’ support for Black candidates, comparing feelings toward Trump with feelings toward Biden in predicting Black profile selection. Warm ratings of Trump on the feeling thermometer are associated with selecting Black candidates significantly less often (
 $ \beta =-0.226 $
,
 $ SE=0.046 $
,
 $ p<0.001 $
). As with racial resentment and perceptions of anti-Black discrimination, both especially warm and especially cool feelings toward Trump are associated with significant racial preferences: the 90% of participants who rated their feelings toward Trump at cooler than 50 degrees on a 0–100 scale selected a Black profile 57% of the time, whereas the 10% of participants who rated Trump at or warmer than 50 degrees selected Black profiles just 41% of the time (after applying the same survey weights used in the regression analyses). Recall that the conjoint task asked participants to select between candidates in a Democratic congressional primary—both candidates were always Democrats—yet dislike of Trump is still associated with a preference for Black profiles. By contrast, warmth toward Biden is not significantly associated with selecting Black profiles (
 $ \beta =0.061 $
,
 $ SE=0.046 $
,
 $ p=0.185 $
); those who rated Biden at cooler than 50 degrees selected Black profiles 48% of the time—a share not significantly different from 50% (
 $ SE=4.4 $
percentage points)—whereas those who rated Biden at or above 50 degrees selected Black profiles 57% of the time. Additionally, the final column of Table C2 in the Supplementary Material shows that when both feeling thermometers are included in a single regression model, warmth toward Trump remains a substantively and statistically significant predictor of support for Black profiles, whereas warmth toward Biden loses statistical significance and diminishes in magnitude by half. Unfortunately, Lucid Study 2 did not include the measures of racial attitudes analyzed in this section, precluding analysis of the relationship between feelings toward Trump and racial liberalism. However, this pattern of results is consistent with past research on Trump’s distinctive role in driving white Democrats’ liberalizing racial attitudes (Hopkins and Washington Reference Hopkins and Washington2020; Jardina and Ollerenshaw Reference Jardina and Ollerenshaw2022): even holding candidate partisanship constant, white Democratic participants’ reactions to Black candidate profiles were linked to their feelings about Trump more than to their feelings about Biden.
Is Electing Black Representatives a Substitute for Pro-Black Policy?
This paper has presented evidence that white Democrats’ newly developed preference for Black representatives is associated with their increasingly pro-Black attitudes. But is electing a Black politician a means to an end or an end in itself for these voters? Although descriptive representation carries both concrete and symbolic benefits for historically marginalized groups, it is by no means a substitute for policy interventions to address ongoing disparities. In the most extreme case, white voters could view the passive presence of Black politicians in office as preferable to active legislating if these voters’ underlying motivation is more focused on assuaging feelings of guilt over racial disparities than on improving material outcomes for Black Americans (Clemons Reference Clemons2022).
Figure 7 plots support for Black and white candidates disaggregated by each candidate’s stance on reparations—a policy that a large majority of Black Americans supports (Blazina and Cox Reference Blazina and Cox2022)—and by study participants’ own stance on the policy. This analysis depicts choices voters make when they must trade off between candidate identity and a race-related policy. The upper panels display results for participants who supported or said they were not sure about reparations.Footnote 6 The first two panels indicate that Black candidates fare significantly better than white candidates when the two candidates take different stances on this policy, indicating some willingness to sacrifice reparations policy to support Black candidates. However, participants still tended to prioritize policy over identity—when any candidate, Black or white, opposed reparations and their opponent supported the policy, these participants selected them less than 50% of the time. These results suggest that support for Black candidates reflects a broader, substantive commitment to racial justice among white Democratic voters rather than a narrow, purely symbolic preference for diversity in Congress. A majority of survey respondents who were at least open to the idea of a federal reparations program prioritized this policy over electing a Black representative.
Support for Candidates Based on Candidates’ Race and Candidates’ and Participants’ Stances on Reparations
Note: Error bars are 95% confidence intervals. Data are weighted for representativeness by age, gender, and region. Data are from Lucid studies 1 and 2. Results are presented in tabular form in Table C3 in the Supplementary Material.

Interestingly, as shown in the third column, the greatest difference in the fortunes of Black and white candidate profiles occurs when both candidates oppose reparations. In this case, participants who supported or weren’t sure about reparations selected the Black candidate profile 67% of the time. This suggests that voters who would like to see reparations enacted view Black descriptive representation as a “next best thing” if such a policy is completely off the table, perhaps because, as past research finds, they still view Black candidates as more likely to promote racial equity in other ways (Sigelman et al. Reference Sigelman, Sigelman, Walkosz and Nitz1995). Black candidates’ advantage disappears when both candidates support reparations, as shown in the rightmost top panel. This result further supports the interpretation that the election of Black candidates is, in part, a means to a policy end for white Democratic voters, since in the presence of a strong signal about the white candidates’ racial liberalism, candidates’ race factors significantly less into voters’ decision making.
The lower panels in Figure 7, which show results for participants who oppose reparations, indicate that Black candidates are not systematically disadvantaged among these voters. When the candidates’ stances differ, these participants show a preference in the direction that is consistent with their policy preference (although the preference is larger and only statistically significant when the congruent candidate is white), and when the two candidates’ stances are identical, there is not a significant racial preference in either direction. This is an important finding in itself, since it suggests that Black candidates are not disproportionately punished among less-racially liberal Democrats when they take a liberal stance on a race-related policy.
Alternative Explanation: Using Race to Infer Ideology
An alternative explanation for white Democrats’ increasing support for Black candidates is that rather than expressing their racial politics, this increasingly liberal group of voters could be using race to infer politicians’ ideological positions and appearing to prefer Black candidates when they are really seeking to support the more liberal candidate. Because measures of racial attitudes like racial resentment are correlated with ideology more broadly (Carmines, Sniderman, and Easter Reference Carmines, Sniderman and Easter2011), ideological stereotyping could be a confounding variable in the relationship between racial attitudes and support for Black candidates.
However, emerging evidence weighs against this interpretation. Recent research suggests that white Democrats do not perceive themselves to be more ideologically congruent with non-white members of Congress now than they did fifteen years ago, despite approving increasingly highly of them relative to similar white members of Congress (Weissman Reference WeissmanForthcoming). If this dynamic extends to evaluations of hypothetical candidates, then Black candidates should fare better than white candidates even when the two candidates are equally ideologically congruent with study participants.
To test these competing expectations, I provided explicit information about candidates’ ideological positions in the conjoint profiles in two studies, allowing me to control for differences in ideological congruence with the two candidates. 1,340 participants in the second Lucid study and all 543 white Democratic participants in the California voter study received this version of the conjoint table. As shown in Table C4 in the Supplementary Material, although all candidates are penalized for perceived incongruence, Black candidates are penalized marginally significantly less—the coefficient on the interaction between ideological incongruence and the candidate being Black is 11.6 percentage points (
 $ SE=6.5 $
percentage points). Combined with a significant positive main effect of the candidate being Black (
 $ \beta =8.2 $
percentage points,
 $ SE=3.6 $
), this means that the most-incongruent Black candidates fare significantly better than the most-incongruent white candidates.
Figure 8 visually presents this willingness to trade off ideological representation for racial identity by plotting the rates at which Black candidates were selected at each level of relative ideological congruence with the participant.Footnote
7 When the candidates are randomly assigned the same ideology, and thus are equally congruent (or incongruent) with the participant, the Black candidate was selected significantly more often—60% of the time (
 $ SE=2.1 $
). Voters faced with modest differences between the candidates in terms of ideological congruence traded off some degree of substantive representation to support Black candidates: Black candidates who were one scale point less congruent than their white opponent fared better than white candidates in a similar position by a margin of 13.4 percentage points (
 $ SE=3.5 $
) and were selected 41% of the time, compared with white candidates who were selected 28% of the time in this situation. When ideological differences between the two candidates were more extreme, voters were less willing to make this tradeoff and the differences in the rates with which they selected Black and white candidates are no longer statistically significant.
Relative Ideological Congruence and Support for Black Compared to White Candidates
Note: Error bars are 95% confidence intervals. Data are weighted for representativeness by age, gender, and region. Data are from Lucid Study 2 and the California voter survey. Results are presented in tabular form in Table C5 in the Supplementary Material.

In Table C5 in the Supplementary Material, I conduct the same analysis using participants’ perceptions of the candidate profiles’ ideologies. The explanatory variable here is measured post-treatment, but in combination with the results of exogenously manipulating profile ideology, the finding that white Democratic participants select Black profiles more often even when they themselves say that the candidates are identically close to them ideologically reinforces the argument that these voters’ preference for Black candidates does not solely reflect a strategy of using race to infer ideological closeness. When voters have explicit information about candidates’ ideological positions, they respond to this information, but their decisions also reflect a persistent influence of candidate race.
DISCUSSION
Over the last fifteen years, white Democrats’ attitudes toward Black Americans have become significantly more positive. Over the same period, Black congressional candidates have won election in more majority-white districts, contributing to a meaningful increase in Black representation at the national level, and white Democratic survey respondents have become more likely to select Black candidate profiles in simulated electoral contests. As this set of trends and the literature on white Americans’ preferences about candidate race both suggest, support for Black candidate profiles is associated with liberal racial attitudes including low racial resentment and, to an even greater degree, perceptions of anti-Black discrimination. This relationship is not an artifact of increasing overall liberalism of white Democrats, since these voters’ preference for Black profiles was not erased when accounting for ideological similarity with the candidates. On the other hand, the preference for Black candidates is associated with survey participants’ racial attitudes. As expected, dislike of Trump, but not ratings of Biden, was also associated with support for Black candidate profiles. Study participants were not rejecting the Republican party through their vote choice, since the candidate profiles were not only both Democrats but were, on average, equally liberal in their ideologies and policy stances. Rather, white Democrats could be rejecting Trump-branded racial conservatism through their support of Black candidates. This result suggests that Trump’s influence on white Democrats’ racial attitudes carries implications for intra-party as well as inter-party contestation.
These studies also demonstrate that candidate identity is not a substitute for policy for white Democratic voters. Between a white reparations supporter and a Black reparations opponent, voters who supported reparations opted for the policy-aligned candidate, despite preferring Black candidates all else equal. Racially liberal white Democrats do not treat voting for Black representatives as “cheap talk,” but appear to support them partly because they expect them to take action on race-related policy issues. Furthermore, white Democrats who opposed a federal reparations policy did not disproportionately penalize Black candidates for supporting such a policy, indicating that Black candidates may have as much latitude in taking stances on racially charged issues as white candidates (at least among Democratic voters).
Scholars of white identity politics and partisanship may also be interested in additional potential explanations for the shift in white Democrats’ voting behavior I have described. I explore several of these in a preliminary way in Section D of the Supplementary Material. Specifically, I analyze the relationship between support for Black candidate profiles and white group identity and Democratic identity and find limited evidence that either is significantly associated with preferring Black candidates. I also test whether white Democrats view Black primary candidates to be more competitive and thus back them for strategic reasons, but they do not appear to do so. Finally, I test for social desirability pressure in my own conjoint experiments as well as several others included in the meta-analysis and find little evidence that white Democratic survey respondents are voting for Black candidates because of perceived social pressure alone.
CONCLUSION
This research was motivated by a fundamental dilemma of majoritarian democracy: how marginalized and minoritized groups can achieve equitable representation. The studies presented in this paper show that over the last fifteen years, an electorally consequential subgroup of white Americans, white Democrats, have become increasingly willing to support Black political candidates. In fact, this group’s preferences have changed to such an extent that they now select Black candidates significantly more often than comparable white candidates. This startling reversal underscores that majority-group members can and sometimes do act to resolve the dilemma of minority-group representation. Moreover, this behavior does not appear to be entirely self-interested: a preference for Black candidates is not fully accounted for by inferences about candidates’ ideological positions, but is associated with perceptions of racial injustice. As white Democrats’ awareness of racial discrimination has increased over the last decade, so too has their support for Black candidates.
This research contributes to the intergroup attitudes and voting behavior literatures by showing that recent, dramatic shifts in white Democrats’ racial attitudes documented by others (Engelhardt Reference Engelhardt2021; Hopkins and Washington Reference Hopkins and Washington2020; Jardina and Ollerenshaw Reference Jardina and Ollerenshaw2022; Schram and Fording Reference Schram and Fording2021) extend beyond attitudinal measures to an important political behavior: candidate selection. The full extent and limitations of these behavioral implications remain to be explored. Future research might examine whether these patterns of behavior and motivation can help to explain voters’ preferences with regard to other identities, such as other racial identities, gender, sexuality, class, and immigration status. The origins of perceptions of racial injustice and sources of variation across individuals and over time should also be further investigated (Mo and Conn Reference Mo and Conn2018).
This project also carries an important practical implication, since it suggests that the conventional wisdom that motivates ongoing strategic discrimination on the part of party elites, as documented by Doherty, Dowling, and Miller (Reference Doherty, Dowling and Miller2022), no longer reflects voters’ preferences. The findings may also be useful for crafting effective campaign appeals, as they suggest that white Democrats do not penalize Black candidates for taking progressive stances on racial issues.
There are limitations to these studies that future work should address. Although suggestive, the analyses presented here do not constitute a causal test of the relationship between racial attitudes and support for Black candidates, which would require experimental manipulation of racial attitudes. Future research might build on this work by examining the effects of appeals to voters’ sense of justice on support for candidates of color. Future work should also more closely probe the relationship between Trump ratings and the specific racial attitudes studied here. Other promising avenues for ongoing research include estimating white support for Black candidates in real primary elections, moving beyond the Black–white binary to explore white voters’ reactions to other candidates of color, and expanding these analyses to understand how the proposed mechanisms function among white Republicans and Independents as well as Democrats.
SUPPLEMENTARY MATERIAL
To view supplementary material for this article, please visit https://doi.org/10.1017/S0003055425000097.
DATA AVAILABILITY STATEMENT
Research documentation and data that support the findings of this study are openly available at the American Political Science Review Dataverse: https://doi.org/10.7910/DVN/LMBY8P.
ACKNOWLEDGEMENTS
I would like to thank Antoine Banks, Martin Bisgaard, David Broockman, Andrew Engelhardt, Rebecca Goldstein, Eric Gonzalez Juenke, Joe Kendall, Yanna Krupnikov, Martin Vinæs Larsen, Gabriel Lenz, Cecilia Mo, Gregory Petrow, Michael Tesler, Omar Wasow, Anna Weissman, participants in the Political Behavior Lab and the Research Workshop in American Politics at UC Berkeley, the Political Behavior group at Aarhus University, participants at MPSA and APSA, and five anonymous reviewers for their feedback, advice, and support for this work. Thanks also to the authors who shared replication files. Any opinions, findings, and conclusions or recommendations expressed in this material are those of the author and do not necessarily reflect the views of the National Science Foundation.
FUNDING STATEMENT
This material is based upon work supported by the National Science Foundation Graduate Research Fellowship under Grant No. 1752814 and by the APSA/National Science Foundation Doctoral Dissertation Research Improvement Grant under Grant No. 054634. The author gratefully acknowledges additional funding from the Synar Graduate Research Fellowship from the Institute of Governmental Studies, a Graduate Research Award from the Citrin Center for Public Opinion Research, and a Research Grant from the Center for the Study of American Democracy, all at UC Berkeley.
CONFLICT OF INTEREST
The author declares no ethical issues or conflicts of interest in this research.
ETHICAL STANDARDS
The author declares the human subjects research in this article was reviewed and approved by the IRB at the University of California, Berkeley and certificate numbers are provided in the text of the article. The author affirms that this article adheres to the principles concerning research with human participants laid out in APSA’s Principles and Guidance on Human Subject Research (2020).





 Open access


Comments
No Comments have been published for this article.