This paper is the second of a three-part series dealing with quantitative indicators of impact and prominence in the political science discipline. In these essays, we assess some of the changes in the discipline since the publication of the Somit and Tanenhaus (1963; 1964; 1967) studies that cover the first 60 years of the twentieth century. In the first paper of the series, published in the January 2007 issue of PS (Masuoka, Grofman, and Feld 2007), we focused on the individual visibility and impact of all regular faculty in Ph.D.-granting departments by using SSCI-based cumulative citation counts to their lifetime work. In particular, we identified the 400 most-cited faculty members in the discipline, and we found that citation counts are strongly influenced by factors such as date of Ph.D., subfield, and gender.1
Emails received by the authors since the publication of “The Political Science 400: A 20-Year Update” (Masuoka, Grofman, and Feld 2007) called attention to mistakes in the citation counts of a number of scholars. Corrections to the citation counts are posted in an EXCEL file at www.socsci.uci.edu/∼bgrofman/. Once we have entered all corrections, an erratum will appear in a later issue of PS. Please address any corrections to that article to BGrofman@uci.edu.
The remainder of the paper is organized into three sections. In the first, we provide an overview detailing the changes that have occurred in the discipline over the period 1902–2000. We do this by spelling out some general time trends in political science Ph.D. production and placement over the last century. We update data on various overall trends identified by Somit and Tanenhaus, and complement their analyses by providing a breakdown by region (Northeast, West, Midwest, South); by type of institution (public versus private); and by old producers (pre-1930 Ph.D.-producing departments) versus newer entrants. In the second section, we consider the direct consequences that result from these changing characteristics of the discipline, such as the likelihood that political science Ph.D.s will get jobs at Ph.D.-granting institutions. In the third section, we look at department-specific production and placement patterns. We conclude with a discussion of our findings as they relate to the degree of elitism in the production and placement of political science Ph.D.s in the later as compared to the earlier part of the twentieth century.
However, there is one major limitation to our analysis which we would like to make clear to the reader. We recognize that our portrait of the discipline is not comprehensive as we only consider Ph.D.-granting departments in our analysis. Due to the fact that our primary units of analysis are Ph.D.-production and -placement rates, we excluded all schools that do not have a Ph.D. program from our dataset. This does not mean that non-Ph.D.-granting schools fail to make a significant contribution to the discipline, rather it is that our measures do not allow us to include these schools.
I. General Time Trends and Patterns in the Production and Placement of Ph.D.s, 1902–2000
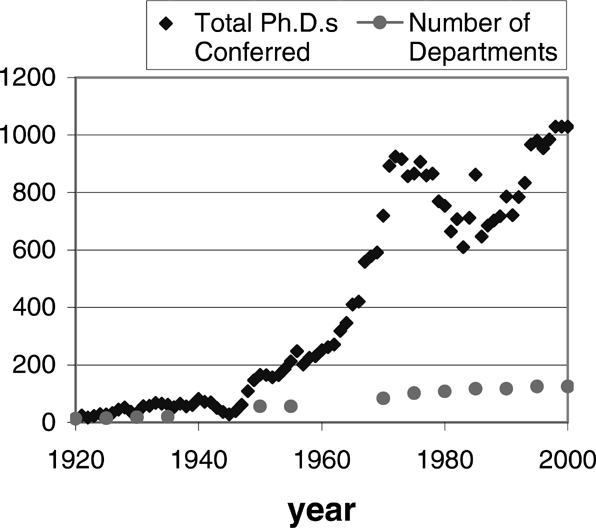
Figure 1 shows us an almost uninterrupted explosive pattern of growth in the number of U.S. political science Ph.D.s produced yearly over most of the course of the twentieth century. In particular, with the exception of limited growth in the 1940s (and an actual dip during WWII), Ph.D. production more than doubles between 1920 through 1930, doubles again in the 1930–1939 period, nearly triples—the greatest increase of all—in the 1950s, and then further doubles in the 1960s, and then again in the 1970s. Although there is a brief period of mild decline in numbers of yearly Ph.D.s produced during part of the 1980s, by the late 1980s we see a return to increases in Ph.D. production, albeit at a much more modest rate—with growth in the 1990s averaging a little under 3% annually.2
Figure omitted due to space restrictions. This and other omitted figures and tables are posted on our web site: www.socsci.uci.edu/∼bgrofman/.

Number of Ph.D-Granting Departments and Number of Ph.D.s Produced, 1920–2000
The overall general pattern of greatly increasing numbers of political science Ph.D.s is paralleled by a concomitant increase in the number of Ph.D.-granting institutions3
Note that we are taking as our set of Ph.D.-granting departments those which produce at least one Ph.D. in the time period in question. This omits departments which may have a Ph.D. program on the books, but whose Ph.D. production is dormant at the time.
Figure omitted due to space restrictions. See Note 22.
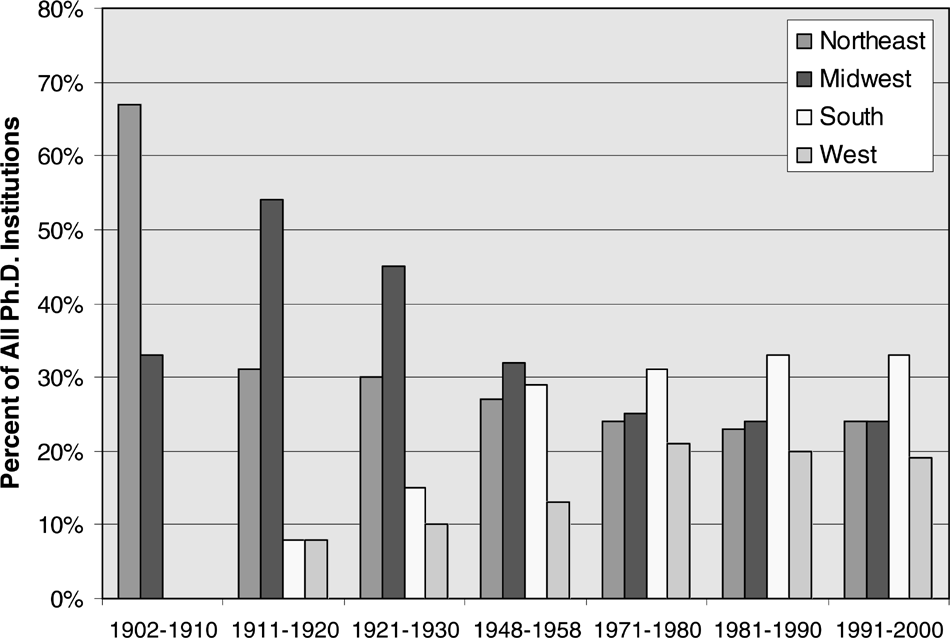
As shown in Figure 2, in the early decades of the discipline, political science Ph.D. production was largely confined to institutions located in the Northeast and Midwest. Today, Northeastern and Midwestern schools total less than half of all Ph.D.-producing programs in the U.S., producing just barely above half of all Ph.D.s. In the South and West, growth in both numbers of Ph.D. departments and share of Ph.D. production has paralleled regional population growth. For example, the West's population grew roughly 13 fold, from about four million in 1900, to 52.7 million in 2000; the number of Western Ph.D.-granting universities grew by a factor of 12 over this same time period, from two to 24.5
Regional differences in placement also remain higher than the regional differences in production. In particular, the Northeast continues to train over one third of all the faculty employed in U.S. Ph.D.-granting political science departments; while the South is dramatically underrepresented in placements (an 18% share) compared to production (a 33% share). We coded states into the four major geographic regions (Northeast, South, Midwest, and West) as defined by the U.S. Census. For a list of these four census regions, please see: www.census.gov/geo/www/us_regdiv.pdf.

Regional Distribution of Ph.D Institutions, 1902–2000
Private institutions have seen a declining role in Ph.D. production. For example, in the first decade of the twentieth century, while only a third or so of the Ph.D.-granting institutions were private, 85% of Ph.D.s were produced by private institutions; but by the last decade of the twentieth century, we find near parity of production among public and private institutions. However, private schools continue to place more than their share of graduate students in Ph.D.-granting institutions. In the period 1960–1969, 42% of all placements at Ph.D.-granting institutions were graduates of private universities; that percentage rises to 52% in each of the three succeeding decades. Here, as seen in the early history of the discipline, private institutions are represented slightly out of proportion to their share of Ph.D.-granting departments. But, it is important to note that the continued greater success of private institutions is largely due to the production numbers and placement success of a small number of elite institutions, such as Harvard, Columbia, Yale, etc.
Ph.D. production began to democratize with the creation of new Ph.D.-granting departments,; however, the production share of “old” (pre-1930 Ph.D.-producing) departments, remained substantial despite the fact that these departments became an increasingly smaller percentage of all departments.6
Departments that we classified as “old” departments are: University of California system (Berkeley and Los Angeles), University of Chicago, Columbia University, Cornell University, Harvard University, University of Illinois-Urbana Champaign, Indiana University, University of Iowa, Johns Hopkins University, University of Michigan, University of Minnesota, University of North Carolina-Chapel Hill, Ohio State University, University of Pennsylvania, Princeton University, Stanford University, University of Texas-Austin, Washington University-St. Louis, University of Wisconsin, and Yale University. All other departments are classified as “new” departments.
II. Two Direct Consequences of the Expansion of the Discipline
The dramatic growth in the number of both Ph.D.-granting departments and conferred degrees in the latter part of the twentieth century (see, again, Figure 1) has created major changes in the age profile of the discipline. The rapid growth in the profession in the immediate post-WWII period led Somit and Tanenhaus (1963, 938) to emphasize the youthfulness of the discipline circa 1961, with 71% of then-living political scientists (and 79% of those employed at academic institutions) having received their Ph.D. degrees within the previous 15 years. Similarly, the very earliest days of the profession sported a youthful demographic—judging age by time from Ph.D.—since Ph.D.s were being created largely ex nihilo. Looking circa 2000, however, we see a much older profession. For example, only 32% of those employed at Ph.D.-granting institutions received their degree in the previous 15 years, while 53% had received their Ph.D.s 25 or more years earlier.
Because the increase in the number of Ph.D.-granting institutions has not been as steep as the increase in the number of Ph.D.s produced, perhaps the most important consequence of the discipline's expansion is that it has become increasingly inevitable that most Ph.D.s must take a job at something other than a Ph.D.-producing department. It would take only five years of political science Ph.D. production at current rates (with an average yearly production rate between 1990–1999 of 846) to fill all the roughly 4,000 positions in the 132 Ph.D.-granting departments.
III. Differences across Individual Departments in Ph.D. Production and Placement, with a Focus on the Period from 1960 through 2000
While the political science discipline has witnessed significant growth over the last century, it is still unclear how this growth has changed the culture of the discipline. Looking at data from 1961 and earlier, Albert Somit and Joseph Tanenhaus, the two leading scholars on the history of the discipline, characterized political science as effectively bifurcated between top Ph.D.-granting departments and other Ph.D.-granting departments, with Ph.D.s from lower ranked institutions frozen out of careers at the elite departments:
We have been accustomed to speaking of the Ph.D. as a ‘union card.’ … But we might be closer to reality if we recognized the existence of two types of doctoral credentials. One type does not insure appointment to the best departments, but at least makes it possible; the other, with rare exceptions makes the bearer an academic untouchable in these departments. (Somit and Tanenhaus 1963, 938)
Thus, the culture of the discipline through the first half of the century was characterized by a striking degree of elitism; not all departments were considered equal. Our chief concern in this section of the paper is to examine the extent to which this portrait of political science remains accurate today. Has the expansion of Ph.D.-granting departments in the discipline resulted in greater democratization of Ph.D. placements? In seeking to address this issue, we look at patterns of Ph.D. production7
For Ph.D. production, we have yearly data at the aggregate level from 1910 through 2000 (Department of Education 2005; Gaus 1964; National Academy of Sciences 1958; 1978; National Science Foundation 2005). For Ph.D. production at the departmental level, we integrate data reported by Somit and Tanenhaus (1964; 1967), and that in two early articles published in the APSR (Gaus 1964; Munro 1930) for the period 1902–1933, with data for the periods 1948–1958 and 1966–2001 taken from statistics provided by the National Science Foundation, National Academy of Sciences, and Department of Education's National Center for Education Statistics. This allows us to look at seven essentially decade-long periods of Ph.D.-production data by department: 1902–1910, 1911–1920, 1921–1930, 1948–1958, 1971–1980, 1981–1990, and 1991–2000.
For placements, because of data gathering constraints, we have confined ourselves to placements of U.S. Ph.D.s within U.S. Ph.D.-granting departments, and to the period 1960–2000, combining the information provided in the APSA's (2000) Graduate Faculty and Programs in Political Science with supplementary information on faculty taken as needed from the APSA (2002) Directory of Political Science Faculty, 2002–2004. These directories list all full- and part-time faculty employed in political science departments in the U.S., providing us with a census of all employed faculty in Ph.D.-granting departments. We look at data aggregated by decade from the most recent four decades of Ph.D. cohorts: 1961–1970, 1971–1980, 1981–1990, and 1991–2000. As of 2000, there were 4,103 regular faculty members in the 132 Ph.D.-granting departments in political science in the U.S. For our analysis, we excluded the 168 (4%) faculty members who did not receive their Ph.D.s from one of these schools, and we also had to exclude 312 (8%) faculty members for whom we were unable to find information regarding their educational background. Thus, our dataset includes 3,623 faculty members employed in 132 Ph.D.-granting political science departments in the U.S. Of these, 275 (8%) are presently employed at the same institution from which they received a Ph.D.
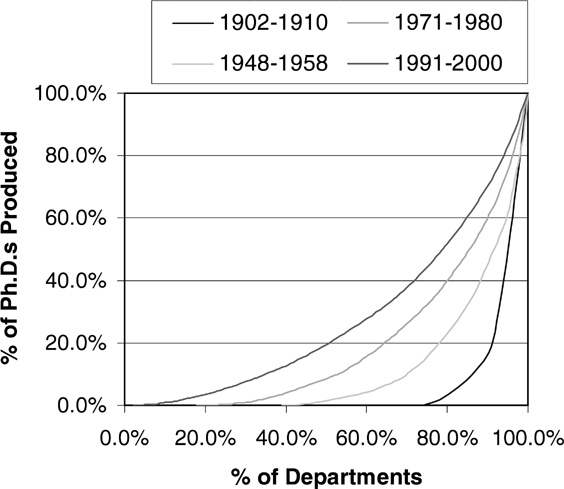
To begin, we compare changes in both Ph.D.-production and -placement rates over the last four decades in order to identify any shifts in inequality since the Somit and Tanenhaus studies. Using Lorenz curves, we find that the growth in the number of Ph.D. institutions has been accompanied by a general pattern of decreasing inequalities in production. Still, for the four decades in the twentieth century for which we have reported complete or near complete data, we can also read from the family of Lorenz curves shown in Figure 3 that departmental Ph.D.-production rates are far from uniform. In every decade, the 50% of departments that are below the median in number of Ph.D.s produced have produced no more than 20% of the Ph.D.s, and usually much less. Thus, despite some increasing equality in Ph.D.-production patterns, great inequality across departments remains the norm.

Four Decades of Lorenz Curves for Ph.D. Production
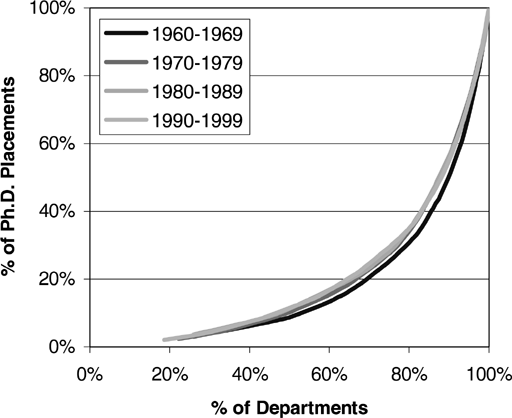
Moreover, exactly as we would expect, certain departments have been much more effective at placing students at a Ph.D.-granting department. We find that, unlike what we find for placement, high Ph.D.-placement rates are concentrated among a limited number of departments. When we look by decade at Lorenz curves of Ph.D. placements by department in each of the four decades from 1960 to 2000 (see Figure 4), we find a much higher level of inequality than that for the corresponding decade of production data, with virtually no change over the 40-year period. More specifically, each of the four Lorenz curves for Ph.D. placements in Figure 4 is located roughly between the 1901–1910 and the 1948–1958 Lorenz curves for Ph.D. production shown in Figure 3.

Four Decades of Lorenz Curves for Ph.D. Placements
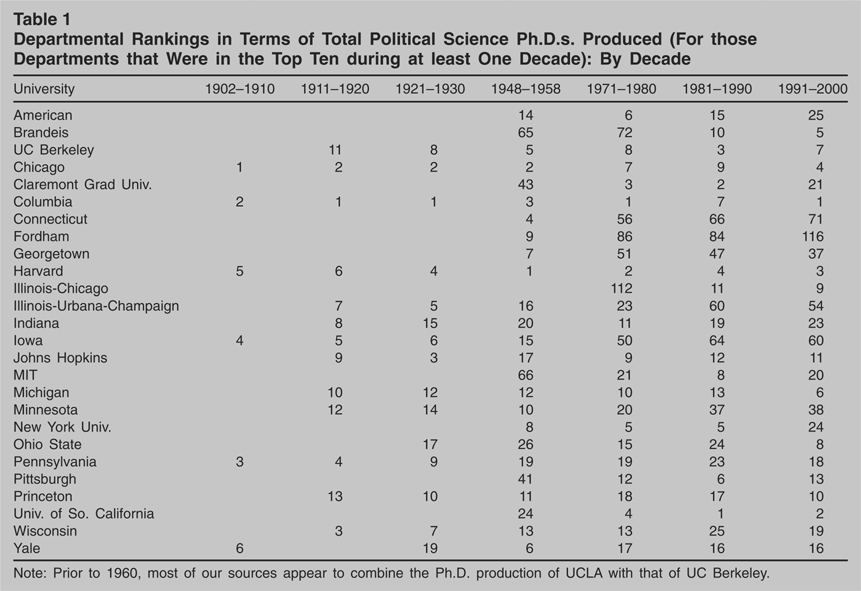
Turning to data on individual-department placement and production rates, we can identify the specific departments that have largely dominated the discipline in terms of Ph.D.-production and -placement rates. Table 1 presents a list of departments by number of Ph.D.s produced for the various decades in the twentieth century for which we have data.9
The total Ph.D.-production rates include Ph.D.s in political science, public administration, and public policy. We derived our Ph.D.-production data from reports provided by the National Science Foundation, National Academy of Sciences, and Department of Education's National Center for Education Statistics, which combine conferred Ph.D.s in all three fields and do not allow further disaggregation. Thus, the Ph.D.-production rates for schools that have Ph.D. programs in public policy or public administration are systematically larger than the production rates of schools with only a political science graduate program. However, we feel that this is the most reliable data available that provide Ph.D.-production rates across all schools.
Departmental Rankings in Terms of Total Political Science Ph.D.s. Produced (For those Departments that Were in the Top Ten during at least One Decade): By Decade

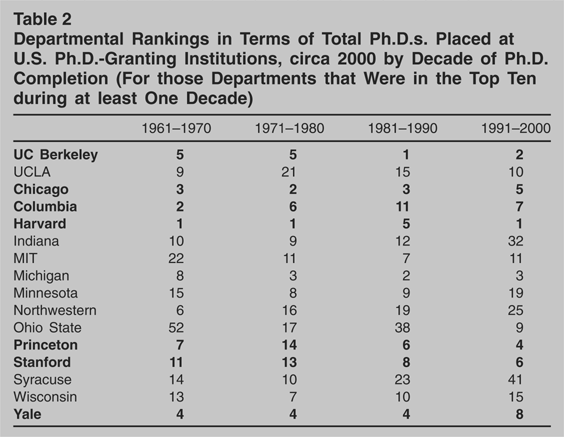
There is even more consistency across the past four decades of the twentieth century (ones for which we have data at the departmental level) in the set of departments that are successful in placing large numbers of their students in other Ph.D.-granting department. Yet, if we compare Tables 1 and 2, we find that many of the departments that produce large numbers of Ph.D.s are not that successful in placing their graduates in Ph.D.-granting institutions. There were 26 different departments which made the top 10 in terms of production during at least one decade between 1902 and 2000. However, in terms of placing their students in Ph.D.-granting institutions in the U.S (circa 2000), only 12 of these 26 top Ph.D.-producing departments made the top 10 placement list in any of the four decades between 1960 and 2000 (see Table 1). Of these 12, when we pool the data over the four decades shown in Table 1, we find eight departments emerging at the top. These eight (Berkeley, Chicago, Columbia, Harvard, Michigan, Princeton, Stanford, Yale) are shown bolded in Table 2.
Departmental Rankings in Terms of Total Ph.D.s. Placed at U.S. Ph.D.-Granting Institutions, circa 2000 by Decade of Ph.D. Completion (For those Departments that Were in the Top Ten during at least One Decade)

From a historical perspective, particularly interesting omissions from Table 2 are departments such as Johns Hopkins, Illinois-Urbana-Champaign, Iowa, and Penn, which were among the most prestigious departments in the early days of the discipline (see Somit and Tanenhaus 1967, 105). Also, the changes downward in the period covered in Table 1 in the rankings of schools like Indiana, Northwestern, and Syracuse, and the upward shifts for MIT and Ohio State, are perhaps as striking as the general stability in the rankings of the eight core departments.
The top eight Ph.D.-producing departments that we have previously identified, which we will refer to as the “big eight,” exert powerful influence on the profession by directly or indirectly shaping the faculty who train the discipline as a whole. We say that a set of departments A, majority dominates a department j, if a majority of the faculty teaching at j received their Ph.D.s from any of the departments in set A; while A is said to indirectly (at one remove) majority dominate j if A does not majority dominate j, but a majority of the faculty at j either were trained by A or were trained at departments the majority of whose faculty came from A. We define indirect majority dominance at the kth remove in like manner.10
The discussion in the paragraph immediately below is a much-abbreviated synopsis of a paper by the present authors on vertical networks and direct and indirect majority dominance. Readers are referred to that essay (Grofman, Feld and Masuoka 2005) for more details.
We further explore this theory of majority dominance in the subsequent paper of the series to be published in July.
Moreover, these 40 departments include most of the departments which place high numbers of faculty at other Ph.D.-granting departments (19 out of the top 30 in placements), and thus the big eight can be expected to indirectly shape additional departments in whose faculty their Ph.D.s do not comprise a majority, but whose faculty come either from the big eight or from departments where big eight-trained faculty constitute the majority. Indeed, when we look at this next tier of penetration, we find an additional 62 schools where a majority of faculty come either from the big eight or from schools where big eight faculty make up a majority. Thus, 103 of the 132 departments in political science (78%) are either directly or at first remove majority dominated by the big eight. Moreover, all of the major Ph.D.-producing departments fall into this set of 103. And, finally, all departments in political science are either directly or at first or second remove majority dominated by the big eight.
However, there are some regional differences. While all but a handful of schools in the Northeast and the West are directly or indirectly dominated by the big eight, and an overwhelming majority of the schools in the Midwest are also directly or indirectly dominated by the big eight, only 59% of the Southern schools are directly or indirectly dominated by the big eight. The rest of the Southern schools are majority dominated by the big eight only at second remove. Thus, to paraphrase V. O. Key, Southern schools are different—they are more insular than the rest of the profession. But, even they are only somewhat insulated from the powerful influence of the top-placing schools.
For the big eight departments we identified, the ratio of students placed in Ph.D.-granting institutions to the total Ph.D.s produced for the period 1966–2000 was still only 0.32, i.e., we may estimate that something like 68% of the Ph.D.s produced by the big eight did not have jobs in Ph.D.-granting departments circa 2000—most likely a majority of Ph.D.s are placed at non-Ph.D.-granting schools for which we do not have data, or in non-academic jobs. Thus, even for the most elite departments, most programs do not place students at a Ph.D.-granting school. On the other hand, there were a handful of departments, mostly ones that offered one or more specialized programs, which, while not producing that many students, nonetheless were effective (circa 2000) at placing their graduates in jobs at U.S. Ph.D.-granting departments. In particular, Cal Tech (an incredible 95% placement to production ratio over the period 1966–2000), UC San Diego (55%), Washington University-St. Louis (39%), SUNY Stony Brook (38%), and UC Irvine (34%) are some of the schools that fall into this category.12
Table omitted due to space restrictions. See Note 22.
IV. Discussion
While for the period studied by Somit and Tanenhaus (1963; 1964; 1967), the top Ph.D.-granting departments (as judged by prestige rankings) tended to be entirely self-enclosed, hiring from themselves and each other (or, in the very early days, from Europe), the pattern of elite dominance in placements has been somewhat mitigated so that there are now more U.S. institutions that are able to make some placements at the very top of the profession. For example, looking only at U.S.-trained Ph.D.s, Somit and Tanenhaus (1964, 43) point out that, circa 1961, “less than 5 percent of the faculty at the top 11 departments come from outside the top eleven,” and that “the exceptions occur almost entirely among the institutions in the lower half of the group.” In contrast, looking at the faculty composition of Ph.D.-granting departments circa 2000, while the big eight departments identified above tend to hire largely from each other, the mean proportion of hires from within the set is only 77%, ranging from 90% (Berkeley) to 61% (Stanford). Even if we go to the top 11 producers, circa 2000, the mean proportion of hires within the set is only 79%, with a low of 63% (Minnesota) and the high remaining at 90% (Berkeley).
Still, even these numbers demonstrate a pattern of largely encapsulated hiring. Moreover, the big eight are also the eight schools with the highest number of placements at the big eight. And the schools which provide most of the relatively limited exceptions to the rule of self-enclosed hiring practices at the big eight are high prestige institutions themselves, like MIT, Rochester, UCLA, Duke, Cornell, Northwestern, and UC San Diego. Indeed, data on prestige rankings of departments reported in Somit and Tanenhaus (1967, Table 2, 164) leads us to believe that, of the eight institutions we have labeled as core departments circa 2000, all but Yale and Stanford were probably already among the top 10 departments in ability to place students as far back as 1925. Of course, as noted earlier, our data here only speaks to Ph.D. production and placement and thus are restricted to Ph.D.-granting institutions.
In sum, there has been a dramatic expansion in the number of Ph.D.-granting institutions, and in the number (and proportion) of Ph.D.s produced by “newly arrived” departments. But, despite some changes from the profession's early decades, the set of schools that dominate placements in Ph.D.-producing departments has been much less affected over the past 40 years. This lack of change over four decades suggests that the inequalities in placements across Ph.D.-granting departments found at the turn of the twenty-first century are likely to persist. The pervasiveness in the profession of Ph.D.s trained at elite departments occurs through the numbers of students trained at these institutions, but also through the dispersion of their graduates: they majority dominate most of the top institutions directly and the remainder of the discipline indirectly. When we take departments as our units, what we find in political science is a pattern of democratic expansion in production coupled with a continued elite dominance in placements that is only somewhat diminished from what was true in the profession's earliest times.
Author Bios
Natalie Masuoka is a Ph.D. candidate at the University of California, Irvine. Her dissertation examines the impact of mixed race identities on racial minority political participation and attitudes.
Bernard Grofma, whose past research has dealt with mathematical models of group decision making, legislative representation, electoral rules, and redistricting, has been at the University of California, Irvine since 1976 and professor of political science at UCI since 1980. He is co-author of four books, published by Cambridge University Press, and co-editor of 16 other books; he has published over 200 research articles and book chapters. Grofman is a past president of the Public Choice Society and in 2001 he became a fellow of the American Academy of Arts and Science.
Scott L. Feld, professor of sociology at Purdue University, continues his investigations into systematic causes and consequences of patterns in social networks, including academic placement networks. He is also continuing to study how collective decision making processes are affected by social structures in the forms of group memberships, norms, and social networks.