The predominant milk production system in tropical regions is based on pastures, meaning that the dairy Zebu breeds and their crosses are the main genetic option for these systems. One peculiarity of pasture-based milk production systems is the nutritional limitation to maximum milk yield of the animals. According to Santos et al. (Reference Santos, Martinez, Greco, Carareto, Penati, Carvalho and Santos2007), the maximum yield is approximately 14 kg milk/d for cows exclusively fed tropical forages and 30 kg milk/d for cows receiving concentrate feeds as supplement on intensively managed tropical pastures. Therefore, one important factor that needs to be improved simultaneously with total milk yield in dairy cattle breeding programs that address milk production on tropical pastures is persistency of milk yield, since this would permit one to increase milk production by genetically modifying the shape of the lactation curve. As a consequence, more persistent cows would produce larger amounts of milk during lactation without the need to increase peak yield, which is limited in pasture-based production systems.
Although selection for higher milk yield simultaneously promotes an increase of food intake by the animals, medium-high production cows at the beginning of lactation are unable to consume sufficient feed to meet their nutritional requirements, a fact resulting in a negative energy balance and the mobilisation of body reserves. These factors may compromise reproductive activity and increase the susceptibility to metabolic diseases (Butler, Reference Butler2000). As a consequence, cows with lower production at the beginning of lactation and higher persistency will be subject to less physiological stress, thus minimising the incidence of reproductive problems and metabolic disorders (Togashi & Lin, Reference Togashi and Lin2004).
Studies have reported favourable genetic associations of persistency with some reproductive traits and disease susceptibility and unfavourable associations with other traits like calving interval (Jakobsen et al. Reference Jakobsen, Rekaya, Jensen, Sorensen, Madsen, Gianola, Christensen and Pedersen2003; Muir et al. Reference Muir, Fatehi and Schaeffer2004; Harder et al. Reference Harder, Bennewitz, Hinrichs and Kalm2006). Appuhamy et al. (Reference Appuhamy, Cassell, Dechow and Cole2007, Reference Appuhamy, Cassell and Cole2009), studying associations between the incidence of diseases and a measure of persistency that is independent of total milk yield, concluded that persistency appears to be affected by the incidence of diseases and not vice-versa.
The most recent definition of persistency are based on predicted breeding values for yield as a function of days in milk obtained with random regression models (Jakobsen et al. Reference Jakobsen, Madsen, Jensen, Pedersen, Christensen and Sorensen2002; Pereira et al. Reference Pereira, Verneque, Lopes, Santana, Lagrotta, Torres, Vercesi Filho and Machado2012). However, most of these measures show medium to high genetic correlations with milk yield. According to Cole & Null (Reference Cole and Null2009), selection based on a measure of persistency that shows a high and positive genetic correlation with milk yield is contradictory because of the negative association between disease resistance and milk yield. Therefore, measures of milk yield persistency that are independent of total milk yield and that are easily obtained and interpreted, as proposed by Cole & Vanraden (Reference Cole and Vanraden2006), are desired.
Given the occurrence of short lactations (less than 200 d), a genetic peculiarity of the dairy Zebu breeds (Pereira et al. Reference Pereira, Bignardi, El Faro, Verneque, Vercesi Filho and Albuquerque2013), breeders use lactation length as a measure of persistency. However, the measures of milk yield persistency proposed around the world are related to shape of lactation.
Kamidi (Reference Kamidi2005) proposed a measure of milk yield persistency obtained from a simple quadratic model that was used to fit cumulative yield across lactation. According to the author, this measure is phenotypically independent to total yield. However, we found no genetic association studies using this measure of persistency. Therefore, the objective of the present investigation was to estimate genetic parameters for a measure of milk yield persistency (Kamidi, Reference Kamidi2005) to better understand it under the genetic point of view, and to evaluate its associations with 305-d cumulative yield and lactation length of dairy Gyr cattle.
Materials and methods
The data used in this study were obtained from the Official Dairy Control Service of Gyr cattle, which are stored in the Brazilian National Dairy Cattle Archive (Arquivo Zootécnico Nacional) managed by National Center for Dairy Cattle Research (Embrapa Gado de Leite) – Brazil. A total of 157 933 test-day milk yield records from 8202 dairy Gyr cows, recorded between 1988 and 2010, were used. The following criteria were established for inclusion of the information in the data set: age at calving ranging from 22 to 150 months; first test performed within 45 d after calving; intervals between test days less than 45 d; a minimum of four test-day records per lactation; only complete (finished) lactations. Records of cows with 305-d cumulative milk yields or a lactation length outside the mean ± 3 standard deviations were eliminated from the study. The months of calving were divided into four seasons: rainy season (December, January and February); transition between rainy and dry season (March to May); dry season (June to August), and transition between dry and rainy season (September to November).
The following traits were studied: persistency of milk yield until 305 d (P), lactation length (LL), and 305-d cumulative milk yield (Y305).
Cumulative milk yield across lactation can be represented graphically by a curve that resembles the initial path of a projectile under gravity. On the basis of this analogy, Kamidi (Reference Kamidi2005) proposed a measure of milk yield persistency obtained from a simple quadratic model as follows: y = βt + γt 2 + ε (Model 1), where y is cumulative milk yield until day t of lactation, β and γ are constants, and ε is a random error associated with the model. β is a parameter that corresponds to the estimated peak milk yield and is highly associated with complete lactation cumulative yield. The deceleration constant γ is associated with the decline in milk yield after peak lactation. Deceleration in yield across lactation is the value of the second derivative (Kamidi, Reference Kamidi2005):
 $${{\rm d}^2}y/{\rm d}{t^2} = 2{\rm \gamma} $$
In theory, if the deceleration constant γ = 0, there is no decline in daily milk yield across lactation and the cumulative yield curve becomes a line. However, during normal lactation the milk yield is expected to decrease after peak lactation and γ will thus be negative. Persistency of milk yield is inversely proportional to yield deceleration and the minimum decline or maximum persistency will occur when γ = 0 (Kamidi, Reference Kamidi2005). Therefore, a per cent measure of milk yield persistency can be obtained by P = 100 (1 + 2γ) (Kamidi, Reference Kamidi2005).
Cumulative test-day milk yields are characterised as time series data, i.e., observations (phenotypic records) obtained sequentially over time (lactation). Since the assumption of independence between residuals is frequently not true for this type of data set, the Durbin-Watson test was used to identify first-order residual autocorrelation, adopting a level of significance of 1%. Thus, a first-order autoregressive model was used to obtain individual deceleration constants (γ). The general model can be described as:
 $${y_{ij}} = {{\rm \beta} _i}t + {{\rm \gamma} _i}{t^2} + {\rm \varphi} {{\rm \varepsilon} _{ij - 1}} + {{\rm \varepsilon} _{ij}}$$
where y ij is the jth observation of cumulative milk yield until day t of lactation of cow i; βi and γi are parameters of the cumulative yield curve of cow i; ϕ is the first-order autoregression coefficient; εij−1 is an error associated with observation j−1 of cow i, and ε is a random error associated with observation j. On the basis of parameter γi, individual persistency (Pi) was calculated as follows:
 $${P_i} = 100(1 + 2{{\rm \gamma} _i})$$
After the confirmation of data consistency and calculation of the measure of persistency, 12 346 records from 8202 cows, daughters of 802 sires, were used. The cows belonged to 220 herds located mainly in the southeastern region of Brazil, but also in the northeast, centre-west and south of the country. The pedigree was traced back 5 generations, resulting in a pedigree file containing 16 892 animals.
To know the average daily milk yield curves of cows with different levels of persistency, lactation curves were obtained by fitting test-day yields of the cows that participated in the study using a logarithmic Ali and Schaeffer function (Ali & Schaeffer, Reference Ali and Schaeffer1987).
Two analyses were performed, one including only first lactations (AN1) and the other including lactations up to fifth calving (AN5). A three-trait multivariate model was used for analysis of the traits, which can be described in matrix form as follows: Y = Xb + Za + Wp + e, where y is the vector of observations; b is the vector of systematic effects (contemporary group defined by herd-year-season of calving and linear and quadratic effects of age of cow at calving); a is the vector of random additive genetic effects; p is the vector of random effects of the permanent environment; e is the vector of the random residual effect, and X, Z and W are incidence matrices corresponding to the observations for systematic, random additive genetic and permanent environmental effects. The following assumptions were made for this model:
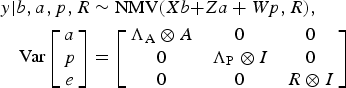 $$\eqalign{& y \vert b,a,p,R \sim {\rm NMV(}Xb{\rm +} Za + Wp,R{\rm ),} \cr & \quad {\rm Var}\left[ {\matrix{ a \cr p \cr e \cr}} \right] = \left[ {\matrix{ {{\Lambda _{\rm A}} \otimes A} & 0 & 0 \cr 0 & {{\Lambda _{\rm P}} \otimes I} & 0 \cr 0 & 0 & {R \otimes I} \cr}} \right]}$$
where ΛA, ΛP and R are, respectively, the additive genetic, permanent environmental and residual covariance matrices for the traits; A is the numerator relationship matrix; I is an identity matrix, and ⊗ is the direct product between matrices. For analysis of AN1, vector p and its corresponding matrix W were excluded from the model. The prior distributions assumed for the parameters of the model were:
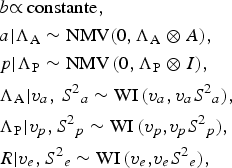 $$\eqalign{& b{\rm \propto} \,{\rm constante,} \cr & a \vert {\Lambda _{\rm A}} \sim {\rm NMV(0,}\,{\Lambda _{\rm A}} \otimes A{\rm ),} \cr & p \vert {\Lambda _{\rm P}} \sim {\rm NMV}\,{\rm (0,}\,{\Lambda _{\rm P}} \otimes I{\rm ),} \cr & {\Lambda _{\rm A}} \vert {v_a},\,{S^2}_a \sim {\rm WI}\,{\rm (}{v_a}{\rm,} \,{v_a}{S^2}_a {\rm ),} \cr & {\Lambda _{\rm P}} \vert {v_p},{S^2}_p \sim {\rm WI}\,{\rm (}{v_p}{\rm,} {v_p}{S^2}_p {\rm ),} \cr & R \vert {v_e},{S^2}_e \sim {\rm WI}\,{\rm (}{v_e}{\rm,} {v_e}{S^2}_e {\rm ),}} $$
where NMV and WI indicate multivariate normal and inverted Wishart distributions, respectively, and v a,S 2a, vp,S 2p and v e,S 2e correspond to the confidence level and prior values for additive genetic, permanent environmental and residual covariances, respectively.
Inferences on the parameters of interest were made based on their corresponding marginal posterior distributions using Gibbs sampling. For each analysis, two chains of 1 000 000 samples each were generated. Using a burn-in period of 50 000 samples and thinning interval of 50, inferences were made on the remaining 19 000 samples. The GIBBS2F90 program (Misztal, Reference Misztal2011) was used for analysis and convergence was monitored using the boa package of the R software (Smith, Reference Smith2007).
In addition, two-trait analysis (Y305 and P) was performed to obtain statistical evidence of the genetic association between these two traits. The deviance information criterion (DIC) (Spiegelhalter et al. Reference Spiegelhalter, Best, Carlin and Van Der Linde2002) was calculated for the model including additive genetic covariance (COVadd) between traits (MCOV1) and for the model without this component (COVadd fixed at zero) (MCOV0). Thus, the DIC for each model was obtained by:
 $${\rm DIC =\;} \bar D{\rm (\theta ) +} {\,p_{\rm D}} = 2\bar D {\rm (\theta )}{\rm -} D{(\bar{ \rm \theta} )}$$
where  $\bar D({\rm \theta} ) = {E_{{\rm \theta} \vert y}}[D({\rm \theta} )]$ is the posterior expectation of Bayesian deviance and D(θ)
 $=$ −2log p(y|θ) indicating the goodness-of-fit of the model. The effective number of parameters represents a penalty for increasing model complexity:
 ${p_D} = \bar D({\rm \theta} ) - D({\bar {\rm \theta}} )$, where θ is the vector of model parameters and
 $D({\bar {\rm \theta}} )$ is the Bayesian deviance evaluated at the posterior mean of the parameters. The model providing the lowest DIC value is the most adequate. A difference in DIC values higher than 7 units was considered to be important (Spiegelhalter et al. 2002).
The genetic trend in P was estimated by linear regression of predicted breeding values of the animals (sires and cows) on their years of birth considering the period from 1985 to 2006.
Results and discussion
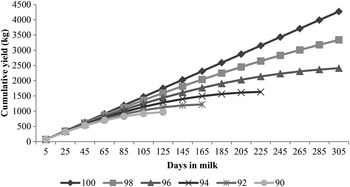
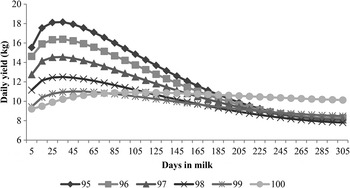
The mean coefficient of determination (R 2) was 0·9995 (minimum of 0·9886), when the individual curves of cumulative milk yield were fitted with the quadratic model (Model 1). This coefficient can be used as a measure of the goodness-of-fit of the regression model and indicates that the model was adequate to fit cumulative milk yield across lactation. Higher estimates of P were observed for first-lactation cows (Table 1). According to Lang et al. (Reference Lang, Iverson and Bowen2012), one possible explanation is the low level of mammary gland development of primiparous cows, limiting the maximum expression of peak yield. Considering all lactations up to fifth calving (AN5) (Table 1), the average P was similar to that reported by Kamidi (Reference Kamidi2005) who used data from a herd of Holstein-Friesian and Ayrshire cattle in Kenya. Lower values have been reported by Hickson et al. (Reference Hickson, Lopez-Villalobos, Dalley, Clark and Holmes2006) for four herds of Holstein-Friesian and Jersey cattle in New Zealand. The coefficient of variation for P in the first lactation and lactation up to fifth calving is small, indicating that the phenotypic variability in this trait is of low magnitude in the Gyr breed. However, this small variability had a marked impact when a more detailed analysis was performed (Figs. 1, 2).
Simulated curves for cumulative milk yield across lactation obtained for cows with the same peak yield (14 kg) and different levels of milk yield persistency until 305 d (90–100%).

Mean daily milk yield curves obtained for cows with different levels of milk yield persistency until 305 d (95 to 100%).

Number of observations (n), means, standard deviations and coefficients of variation (CV) obtained for the traits studied

AN1, analysis considering only first-lactation cows; AN5, analysis considering all lactations up to fifth calving.
Curves for cumulative milk yield across lactation obtained for cows that presented the same peak yield (14 kg, average peak for this population) and different levels of P illustrate the impact of variation in P on Y305 and LL in cows with the same peak yield (Fig. 1). A gradual decline in Y305 (mean of 13·65%) was observed per one per cent reduction in P. When P declined from 94 to 90%, LL decreased by 28 d per one per cent reduction in P.
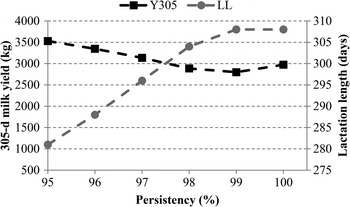
Distinct patterns of the lactation curve were observed for cows with different levels of P (Fig. 2). Cows with high P presented flat lactation curves characterised by constant daily yields across lactation and the absence of lactation peaks. In contrast, the lactation curves of cows with lower levels of P were characterised by high peaks and marked declines in daily yields after peak lactation (Fig. 2). Average LL also differed depending on the level of P, ranging from 281 d (P = 95%) to 308 d (P = 100%) (Fig. 3). On the other hand, average Y305 showed a discrete decreasing trend as P increased (Fig. 3). Haile-Mariam et al. (Reference Haile-Mariam, Bowman and Goddard2003) reported positive genetic (0·36) and environmental (0·16) correlations between lactation length and persistency, and almost null genetic (0·0) and negative environmental (−0·09) correlations between average daily milk yield and persistency. It is important to say that association among persistency and other traits, as milk yield and lactation length, will depend on the method used to estimate the persistency measure (Jakobsen et al. Reference Jakobsen, Madsen, Jensen, Pedersen, Christensen and Sorensen2002; Pereira et al. Reference Pereira, Verneque, Lopes, Santana, Lagrotta, Torres, Vercesi Filho and Machado2012).
Mean 305-d cumulative milk yield (Y305) and lactation length (LL) for cows with different levels of milk yield persistency until 305 d (95–100%).

The heritabilities for P obtained for the two data sets were identical, with mean values of 0·08 (Table 2), indicating that most part of the phenotypic variation in this trait is due to non-genetic factors and the expected response to selection would therefore be slower. In addition, average repeatability for P was 0·21 (Table 2). Similar estimates have been reported by Cole & Vanraden (Reference Cole and Vanraden2006) and Cole & Null (Reference Cole and Null2009) who studied a measure of persistency that was independent of Y305 in different taurine breeds. The authors found a heritability of 0·09–0·18 and repeatability of 0·18–0·28. The heritabilities for P obtained in the present study were generally lower than those reported in the literature for measures of persistency obtained as a function of days in milk using random regression models (Jakobsen et al. Reference Jakobsen, Madsen, Jensen, Pedersen, Christensen and Sorensen2002, Pereira et al. Reference Pereira, Verneque, Lopes, Santana, Lagrotta, Torres, Vercesi Filho and Machado2012). According to Cole & Vanraden (Reference Cole and Vanraden2006), this finding can be explained by the fact that most of these measures of persistency show a moderate to high genetic correlation with milk yield.
Posterior means, standard deviation (sd) and 95% High Density Interval (95HDI) of additive genetic (σ2a), permanent environmental (σ2pe) and residual variance (σ2r), heritability (h 2), and repeatability (r) obtained for milk yield persistency until 305 d

AN1, analysis considering only first-lactation cows; AN5, analysis considering all lactations up to fifth calving.
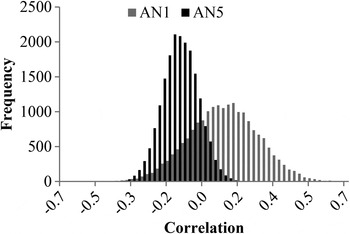
The mean phenotypic correlations between P and Y305 (Table 3) were positive for the two data sets, but low as expected. In contrast, the mean additive genetic correlations differed between the two data sets and were both of low magnitude. Considering only first lactations (AN1), the 95% High Density Interval ranged from −0·25 to 0·41, including zero within a high probability density area (Fig. 4). For the AN5 data set, the 95% High Density Interval ranged from −0·30 to 0·04, including zero but within a region of lower probability density when compared to AN1 (Fig. 4).
Marginal posterior distributions of the additive genetic correlation between milk yield persistency and 305-d cumulative yield considering only first-lactation cows (AN1) or all lactations up to fifth calving (AN5).

Posterior means, standard deviation (SD) and 95% High Density Interval (95HDI) of additive genetic (σa) and phenotypic (σp) correlations of milk yield persistency until 305 d with lactation length (LL) and 305-d cumulative yield (Y305)

AN1, analysis considering only first-lactation cows; AN5, analysis considering all lactations up to fifth calving.
The DIC value for MCOV0 was 9·96 units lower than that obtained for MCOV1, providing evidence that the additive genetic covariance between P and Y305 is null. These results indicate that, in fact, the measure of persistency studied is independent of the level of production. Positive and low genetic correlations between measures of persistency and milk yield have been reported in the literature (Cole & Vanraden, Reference Cole and Vanraden2006; Cole & Null, Reference Cole and Null2009).
The phenotypic correlations between P and LL were 0·25 and 0·29 for AN1 and AN5, respectively, indicating that cows with higher levels of persistency tend to present longer lactations (Table 3). The genetic correlation between P and LL was markedly higher when only first lactations (0·50) were considered compared to the analysis that took into account all lactations up to fifth calving (0·27). This finding indicates greater synergy between genes that control the two traits during first lactation of the productive life of cows.
The average genetic progress between 1985 and 2006 was 13·83 kg and 0·45 d per year (P < 0·0001) for Y305 and LL, respectively. On the other hand, the genetic trend for P did not differ significantly from zero (P > 0·05), indicating that selection for increased milk yield would not increase persistency, as expected since the genetic correlation between these traits was low or zero. A substantial increase in genetic gain for Y305 and LL was observed after 1993, the year when the first result of progeny testing of the breed was published. The genetic progress for Y305 and LL was 27·22 kg and 1·12 d per year, a consequence of the more intensive use of proven bulls. Again, the genetic trend for P was zero (P > 0·57). According to Pereira et al. (Reference Pereira, Santana, Bignardi, Verneque, El Faro and Albuquerque2011), the effect of pregnancy needs to be included in models used for the genetic evaluation of dairy cattle since the absence of this effect results in the overestimation of breeding values for milk yield persistency in non-pregnant cows. Prior adjustment of persistency records for this effect may provide heritability estimates higher than those obtained in the present study.
Simultaneous selection for persistency and milk yield in herds raised in tropical regions should increase milk yield without the need to increase peak yield, which is limited by the nutritional characteristics of tropical pastures. However, studies should be conducted to estimate the economic weights of each trait in a selection index.
With this results, we could conclude that milk yield persistency as measured in this study has low heritability; milk yield persistency and lactation length are moderately correlated genetically and selection for persistency can increase lactation length; the measure of milk yield persistency studied here is genetically independent of total milk yield and could be included in routine genetic evaluations of dairy cattle.