Introduction
Transition metal sulfides (MS) demonstrate versatile photoelectric and energy-related applications in view of their stable structures, semiconductor-type conductivities, and wide infrared transparent windows [Reference Guo, Chi and Guo1, Reference Xiao, Yang, Feng, Xue and Guo2, Reference Chen, Xue and Guo3, Reference Xu, Li, Xue and Guo4]. Hitherto, they have been investigated as absorber materials for solar cells [Reference Chen, Xue and Guo3], anode materials for lithium ion batteries (LIBs) [Reference Xu, Li, Xue and Guo4, Reference Veerasubramani, Park, Choi, Lee, Kim and Kim5, Reference Liu, Fang, Zhao, Yuan and Lou6], second-order nonlinear optic materials [Reference Guo, Chi and Guo1], thermoelectric materials [Reference He, Day, Zhang, Liu, Shi, Chen and Snyder7], solid-state electrolytes [Reference Ma, Xue and Guo8], all-solid-state sodium batteries [Reference Wan, Mwizerwa, Qi, Liu, Xu, Li, Hu and Yao9], etc. Recently, binary MS are extensively studied as anode materials for energy storage devices, including secondary batteries and supercapacitors. It is well known that anode materials have important influences on devices’ performances. Among these MS, iron sulfides are the most special ones because of iron’s low cost and environmentally benign characteristics. Known iron sulfides include FeS, FeS2, Fe3S4, Fe7S8, and Fe1−xS, and the first two are relatively widely explored [Reference Xu, Li, Xue and Guo4, Reference Guo, Li, Ma, Chi and Xue10]. For the others, although several studies have been addressed [Reference Guo, Li, Xiao and Xue11, Reference Zhang, Zhang, Liang, Zhu, Lin and Qian12], more investigations are necessary to better understand their potentials.
The investigation of Fe1−xS is indeed very rare among the binary iron sulfides. However, it is also a promising anode material due to its high specific capacity and safety, and the presence of more active sites for electron transport channels in view of the deficiency of Fe. Ma et al. recently prepared rod-like Fe–N–C integrated Fe1−xS@C composites via a one-step simultaneous sulfidation and nitridation of MIL-88A-Fe precursors, which could deliver a capacity of 800 mA h/g at 5 A/g and maintain long-term cycling stability [Reference Ma, Song, Zhuang, Liu, Zhang, Mao, Peng, Li and Chen13]. Wang et al. studied the lithium storage ability of Fe1−xS/C nanocomposites from sugarcane waste-derived microporous carbon, which achieved a capacity of 1185 mA h/g after 200 cycles at 100 mA/g [Reference Wang, Lan, Zhang, Bian, Yuen, Ostrikov, Jiang, Zhang, Li and Lu14]. Similar to other electrode materials, it is necessary to obtain Fe1−xS nanostructures, or provide a conductive carbon matrix to withstand the volume expansion and improve the electrode’s conductivity, both of which can effectively improve the electrochemical performance of Fe1−xS.
In recent years, graphene-based materials have been widely studied because of their excellent physical and chemical properties, including high specific surface areas, good chemical stabilities, and excellent electron transport properties. Compared with graphene, rGO has the following advantages. With the reduction of oxygen-containing functional groups on the surface of GO, the reduced nanosheets are more stable. In addition, they can also act as conductive carbon networks for holding active electrode materials for energy storage as they can well avoid the powder shedding of electrode active material, increase the electrical contact between particles, and restrict volume expansion of active materials during the charge and discharge process [Reference Park and Ruoff15].
Continuing our studies on iron sulfide–type anode materials for LIBs [Reference Ma, Xue and Guo8, Reference Guo, Li, Ma, Chi and Xue10, Reference Guo, Li, Xiao and Xue11, Reference Li, Ma, Chi and Guo16, Reference Li, Xue and Guo17, Reference Xu, Xue and Guo18, Reference Xu, Xue and Guo19], Fe1−xS/rGO composite was successfully obtained via a simple in situ hydrothermal process, and a subsequent heat treatment to improve the yield. As anode active material, Fe1−xS/rGO shows good lithium storage performance. Although rGO has been widely applied as the conductive matrix to improve various electrode materials’ performances, there is no study on its combination with Fe1−xS. Fe1−xS/rGO has a high capacity of 907.8 mA h/g after 200 cycles at 100 mA/g, and it also demonstrates a good performance rate.
Results and discussion
Structure and morphology characterizations
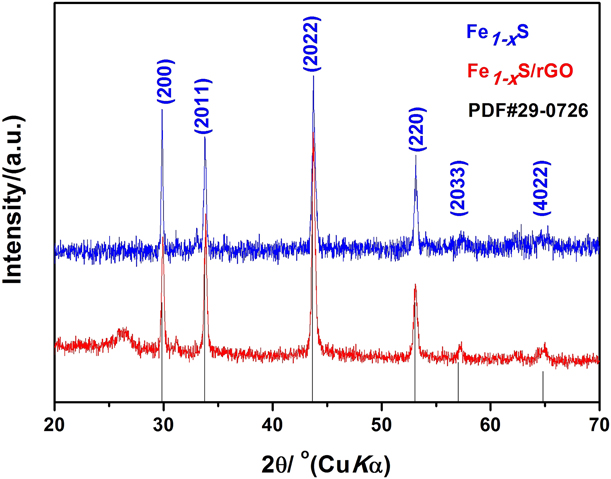
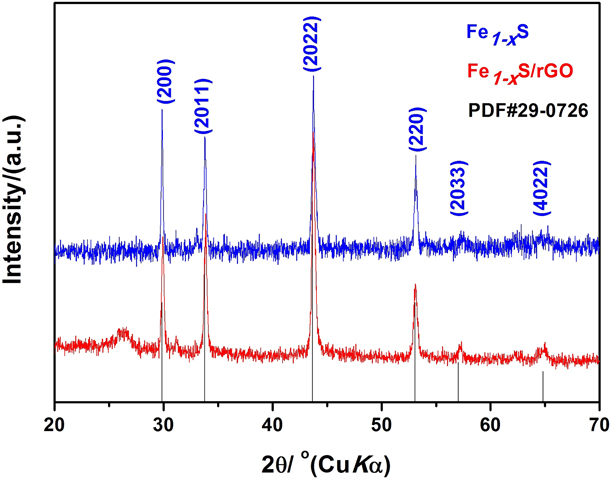
Figure 1 shows the XRD patterns of the as-prepared Fe1−xS and Fe1−xS/rGO samples. All the peaks are well matched with the known one (PDF# 75-0601) without other miscellaneous peaks. Fe1−xS crystallizes in the hexagonal space group P6/mmc, and the broad peak at 27° is ascribed to rGO [Reference Wang, Chou, Liu and Dou20]. Compared with pure Fe1−xS, the peak width of Fe1−xS/rGO is a little larger, indicating that Fe1−xS particles in the composite have smaller crystal sizes than pure Fe1−xS particles. The content of Fe1−xS in Fe1−xS/rGO is about 75.8% as derived from the calculation of the mass loss of Fe1−xS/rGO after high-temperature calcination in air.
XRD patterns of Fe1−xS and Fe1−xS/rGO.
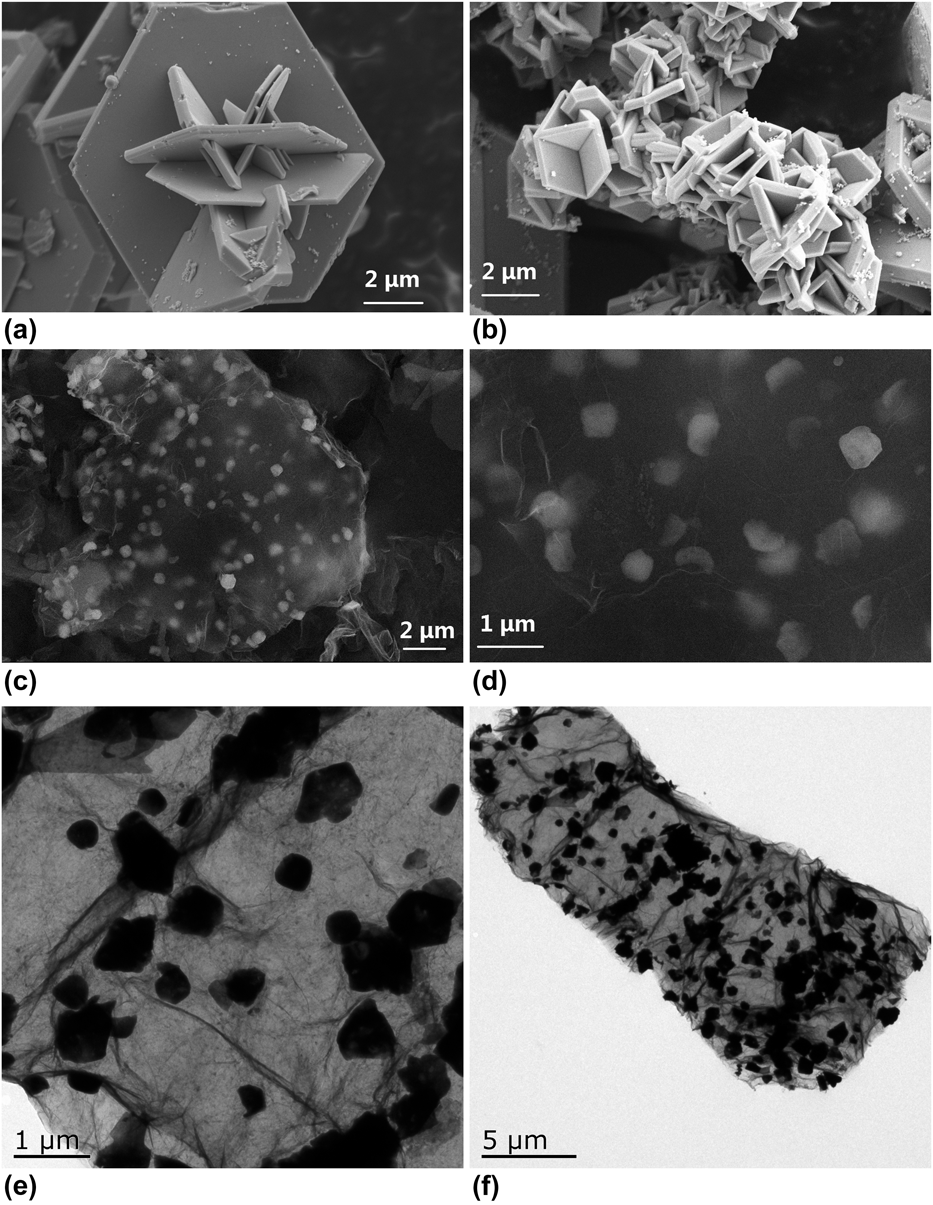
As shown in Fig. 2, the pure Fe1−xS sample (a and b) shows concave hexagonal flakes, which are aggregated together. The Fe1−xS particles have length in the range of 2–5 µm and thickness of ∼240 nm, while the Fe1−xS particles in Fe1−xS/rGO (c and d) have much smaller lengths (∼450 nm) and more uniform dispersion, indicating that the composite has a larger specific surface area. The smaller size and the larger specific surface area at the grain boundaries are favorable for Li+ ion diffusion, and the rGO matrix can effectively restrict the volume expansion of Fe1−xS during cycling, thereby being conducive to improve the electrochemical performance. The TEM images (e and f) show the size and dispersion of Fe1−xS particles in the composite more clearly, demonstrating highly consistent results with the SEM images.
SEM images of pure Fe1−xS (a, b) and Fe1−xS/rGO (c, d), and TEM images of Fe1−xS/rGO (e, f).

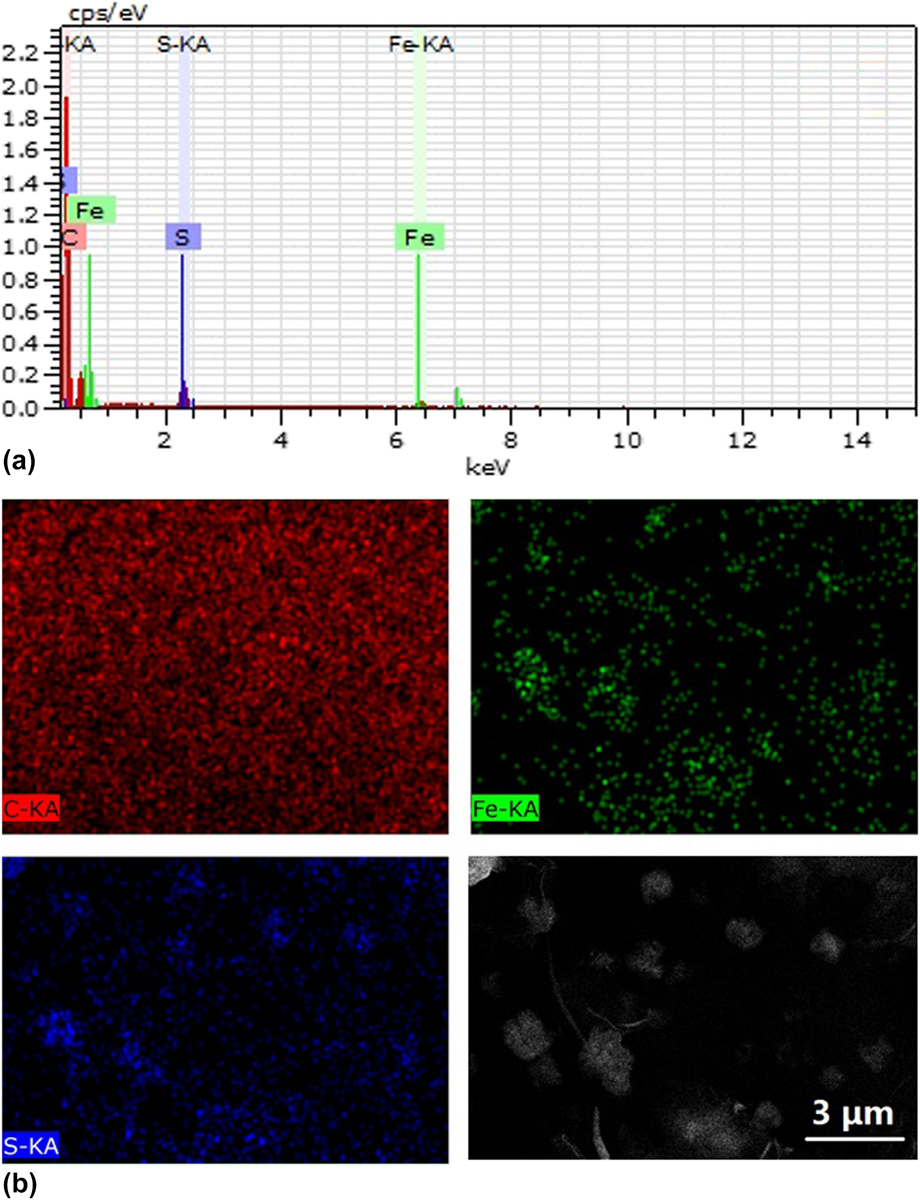
The EDS analysis of Fe1−xS/rGO and EDS elemental mapping images for Fe, S, and C in Fe1−xS/rGO are shown in Fig. 3. Elements Fe, S, and C are all distributed, indicating that Fe1−xS is relatively uniformly dispersed in the rGO matrix. The EDS mapping images reveal that Fe and S are well covered by C, indicating that Fe1−xS is well wrapped by rGO.
(a) EDS analysis of Fe1−xS/rGO; (b) EDS elemental mapping images for Fe, S, and C in Fe1−xS/rGO.
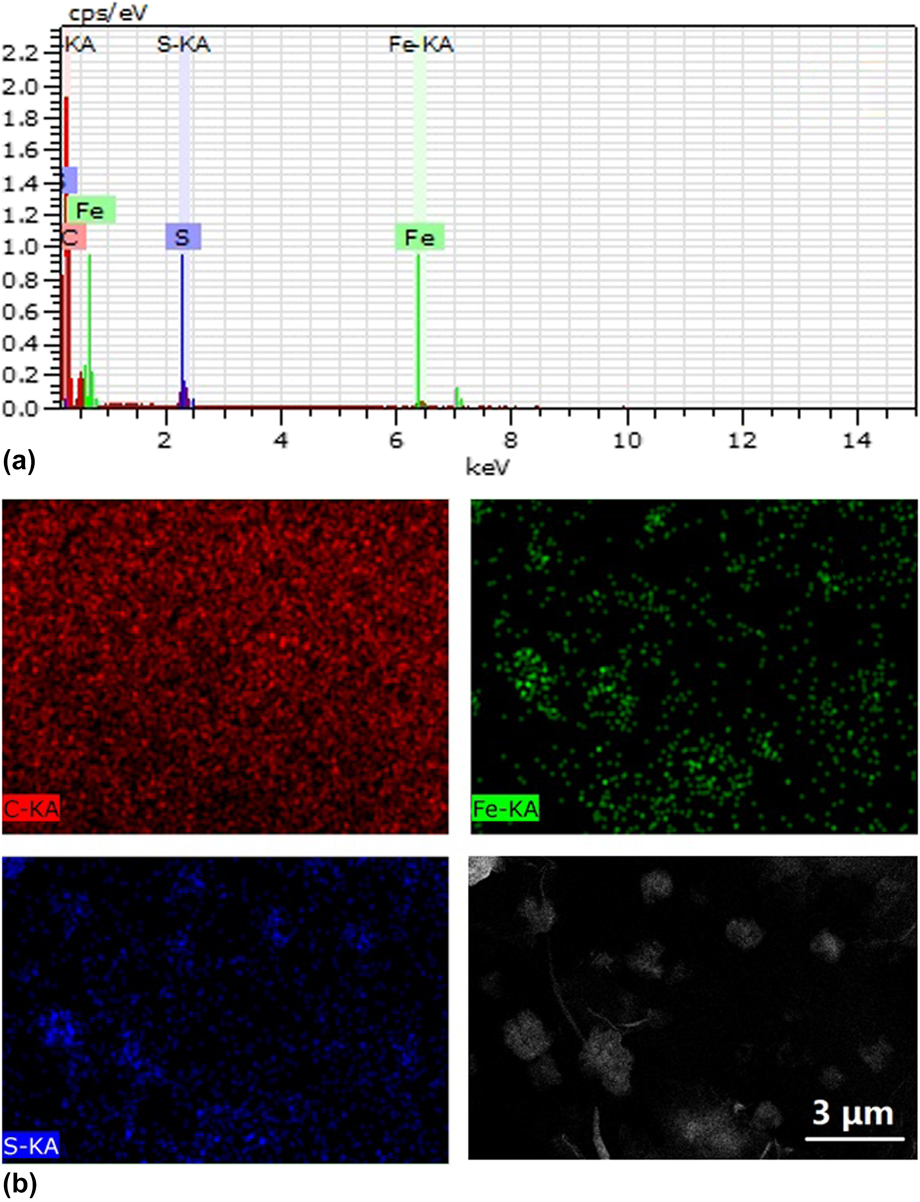
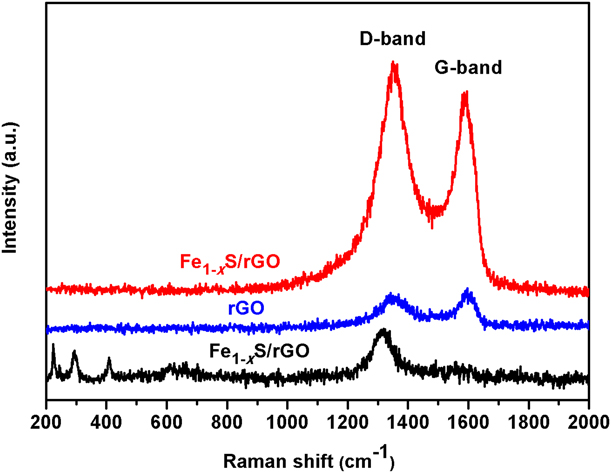
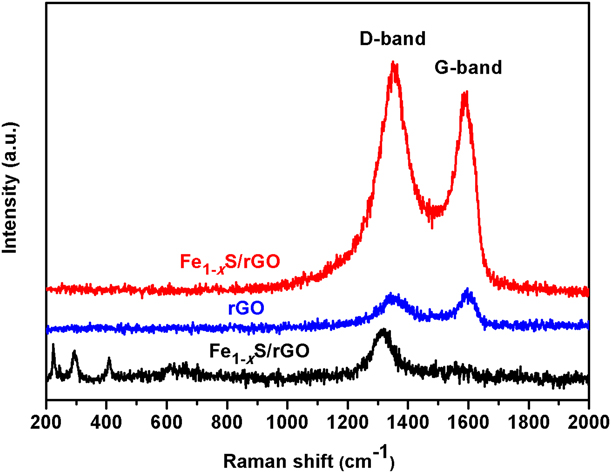
Figure 4 shows the Raman spectra of rGO, Fe1−xS, and Fe1−xS/rGO. The peaks at 1350.29 and 1586.94 cm−1 correspond with the D- and G-bands of carbon, respectively. The relative intensity of the D-band is a reflection of the edge properties of graphene, such as defects and gaps [Reference Dong, Yang, Chhowalla and Loh21], and the G-band characterizes carbon’s sp 2 bond structure vibrational pattern and relates to graphite’s properties [Reference Tang, Li, Yi, Wang, Yu, Gao, Cui, Chu, Li and Zhang22]. Compared with the I D:I G of 0.9 for pure rGO, the intensity ratio of D and G bands becomes larger (I D:I G = 1.146), indicating a certain degree of defect that leads to the increase in the D-band intensity, and also provides the channels and active sites for Li+ ion transport, thereby improving the cycling stability [Reference Wei, Zheng, Yue and Guo23].
Raman spectra of Fe1−xS, rGO and Fe1−xS/rGO.
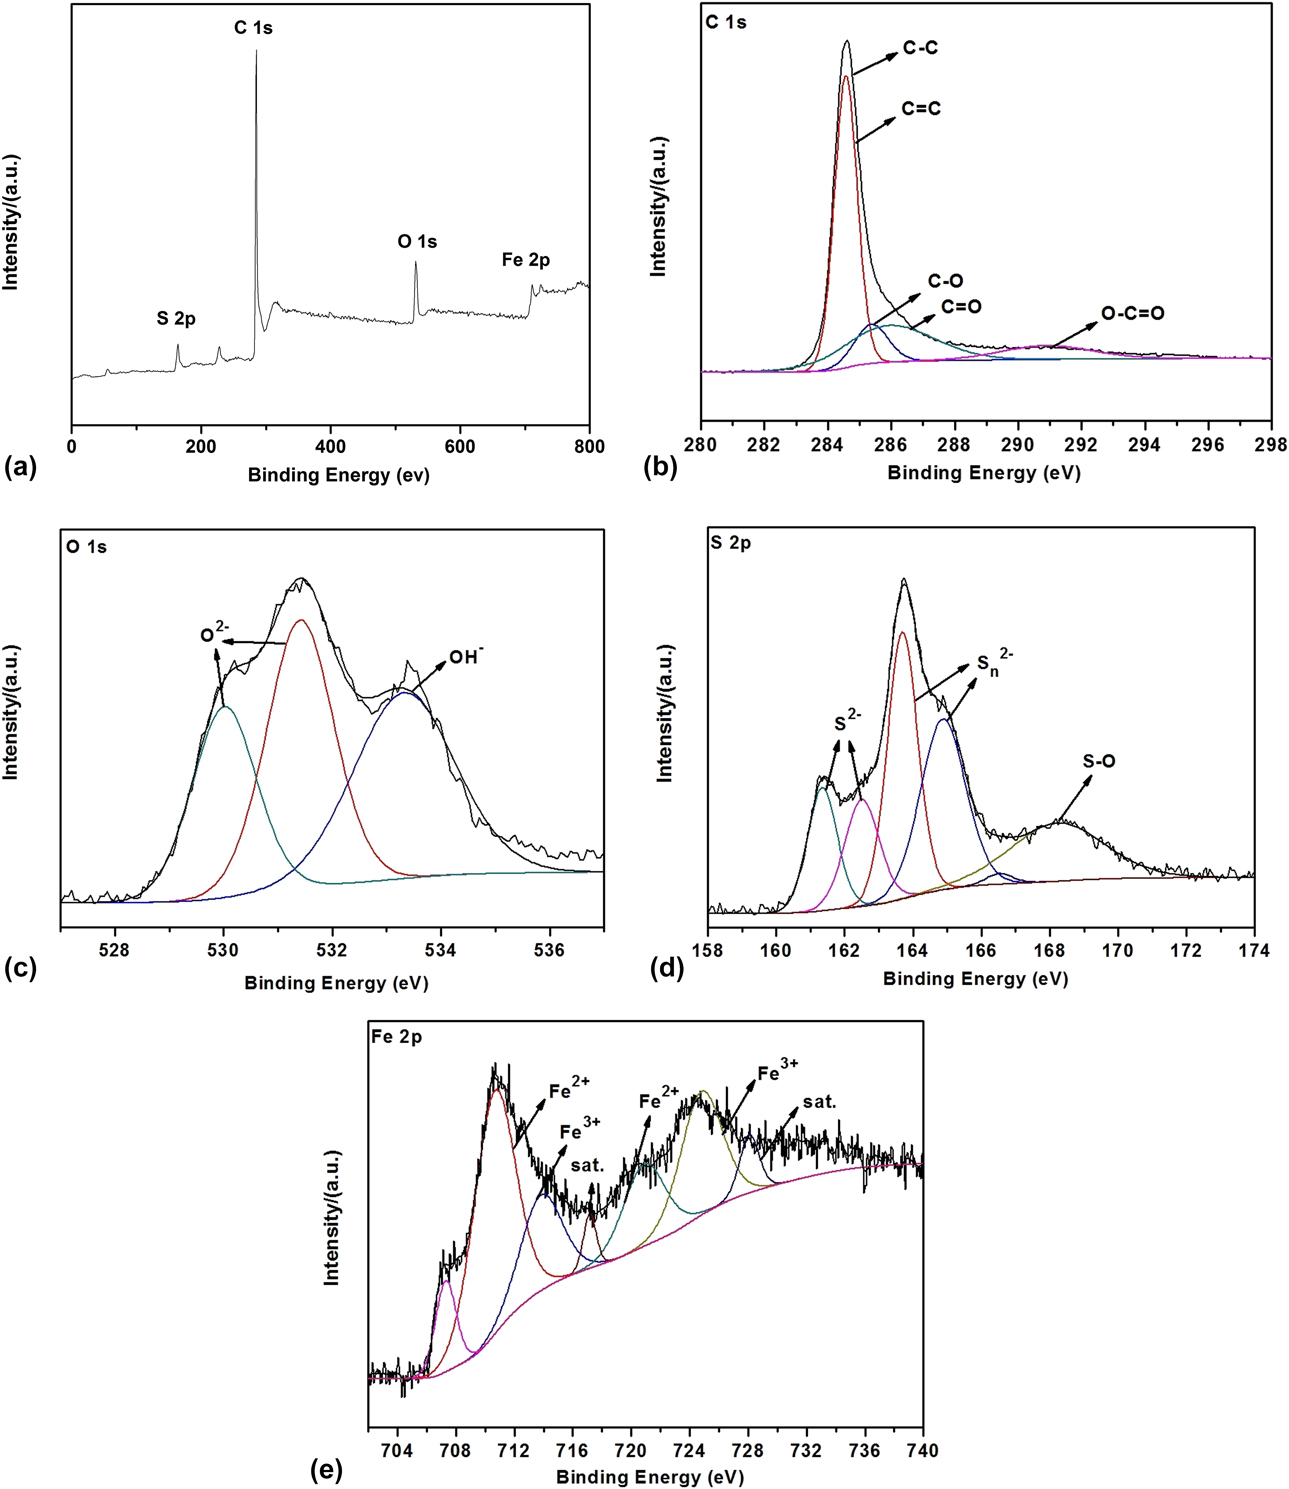
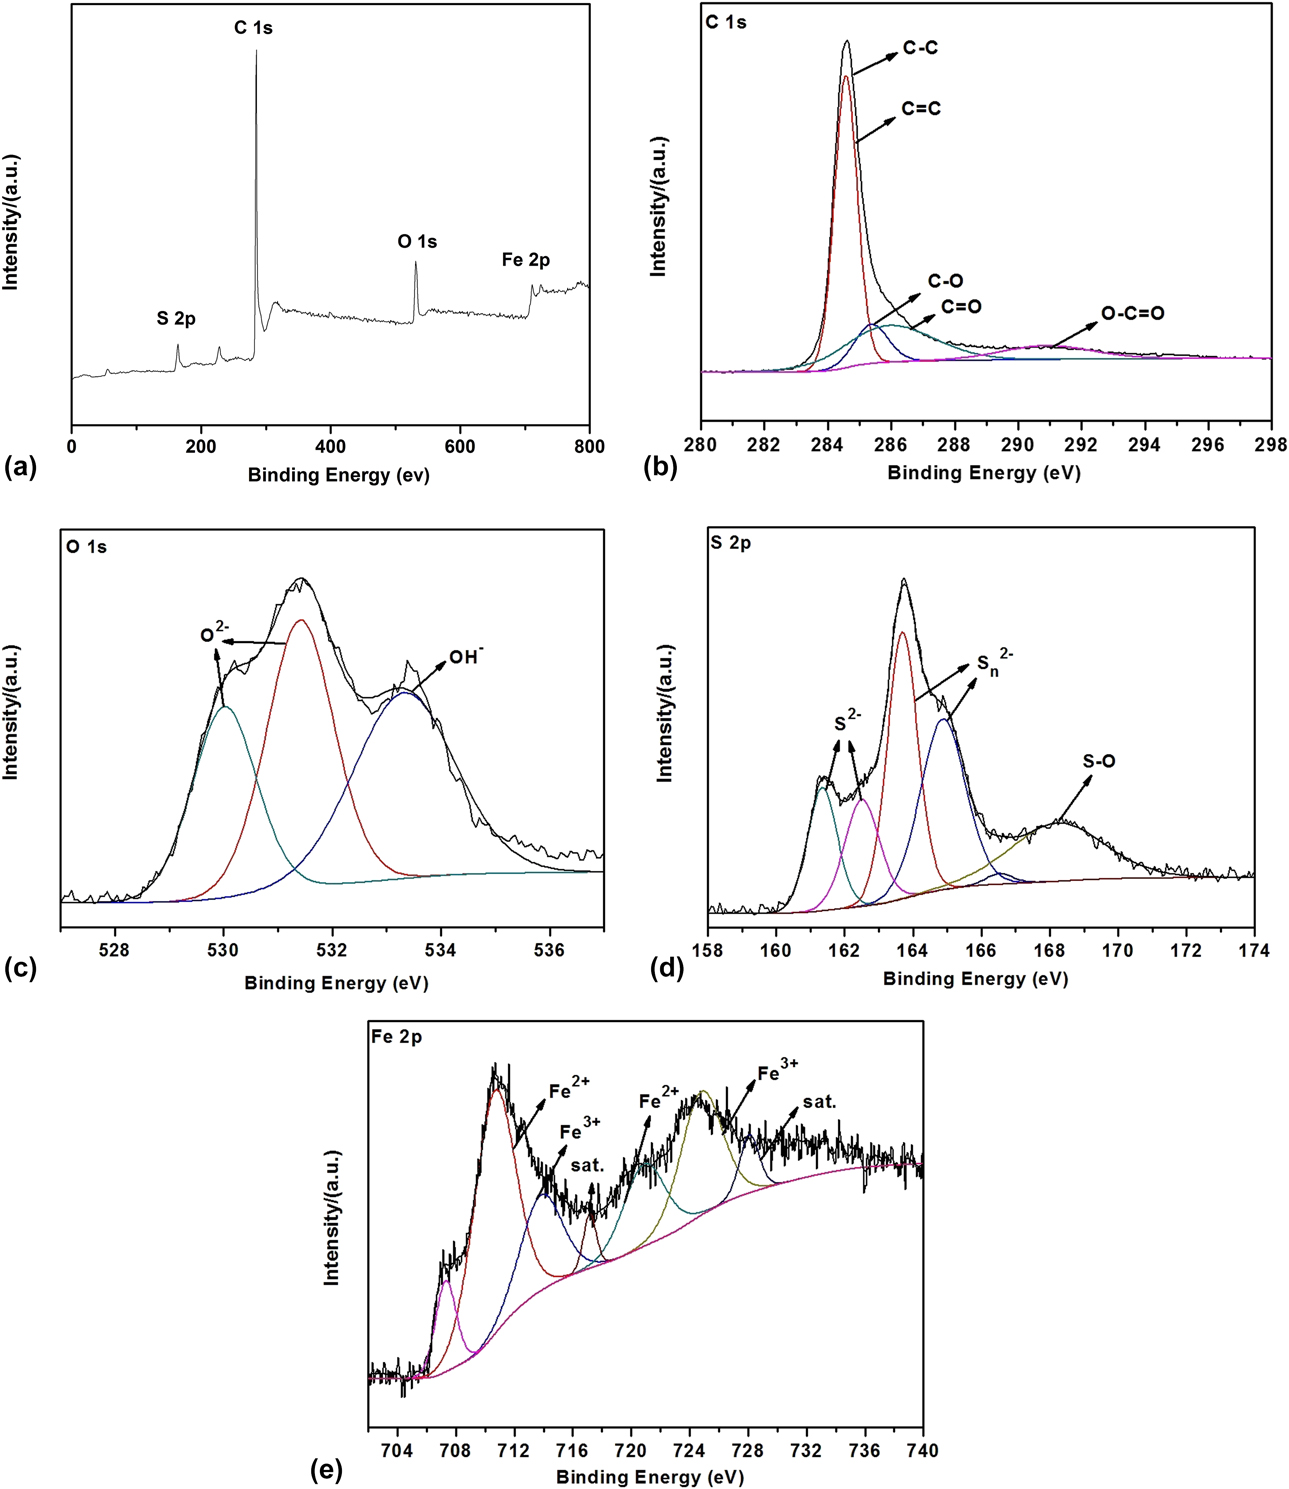
In order to explore the chemical composition and valence distribution of Fe1−xS/rGO, XPS measurement (Fig. 5) was performed. The survey spectrum [Fig. 5(a)] shows peaks of Fe, S, C, and O elements. The C 1s spectrum [Fig. 5(b)] contains five peaks at 284.59, 285.59, 286.24, 287.76, and 291.56 eV, attributable to C–C, C=C, C–O, C=O, and O–C=O, respectively [Reference Xie, Liu, Cao, Zhu and Zhao24]. The existence of C–O and O–C=O bonds indicates that graphene is not fully oxidized after the hydrothermal reaction [Reference Yao, Gong, Yang, Xiao, Zhang, Keyshar, Ye, Ozden, Vajtai and Ajayan25]. In the Fe 2p spectrum [Fig. 5(e)], the two peaks observed at 710.89 and 721.22 eV belong to the 2p 1/2 and 2p 3/2 of Fe2+, respectively, whereas the peaks centered at 714.04 and 724.90 eV can be attributed to the 2p 1/2 and 2p 3/2 of Fe3+, respectively. The peaks at 717.16 and 728.14 eV correspond to the satellite ones. The characteristic peak at 707.2 eV indicates the existence of Fe0. In the process of high temperature heat treatment, carbon can be used as the reductant to reduce Fe3+ or Fe2+ to Fe0 [Reference Ma, Song, Zhuang, Liu, Zhang, Mao, Peng, Li and Chen13]. The peaks at 161.35, 162.51, 163.69, and 164.87 eV in the S 2p spectrum [Fig. 5(d)] correspond to S2−, while the other two peaks at 166.52 and 168.22 eV correspond to the S–O bond in the oxidized group (SOx).
XPS spectra of Fe1−xS/rGO: (a) total; (b) C 1s; (c) O 1s; (d) S 2p; (e) Fe 2p.
Electrochemical performance
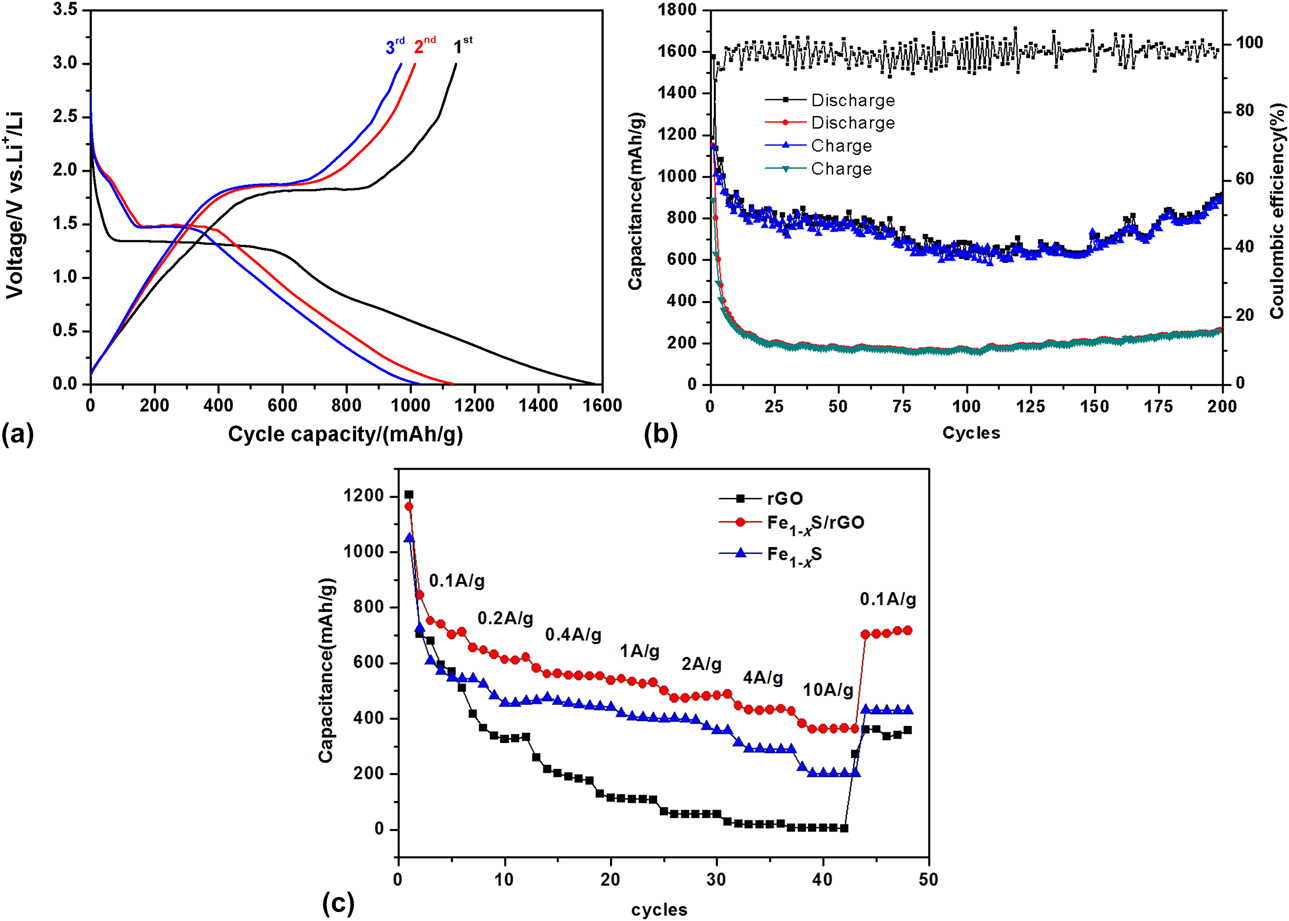
The first three cycles’ charge and discharge capacity curves of Fe1−xS/rGO at 100 mA/g in the voltage range of 0.005–3 V at room temperature are shown in Fig. 6(a). It can be clearly seen that the cycling stability of Fe1−xS/rGO is much higher than that of pure Fe1−xS, and there is a large plateau around 1.3 V in the first discharge cycle, and the plateau position moves to 1.47 V in the subsequent cycles. The first discharge and charge capacities can reach to 1575.5 and 1142.1 mA h/g, leading to an irreversible capacity loss of 433.4 mA h/g, which can be attributed to the inevitable decomposition of the electrolyte and the formation of a solid electrolyte interphase (SEI) film on the surface of the electrode [Reference Zhu, Fan, Suo, Luo, Gao and Wang26]. In addition, migration of the voltage plateau also adequately verifies the great reversibility by the formation of an SEI film [Reference Xu, Li, Xue and Guo27]. However, for pure Fe1−xS, its initial discharge capacity is only 1151.5 mA h/g, much lower than that of Fe1−xS/rGO. Figure 6(b) shows the cycling performance of rGO, Fe1−xS, and Fe1−xS/rGO at a current density of 100 mA/g. The initial discharge capacity of pure rGO is 1127.4 mA h/g. However, the discharge capacities decrease fast during the first 10 cycles and are stabilized at around 300 mA h/g afterward. Fe1−xS/rGO exhibits a very stable cycling behavior, and the discharge capacity at the second cycle is 1134.7 mA h/g, and even after 60 cycles, its capacity remains as high as 801 mA h/g. In the subsequent cycles, its discharge capacity is stable at 686.9 mA h/g after 150 cycles. Interestingly, its capacity is slowly increased for the following cycles. The discharge capacity reaches 907.8 mA h/g after 200 cycles. The rapid capacity attenuation of Fe1−xS and pure rGO is inevitable because of the volume change caused by the destruction of the internal structure, which makes the contact interface between the active material particles worse and the loss of the active substance more serious. The properties of Fe1−xS particles coated by the rGO matrix are stable, and its unique structure inhibits the volume change of Fe1−xS particles during the cycling, thus improving the cycle stability. Due to the high electron conductivity and the charge mobility of rGO, the contact resistance of the electrode is reduced, which makes the electrons migrate easily [Reference Yao, Gong, Yang, Xiao, Zhang, Keyshar, Ye, Ozden, Vajtai and Ajayan25]. The phenomenon of capacity recovery may be induced by the formation of a polymeric gel-like film by kinetic activation in the electrode, and the electrode impedance decreases along with cycling [Reference Cabana, Monconduit, Larcher and Palacin28, Reference Whittingham29]. In addition, more Li+ ions are inserted with the appearance of more defects and vacancies in the active materials. Furthermore, the transfer of electrons is more effective and stable under the influence of higher crystallinity and lower resistivity of active materials. Thus, the capacity increases for the late cycles [Reference Yang, Wu, Gong, Feng, Chen and Liao30]. This phenomenon has also found in several recent investigations [Reference Braga, Subramaniyam, Murchison and Goodenough31, Reference Xiao, Hwang and Sun32, Reference Sun, Hu, Luo, Xia and Huang33].
Electrochemical data of Fe1−xS and Fe1−xS/rGO. (a) Charge and discharge curves of Fe1−xS/rGO for the first three cycles; (b) cycling performance of rGO, Fe1−xS, and Fe1−xS/rGO at 100 mA/g; (c) rate capabilities of rGO, Fe1−xS, and Fe1−xS/rGO.
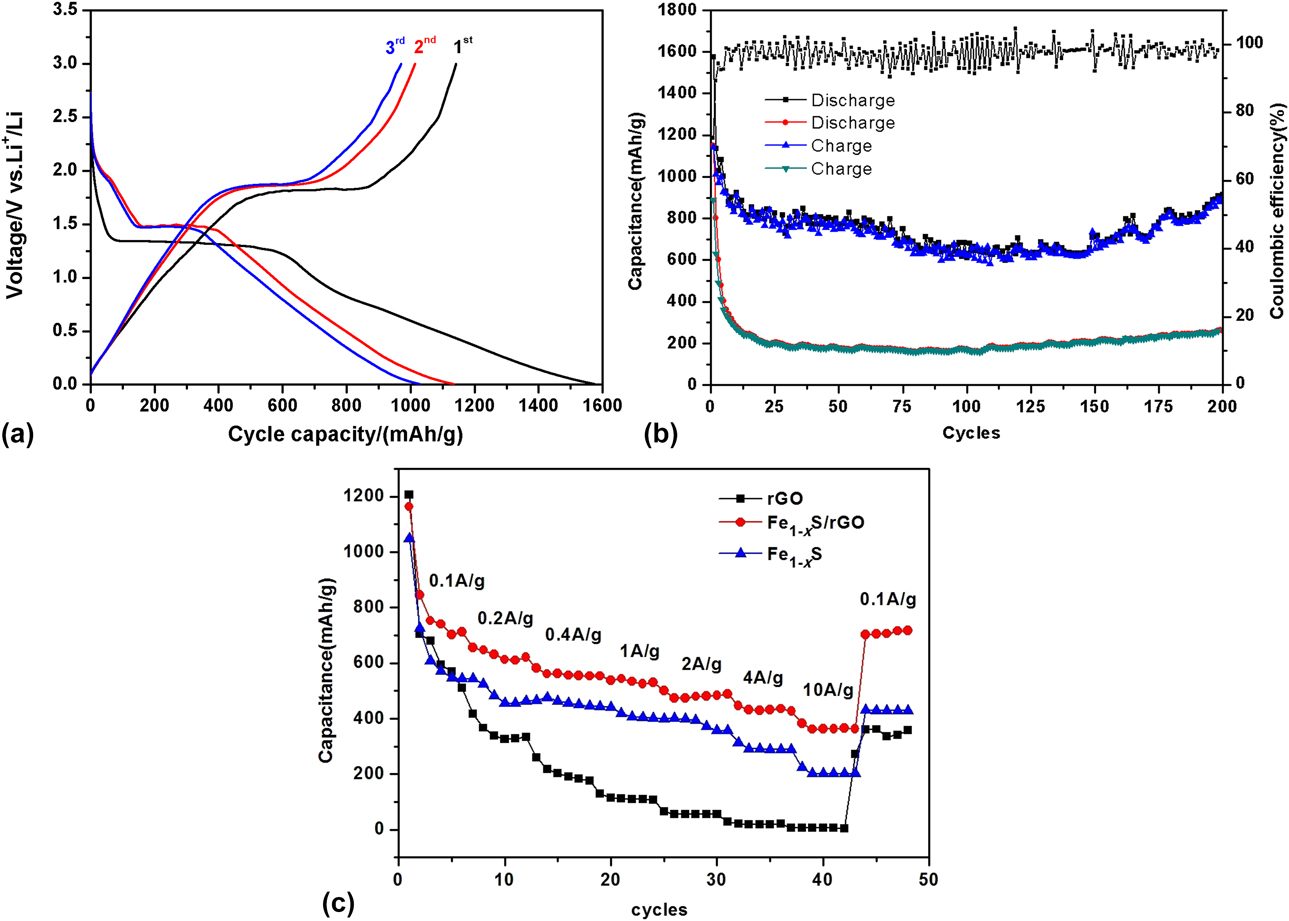
Apart from the high capacity and good cycling stability, Fe1−xS/rGO also exhibits good rate performance [Fig. 6(c)]. The electrode was further tested at current densities from 0.1 to 10 A/g and then back to 0.1 A/g. As the current densities increased from 0.1 to 0.2, 0.4, 0.8, 1.0, 2.0, 4.0, 8.0, and 10.0 A/g, the reversible capacities of the Fe1−xS/rGO electrodes were 1164, 712.94, 609, 564, 556, 486, 473, 398, and 288.9 mA h/g, respectively. When the current density was recovered back to 100 mA/g, the specific capacity rebounded to 717 mA h/g. The good rate performance of Fe1−xS/rGO can be attributed to their small sizes, which can lead to the rapid kinetics of the redox reactions of Li+ ions, and the diffusion of electrons from the electrolyte–particle interface. At the same time, the rGO matrix also can effectively alleviate the local volume changes in the Li+ insertion/extraction process; it can maintain the structural integrity of the electrode during cycling and hinder the aggregation of Fe1−xS particles, thus improving the cycling stability. Most importantly, the rGO matrix reduces polysulfide dissolution by absorbing and trapping the internal polysulfide [Reference Xiao, Hwang, Belharouak and Sun34, Reference Chen, Song, Mi, Feng, Zhang, Cui and Liu35].
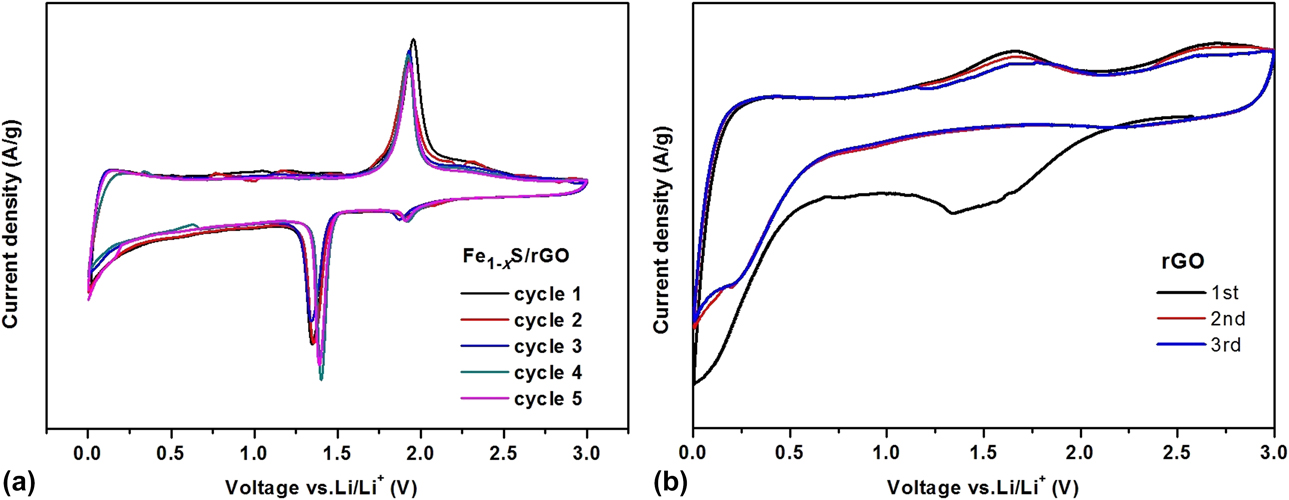
To better understand the electrochemical reaction mechanism of Fe1−xS/rGO, cyclic voltammetry (C-V) measurements were carried out in the voltage range of 0.05–3.0 V with a scan rate of 0.1 mV/s. As shown in Fig. 7, a large oxidation peak at around 2.01 V in the initial cycle was observed, and it was caused by the corresponding conversion reaction of Fe and Li to Li2−xFeS2. In the subsequent cycles, the oxidation peak shifts to about 1.93 V, which was attributed to the formation of active material on the surface of the SEI layer.
 $$2{\rm{F}}{{\rm{e}}_{1 - x}}{\rm{S}} + 2 - x\;{\rm{Li}} + {{\rm{e}}^ - } \to {\rm{L}}{{\rm{i}}_{2 - x}}{\rm{Fe}}{{\rm{S}}_2} + {\rm{Fe}}\quad 2.01\;{\rm{V}}\quad {\rm{.}}$$
C-V curves for Fe1−xS/rGO (a) and rGO (b).
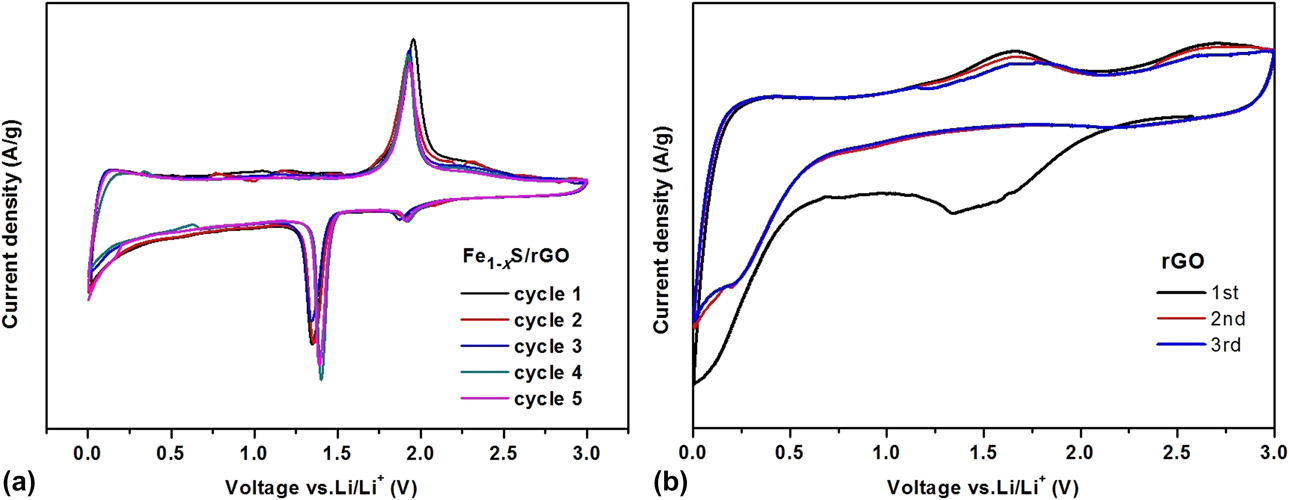
The positive scan showed two peaks at 1.40 and 1.91 V, corresponding to the reduction reactions of the formation of Li2−xFeS2 and the reversible delithiation process (Li2−xFeS2 to Li2FeS2), respectively [Reference Wang, Lan, Zhang, Bian, Yuen, Ostrikov, Jiang, Zhang, Li and Lu14].
 $${\rm{F}}{{\rm{e}}_{1 - x}}{\rm{S}} + 2{\rm{Li}} + 2{{\rm{e}}^ - } \to {\rm{L}}{{\rm{i}}_2}{\rm{Fe}}{{\rm{S}}_2} + {\rm{Fe}}\quad 1.40\;{\rm{V}}\quad ,$$
 $${\rm{LiFe}}{{\rm{S}}_2} \leftrightarrow {\rm{L}}{{\rm{i}}_{2 - x}}{\rm{Fe}}{{\rm{S}}_2} + x{\rm{L}}{{\rm{i}}^ + } + x{{\rm{e}}^ - }\quad 1.91\;{\rm{V}}\quad .$$
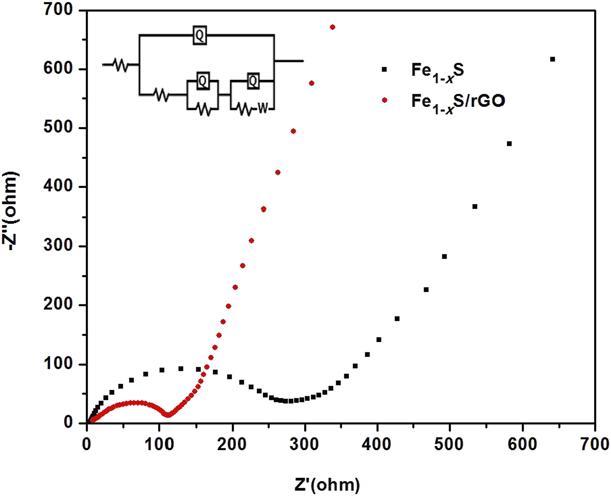
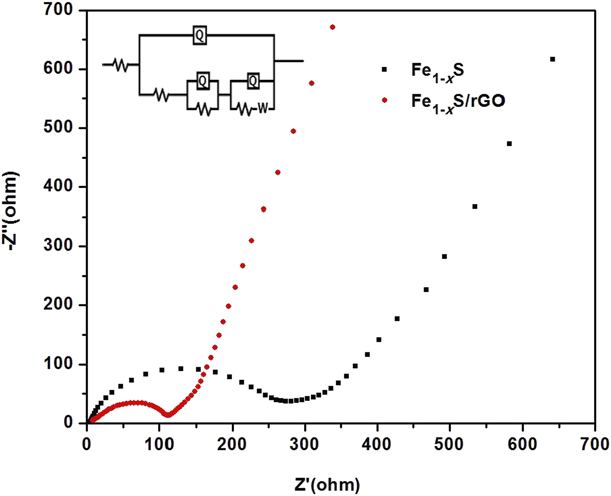
As shown in Fig. 8, the high-frequency region of the electrochemical impedance spectra (EIS) curve is a semicircle related to partial desolvation of Li+ ions in the solvated electrode surface and adsorption of Li+ ions. Apparently, there are two curves that correspond to the Fe1−xS and Fe1−xS/rGO electrodes, and their R ct values were calculated to be 269 and 104 Ω, respectively. This indicates that the composite of Fe1−xS particles wrapped by rGO sheets can provide much easier charge transfer at the electrode–electrolyte interface, and consequently decrease the overall battery internal resistance, enabling higher reactivity and lower polarization. The low-frequency region is a straight line related to the solid-state diffusion of Li+ ions, and the slope is controlled by diffusion. The tilt angle of the curve is close to 45°, indicating that Li+ ions diffuse well in the electrode pores.
Nyquist plots for Fe1−xS/rGO and pure Fe1−xS in the frequency range of 0.01–105 Hz.
Conclusions
Fe1−xS@rGO prepared by an in situ hydrothermal method as active anode electrodes for LIBs shows good electrochemical performance, which can be attributed to the unique chemical composition, structure, and morphology of Fe1−xS particles wrapped in an rGO matrix. To date, Fe1−xS is very rarely studied for its potentials as anode materials for secondary batteries, and this work demonstrates a facile synthesis of a simple composite with good electrochemical performance. It is expected that this work can attract more interest on this type of non-stoichiometric material’s potential for energy storage.
Experimental
Preparation of Fe1−xS@rGO
GO was prepared by the modified Hummers method [Reference Guo, Li, Xiao and Xue11]. Fe1−xS/rGO was synthesized via an in situ hydrothermal method: 60 mg of GO was dispersed in 70 mL deionized water under ultrasonic condition to obtain a GO solution, which was then transferred to a Teflon-lined stainless-steel autoclave (100 mL), under magnetic stirring for 1 h. Then, FeCl2·4H2O (AR, Macklin) and thiourea (AR, Aladdin) were added to the uniform GO solution, stirring for another 30 min. Then, the autoclave was placed into an oven and maintained at 120 °C for 12 h. When cooling to the room temperature naturally, the products were washed by deionized water and anhydrous ethanol more than three times and dried in vacuum at 70 °C for 12 h, followed by annealing under N2 at 600 °C for 2 h to improve the yield. Pure Fe1−xS was obtained by the same method without adding GO and annealing.
Material characterizations
Powder X-ray diffraction (PXRD, Bruker D8 Advance) patterns were collected at 40 kV and 100 mA for Cu-Kα radiation (λ = 1.5406 Å) with a scan speed of 5°/min. Field emission scanning electron microscopy (SEM, Zeiss-supra55) and transmission electron microscopy (TEM; Philips Tecnai12) were used to characterize the samples’ morphologies. EDS mapping, X-ray photoelectron spectroscopy (XPS; Thermofisher Scientific ESCALAB250Xi), and Raman spectrum (Renishaw in Via) were used to analyze the chemical structures and chemical compositions for both Fe1−xS and Fe1−xS/rGO.
Electrochemical measurements
The electrode slurry was prepared using Fe1−xS/rGO (or pure Fe1−xS), carbon black, and polyvinylidene fluoride (PVDF) with a weight ratio of 7:2:1 dissolved in a certain amount of N-methyl-2-pyrrolidinone (NMP). The slurry was coated evenly onto an aluminum foil after stirring for 8 h, and it was then cut into Φ1.6 cm disks after drying at 80 °C for 8 h. The disks were dried at 120 °C for 12 h under vacuum. The mass of the active material was around 1 mg. The CR-2032-type coin cell was assembled in a glovebox filled with argon (VAC-Omni 102283); Li foil and Celgard 2325 film were used as the counter-electrode and separator, respectively, and the electrolyte used was 1 M LiPF6 in 1:1 DEC/EC. The charge/discharge measurements were obtained at a current density of 100 mA/g in the potential range of 0.05–3.0 V using a NEWARE CT-3008 charge–discharge system. The cells were first discharged to 0.05 V, and then the cycle number was counted. Cyclic voltammetry (C-V) and electrochemical impedance spectra (EIS) were carried out on a CHI600D electrochemical workstation. The C-V curves were performed over the voltage range of 0.001–3.0 V with the scan rate of 0.1 mV/s. The EIS were performed in the frequency range between 100 kHz and 0.01 Hz.
Acknowledgments
We gratefully acknowledge the financial support by the NSF of China (21673203 and 21771159), Qing Lan project from Yangzhou University, the Priority Academic Program Development of Jiangsu Higher Education Institutions, and Top-notch Academic Programs Project of Jiangsu Higher Education Institutions.